An official website of the United States government
 United States Department of Labor
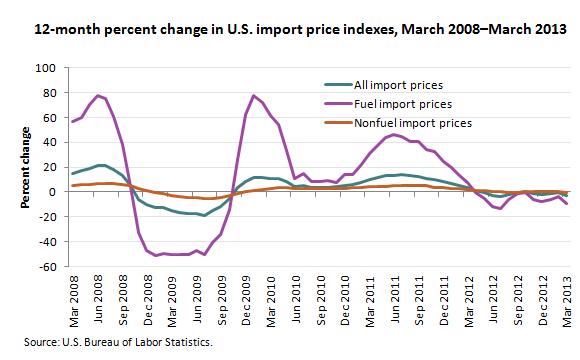
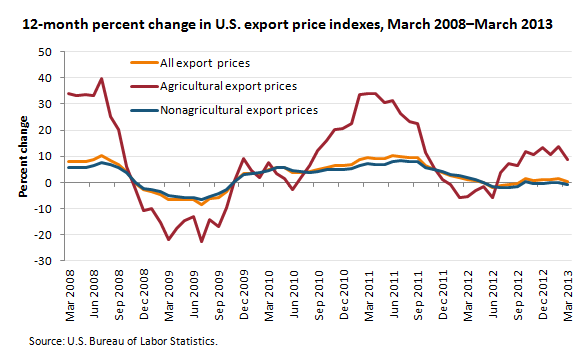
The price index for U.S. imports declined 2.7 percent from March 2012 to March 2013. U.S. export prices edged up 0.3 percent over the same 12-month period.

| Month | All import prices | Fuel import prices | Nonfuel import prices |
|---|---|---|---|
Mar 2008 | 15.2 | 57.0 | 5.1 |
Apr 2008 | 16.9 | 59.7 | 6.0 |
May 2008 | 19.1 | 70.2 | 6.0 |
Jun 2008 | 21.3 | 77.9 | 6.4 |
Jul 2008 | 21.4 | 75.2 | 6.7 |
Aug 2008 | 18.1 | 60.7 | 6.6 |
Sep 2008 | 13.1 | 38.5 | 6.1 |
Oct 2008 | 4.9 | 4.5 | 4.8 |
Nov 2008 | -5.9 | -32.9 | 2.6 |
Dec 2008 | -10.1 | -47.0 | 1.2 |
Jan 2009 | -12.5 | -51.4 | -0.3 |
Feb 2009 | -12.7 | -49.8 | -1.2 |
Mar 2009 | -14.9 | -50.7 | -2.8 |
Apr 2009 | -16.4 | -50.8 | -3.8 |
May 2009 | -17.3 | -50.7 | -4.1 |
Jun 2009 | -17.5 | -47.6 | -4.5 |
Jul 2009 | -19.1 | -50.6 | -5.3 |
Aug 2009 | -15.3 | -41.0 | -5.1 |
Sep 2009 | -12.0 | -34.0 | -4.2 |
Oct 2009 | -5.6 | -14.2 | -3.1 |
Nov 2009 | 3.4 | 26.4 | -1.1 |
Dec 2009 | 8.6 | 62.2 | 0.3 |
Jan 2010 | 11.4 | 77.8 | 1.3 |
Feb 2010 | 11.3 | 72.0 | 1.9 |
Mar 2010 | 11.2 | 61.7 | 2.7 |
Apr 2010 | 11.2 | 54.4 | 3.2 |
May 2010 | 8.5 | 33.5 | 3.5 |
Jun 2010 | 4.3 | 10.7 | 2.9 |
Jul 2010 | 4.9 | 14.7 | 2.8 |
Aug 2010 | 3.8 | 8.4 | 2.7 |
Sep 2010 | 3.6 | 8.1 | 2.5 |
Oct 2010 | 3.9 | 9.5 | 2.5 |
Nov 2010 | 4.1 | 8.0 | 3.0 |
Dec 2010 | 5.3 | 14.2 | 3.0 |
Jan 2011 | 5.6 | 13.9 | 3.4 |
Feb 2011 | 7.6 | 21.1 | 3.8 |
Mar 2011 | 10.3 | 31.0 | 4.4 |
Apr 2011 | 11.9 | 37.3 | 4.6 |
May 2011 | 12.9 | 43.7 | 4.5 |
Jun 2011 | 13.6 | 46.1 | 5.0 |
Jul 2011 | 13.7 | 44.8 | 5.4 |
Aug 2011 | 12.9 | 40.3 | 5.4 |
Sep 2011 | 12.7 | 40.9 | 5.4 |
Oct 2011 | 11.1 | 34.3 | 4.8 |
Nov 2011 | 10.1 | 32.4 | 3.7 |
Dec 2011 | 8.5 | 24.9 | 3.4 |
Jan 2012 | 6.9 | 19.8 | 2.9 |
Feb 2012 | 5.1 | 13.4 | 2.4 |
Mar 2012 | 3.5 | 7.9 | 2.0 |
Apr 2012 | 0.8 | -0.5 | 1.3 |
May 2012 | -0.8 | -5.5 | 0.9 |
Jun 2012 | -2.5 | -11.5 | 0.6 |
Jul 2012 | -3.3 | -13.4 | 0.0 |
Aug 2012 | -1.8 | -6.1 | -0.4 |
Sep 2012 | -0.6 | -1.5 | -0.4 |
Oct 2012 | 0.0 | -0.8 | 0.1 |
Nov 2012 | -1.4 | -6.2 | 0.2 |
Dec 2012 | -2.0 | -7.9 | 0.0 |
Jan 2013 | -1.5 | -6.0 | 0.0 |
Feb 2013 | -0.8 | -3.3 | 0.1 |
Mar 2013 | -2.7 | -9.1 | -0.5 |
The price index for imported fuel declined 9.1 percent from March 2012 to March 2013, led by a 10.4-percent drop in petroleum prices, which more than offset a 47.1-percent rise in natural gas prices. Prices for nonfuel imports fell 0.5 percent over the past 12 months.
Led by higher agricultural prices, prices for exports increased 0.3 percent from March 2012 to March 2013, the smallest year-over-year advance since September 2012.

| Month | All export prices | Agricultural export prices | Nonagricultural export prices |
|---|---|---|---|
Mar 2008 | 7.9 | 34.0 | 5.5 |
Apr 2008 | 8.0 | 33.3 | 5.7 |
May 2008 | 8.1 | 33.6 | 5.7 |
Jun 2008 | 8.7 | 33.1 | 6.5 |
Jul 2008 | 10.2 | 39.7 | 7.6 |
Aug 2008 | 8.3 | 25.0 | 6.8 |
Sep 2008 | 7.0 | 20.1 | 5.8 |
Oct 2008 | 4.0 | 6.0 | 3.8 |
Nov 2008 | -0.3 | -2.7 | 0.0 |
Dec 2008 | -2.9 | -10.9 | -2.2 |
Jan 2009 | -3.4 | -10.0 | -2.7 |
Feb 2009 | -4.5 | -15.4 | -3.4 |
Mar 2009 | -6.7 | -22.0 | -5.0 |
Apr 2009 | -6.7 | -17.5 | -5.4 |
May 2009 | -6.6 | -14.7 | -5.6 |
Jun 2009 | -6.6 | -13.1 | -5.9 |
Jul 2009 | -8.3 | -22.5 | -6.6 |
Aug 2009 | -6.2 | -14.1 | -5.3 |
Sep 2009 | -5.6 | -16.7 | -4.4 |
Oct 2009 | -3.6 | -9.7 | -2.9 |
Nov 2009 | 0.4 | 0.7 | 0.3 |
Dec 2009 | 3.4 | 9.2 | 2.9 |
Jan 2010 | 3.5 | 4.4 | 3.3 |
Feb 2010 | 3.4 | 2.0 | 3.6 |
Mar 2010 | 4.9 | 7.7 | 4.6 |
Apr 2010 | 5.5 | 3.5 | 5.7 |
May 2010 | 5.6 | 1.5 | 5.8 |
Jun 2010 | 3.7 | -2.6 | 4.4 |
Jul 2010 | 3.9 | 2.3 | 4.1 |
Aug 2010 | 4.1 | 6.4 | 3.9 |
Sep 2010 | 4.9 | 12.2 | 4.3 |
Oct 2010 | 5.8 | 16.2 | 4.8 |
Nov 2010 | 6.5 | 20.3 | 5.1 |
Dec 2010 | 6.5 | 20.5 | 5.1 |
Jan 2011 | 7.0 | 22.7 | 5.4 |
Feb 2011 | 8.7 | 33.6 | 6.3 |
Mar 2011 | 9.5 | 34.0 | 7.1 |
Apr 2011 | 9.2 | 33.9 | 6.8 |
May 2011 | 9.1 | 30.4 | 7.0 |
Jun 2011 | 10.1 | 31.4 | 8.0 |
Jul 2011 | 9.8 | 26.4 | 8.2 |
Aug 2011 | 9.4 | 23.2 | 8.0 |
Sep 2011 | 9.4 | 22.7 | 7.9 |
Oct 2011 | 6.3 | 11.5 | 5.8 |
Nov 2011 | 4.8 | 5.4 | 4.8 |
Dec 2011 | 3.6 | 1.0 | 4.0 |
Jan 2012 | 2.6 | -0.9 | 3.2 |
Feb 2012 | 1.8 | -5.7 | 2.8 |
Mar 2012 | 1.1 | -5.4 | 1.9 |
Apr 2012 | 0.7 | -3.1 | 1.2 |
May 2012 | -0.2 | -1.6 | 0.0 |
Jun 2012 | -2.1 | -5.8 | -1.6 |
Jul 2012 | -1.3 | 3.9 | -1.9 |
Aug 2012 | -0.9 | 7.1 | -1.9 |
Sep 2012 | -0.6 | 6.4 | -1.5 |
Oct 2012 | 1.5 | 11.9 | 0.2 |
Nov 2012 | 0.8 | 10.6 | -0.3 |
Dec 2012 | 1.1 | 13.4 | -0.3 |
Jan 2013 | 1.2 | 10.8 | 0.0 |
Feb 2013 | 1.5 | 13.6 | 0.0 |
Mar 2013 | 0.3 | 8.8 | -0.7 |
Prices for agricultural exports rose 8.8 percent over the past year, led by higher prices for soybeans, nuts, corn, vegetables, and wheat. The price index for nonagricultural exports decreased 0.7 percent for the year ended in March.
These data are from the BLS International Price program. To learn more, see "U.S. Import and Export Price Indexes — March 2013" (HTML) (PDF), news release USDL‑13‑0628.
Bureau of Labor Statistics, U.S. Department of Labor, The Economics Daily, U.S. import prices down over the year ending March 2013; export prices up slightly at https://www.bls.gov/opub/ted/2013/ted_20130412.htm (visited February 11, 2026).

