An official website of the United States government
 United States Department of Labor
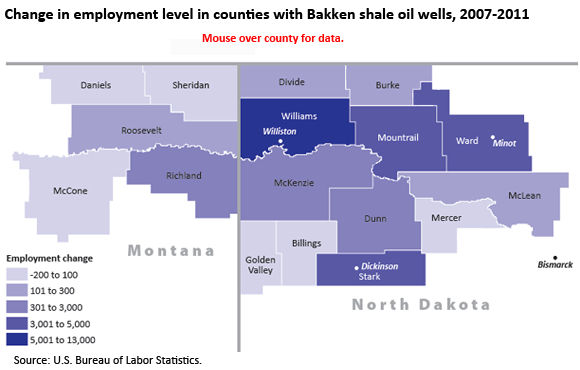
The Bakken Formation is an oil-producing shale formation underneath North Dakota, Montana, and parts of Canada. From 2007 to 2011, among U.S. counties within this region, employment grew from 77,937 jobs to 105,891 jobs—an increase of 35.9 percent.

| County | Net change in employment | Percent change in employment |
|---|---|---|
Montana | ||
Daniels County | -18 | -3.0 |
McCone County | 24 | 4.4 |
Richland County | 882 | 18.1 |
Roosevelt County | 258 | 7.6 |
Sheridan County | 78 | 6.3 |
North Dakota | ||
Billings County | 91 | 22.5 |
Burke County | 219 | 37.2 |
Divide County | 189 | 30.9 |
Dunn County | 964 | 113.1 |
Golden Valley County | 18 | 2.8 |
McKenzie County | 2,155 | 76.0 |
McLean County | 285 | 9.3 |
Mercer County | -116 | -2.5 |
Mountrail County | 3,039 | 137.1 |
Stark County | 4,117 | 33.7 |
Ward County | 3208 | 11.5 |
Williams County | 12,561 | 112.1 |
From 2007 to 2011, in counties with wells in the Bakken Formation, 38.1 percent of job growth was in mining, quarrying, and oil and gas extraction. Transportation and warehousing accounted for 17.5 percent of the growth, and construction accounted for another 12.9 percent. Altogether, these three industry sectors accounted for 68.5 percent of employment growth.
Among counties in the Bakken formation, the county with the largest employment growth was Williams County, North Dakota, where employment increased by 12,561 workers from 2007 to 2011. This increase more than doubled employment in the county. Almost half of this increase was in mining, quarrying, and oil and gas extraction. Other counties with employment increases of greater than 1,000 workers were McKenzie, Mountrail, Stark, and Ward, all in North Dakota. Ward County, North Dakota, with more than 31,000 jobs in 2011, had the highest overall number of jobs of any county in the Bakken Formation. Employment increased by 3,208 jobs from 2007 to 2011, with most of the increase spread across mining, quarrying, and oil and gas extraction; construction; transportation and warehousing; and leisure and hospitality. McKenzie, Mountrail, and Stark counties all had the highest level of job growth in mining, quarrying, and oil and gas extraction. Among the counties studied in Montana, Richland had the largest employment growth, with an increase of 882 jobs from 2007 to 2011.
These data are from Quarterly Census of Employment and Wages program. Employment totals for each county include employment for federal, state, and local government. Some industry totals were suppressed for confidentiality reasons, but 88.1 percent of the 2007 employment and 88.4 percent of the 2011 employment were available for analysis at the ownership and industry levels included in the study. To learn more, see “Employment and wage changes in oil-producing counties in the Bakken Formation, 2007–2011” (HTML) (PDF), by Paul Ferree and Peter W. Smith, Beyond the Numbers, April 2013.
Bureau of Labor Statistics, U.S. Department of Labor, The Economics Daily, Employment growth in oil-producing counties in the Bakken Formation, 2007–2011 at https://www.bls.gov/opub/ted/2013/ted_20130429.htm (visited February 21, 2026).

