An official website of the United States government
 United States Department of Labor
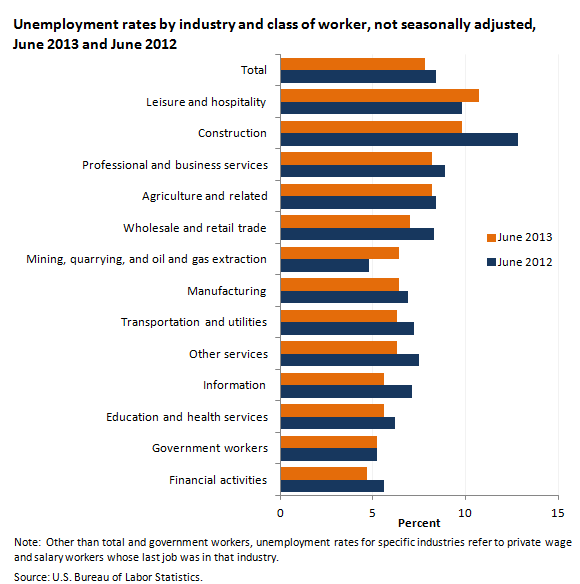
In June 2013, leisure and hospitality had the highest unemployment rate among the major industries at 10.7 percent (not seasonally adjusted). The unemployment rate for the nation was 7.8 percent (not seasonally adjusted), down from 8.4 percent a year earlier.

| Industry | Unemployment rate | |
|---|---|---|
| June 2013 | June 2012 | |
Total | 7.8 | 8.4 |
Leisure and hospitality | 10.7 | 9.8 |
Construction | 9.8 | 12.8 |
Professional and business services | 8.2 | 8.9 |
Agriculture and related | 8.2 | 8.4 |
Wholesale and retail trade | 7.0 | 8.3 |
Mining, quarrying, and oil and gas extraction | 6.4 | 4.8 |
Manufacturing | 6.4 | 6.9 |
Transportation and utilities | 6.3 | 7.2 |
Other services | 6.3 | 7.5 |
Information | 5.6 | 7.1 |
Education and health services | 5.6 | 6.2 |
Government workers | 5.2 | 5.2 |
Financial activities | 4.7 | 5.6 |
Note: Other than total and government workers, unemployment rates for specific industries refer to private wage and salary workers whose last job was in that industry. | ||
The unemployment rates for construction (9.8 percent) and for wholesale and retail trade (7.0 percent) declined from June 2012 to June 2013. The rates for other major industries were little changed over the year. The unemployment rate for government workers was unchanged at 5.2 percent.
These data are from the Current Population Survey and are not seasonally adjusted. To learn more, see "The Employment Situation — June 2013," (HTML) (PDF) news release USDL‑13‑1284.
Bureau of Labor Statistics, U.S. Department of Labor, The Economics Daily, Leisure and hospitality has highest unemployment rate among major industries, June 2013 at https://www.bls.gov/opub/ted/2013/ted_20130709.htm (visited February 22, 2026).

