
An official website of the United States government
An official website of the United States government
The .gov means it's official.
Federal government websites often end in .gov or .mil. Before sharing sensitive information,
make sure you're on a federal government site.
The site is secure.
The
https:// ensures that you are connecting to the official website and that any
information you provide is encrypted and transmitted securely.
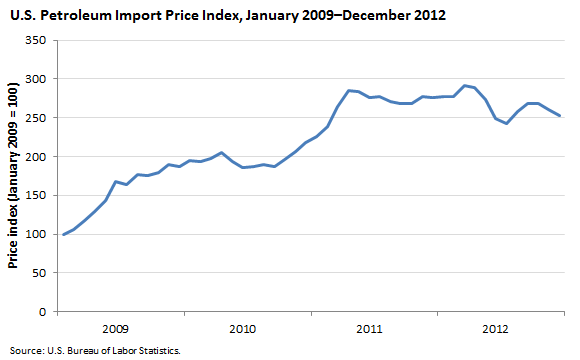
While the volume of petroleum imports to the United States started to decline as early as 2006 and domestic production began increasing in 2009, the price index for imported petroleum continued to rise until 2012.
| Month | Price index (January 2009 = 100) | Average annual index value (2009 = 100) |
|---|---|---|
Jan 2009 | 100.0 | 100.0 |
Feb 2009 | 105.4 | |
Mar 2009 | 117.2 | |
Apr 2009 | 129.0 | |
May 2009 | 143.3 | |
Jun 2009 | 167.9 | |
Jul 2009 | 164.0 | |
Aug 2009 | 176.4 | |
Sep 2009 | 175.4 | |
Oct 2009 | 179.6 | |
Nov 2009 | 189.3 | |
Dec 2009 | 187.3 | |
Jan 2010 | 194.4 | 128.4 |
Feb 2010 | 192.9 | |
Mar 2010 | 197.6 | |
Apr 2010 | 204.8 | |
May 2010 | 193.9 | |
Jun 2010 | 186.0 | |
Jul 2010 | 187.5 | |
Aug 2010 | 190.1 | |
Sep 2010 | 187.6 | |
Oct 2010 | 196.4 | |
Nov 2010 | 206.3 | |
Dec 2010 | 217.7 | |
Jan 2011 | 225.8 | 175.2 |
Feb 2011 | 238.2 | |
Mar 2011 | 264.4 | |
Apr 2011 | 285.6 | |
May 2011 | 283.4 | |
Jun 2011 | 276.6 | |
Jul 2011 | 277.6 | |
Aug 2011 | 271.2 | |
Sep 2011 | 268.8 | |
Oct 2011 | 268.1 | |
Nov 2011 | 277.3 | |
Dec 2011 | 276.6 | |
Jan 2012 | 276.7 | 174.7 |
Feb 2012 | 277.5 | |
Mar 2012 | 291.0 | |
Apr 2012 | 289.3 | |
May 2012 | 272.8 | |
Jun 2012 | 248.4 | |
Jul 2012 | 242.6 | |
Aug 2012 | 257.6 | |
Sep 2012 | 268.1 | |
Oct 2012 | 267.9 | |
Nov 2012 | 260.1 | |
Dec 2012 | 252.5 |
Several factors helped keep import prices rising until 2012. Strong global demand, especially from Asia; lower production from several nations that are members of the Organization of the Petroleum Exporting Countries (OPEC); and global supply shocks all contributed to increasing prices. By 2012, the growth in production worldwide, coupled with steadying global demand, started to drive prices down.
In 2010, import prices for petroleum rose 28.4 percent over the 2009 figure, on the strength of robust global demand. Demand from Asia was particularly strong. Much of the increase in consumption came from China, which experienced record demand during the year.
The rise in import petroleum prices in 2011 (36.4 percent) was even more pronounced. Supply concerns resulting from political unrest in North Africa and strong worldwide demand contributed to the higher prices. The political unrest began with protests against the Egyptian government and continued with a civil war that broke out in neighboring Libya, producing uncertainty that contributed to a worldwide rise in petroleum prices. Strong demand from Asian countries continued in 2011.
After 2 consecutive years of sizable increases, import prices leveled off in 2012, falling 0.3 percent for the year.
These data are from the International Price program and are featured in the Beyond the Numbers article, "The reemergence of the United States as a global petroleum producer" (August 2013).
Bureau of Labor Statistics, U.S. Department of Labor, The Economics Daily, Petroleum import prices rise during 2009-2012, despite higher U.S. production and lower consumption at https://www.bls.gov/opub/ted/2013/ted_20130826.htm (visited July 27, 2026).
