An official website of the United States government
 United States Department of Labor

| Month | All items | Food | Energy | Medical care |
|---|---|---|---|---|
Jan 2008 | 4.3 | 4.9 | 19.6 | 4.9 |
Feb 2008 | 4.0 | 4.6 | 18.9 | 4.5 |
Mar 2008 | 4.0 | 4.5 | 17.0 | 4.6 |
Apr 2008 | 3.9 | 5.1 | 15.9 | 4.3 |
May 2008 | 4.2 | 5.1 | 17.4 | 4.1 |
Jun 2008 | 5.0 | 5.3 | 24.7 | 4.0 |
Jul 2008 | 5.6 | 6.0 | 29.3 | 3.5 |
Aug 2008 | 5.4 | 6.1 | 27.2 | 3.3 |
Sep 2008 | 4.9 | 6.2 | 23.1 | 3.2 |
Oct 2008 | 3.7 | 6.3 | 11.5 | 2.8 |
Nov 2008 | 1.1 | 6.0 | -13.3 | 2.7 |
Dec 2008 | 0.1 | 5.9 | -21.3 | 2.6 |
Jan 2009 | 0.0 | 5.3 | -20.4 | 2.6 |
Feb 2009 | 0.2 | 4.8 | -18.5 | 2.8 |
Mar 2009 | -0.4 | 4.4 | -23.0 | 2.8 |
Apr 2009 | -0.7 | 3.3 | -25.2 | 3.0 |
May 2009 | -1.3 | 2.7 | -27.3 | 3.2 |
Jun 2009 | -1.4 | 2.1 | -25.5 | 3.2 |
Jul 2009 | -2.1 | 0.9 | -28.1 | 3.2 |
Aug 2009 | -1.5 | 0.4 | -23.0 | 3.3 |
Sep 2009 | -1.3 | -0.2 | -21.6 | 3.5 |
Oct 2009 | -0.2 | -0.6 | -14.0 | 3.5 |
Nov 2009 | 1.8 | -0.7 | 7.4 | 3.5 |
Dec 2009 | 2.7 | -0.5 | 18.2 | 3.4 |
Jan 2010 | 2.6 | -0.4 | 19.1 | 3.5 |
Feb 2010 | 2.1 | -0.2 | 14.4 | 3.6 |
Mar 2010 | 2.3 | 0.2 | 18.3 | 3.7 |
Apr 2010 | 2.2 | 0.5 | 18.5 | 3.6 |
May 2010 | 2.0 | 0.7 | 14.7 | 3.4 |
Jun 2010 | 1.1 | 0.7 | 3.0 | 3.5 |
Jul 2010 | 1.2 | 0.9 | 5.2 | 3.2 |
Aug 2010 | 1.1 | 1.0 | 3.8 | 3.2 |
Sep 2010 | 1.1 | 1.4 | 3.8 | 3.4 |
Oct 2010 | 1.2 | 1.4 | 5.9 | 3.4 |
Nov 2010 | 1.1 | 1.5 | 3.9 | 3.2 |
Dec 2010 | 1.5 | 1.5 | 7.7 | 3.3 |
Jan 2011 | 1.6 | 1.8 | 7.3 | 2.9 |
Feb 2011 | 2.1 | 2.3 | 11.0 | 2.9 |
Mar 2011 | 2.7 | 2.9 | 15.5 | 2.7 |
Apr 2011 | 3.2 | 3.2 | 19.0 | 2.9 |
May 2011 | 3.6 | 3.5 | 21.5 | 3.0 |
Jun 2011 | 3.6 | 3.7 | 20.1 | 2.9 |
Jul 2011 | 3.6 | 4.2 | 19.0 | 3.2 |
Aug 2011 | 3.8 | 4.6 | 18.4 | 3.2 |
Sep 2011 | 3.9 | 4.7 | 19.3 | 2.8 |
Oct 2011 | 3.5 | 4.7 | 14.2 | 3.1 |
Nov 2011 | 3.4 | 4.6 | 12.4 | 3.4 |
Dec 2011 | 3.0 | 4.7 | 6.6 | 3.5 |
Jan 2012 | 2.9 | 4.4 | 6.1 | 3.6 |
Feb 2012 | 2.9 | 3.9 | 7.0 | 3.4 |
Mar 2012 | 2.7 | 3.3 | 4.6 | 3.5 |
Apr 2012 | 2.3 | 3.1 | 0.9 | 3.4 |
May 2012 | 1.7 | 2.8 | -3.9 | 3.6 |
Jun 2012 | 1.7 | 2.7 | -3.9 | 4.0 |
Jul 2012 | 1.4 | 2.3 | -5.0 | 4.1 |
Aug 2012 | 1.7 | 2.0 | -0.6 | 4.1 |
Sep 2012 | 2.0 | 1.6 | 2.3 | 4.1 |
Oct 2012 | 2.2 | 1.7 | 4.0 | 3.7 |
Nov 2012 | 1.8 | 1.8 | 0.3 | 3.4 |
Dec 2012 | 1.7 | 1.8 | 0.5 | 3.2 |
Jan 2013 | 1.6 | 1.6 | -1.0 | 3.1 |
Feb 2013 | 2.0 | 1.6 | 2.3 | 3.1 |
Mar 2013 | 1.5 | 1.5 | -1.6 | 3.1 |
Apr 2013 | 1.1 | 1.5 | -4.3 | 2.7 |
May 2013 | 1.4 | 1.4 | -1.0 | 2.2 |
Jun 2013 | 1.8 | 1.4 | 3.2 | 2.1 |
Jul 2013 | 2.0 | 1.4 | 4.7 | 1.9 |
Aug 2013 | 1.5 | 1.4 | -0.1 | 2.3 |
Sep 2013 | 1.2 | 1.4 | -3.1 | 2.4 |
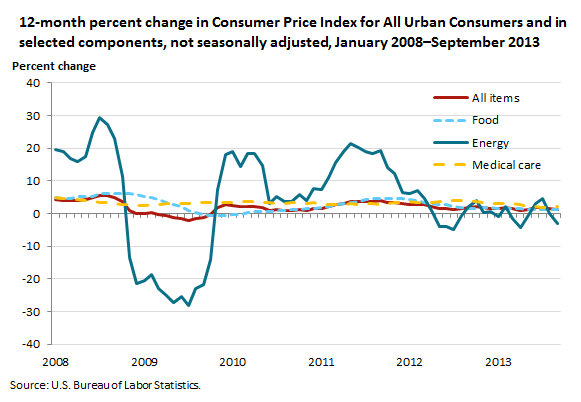
The energy index has declined 3.1 percent over the past 12 months, with the gasoline index declining 7.5 percent but the electricity and natural gas indexes both increasing.
The food index increased 1.4 percent from September 2012 to September 2013. The food at home index increased 1.0 percent. The index for food away from home rose 0.1 percent in September, its smallest increase since February, and has risen 1.9 percent over the past 12 months.
The index for medical care rose 2.4 percent over from September 2012 to September 2013, with the medical care services index rising 3.1 percent and the medical care commodities index rising .2 percent over that span.
These data are from the BLS Consumer Price Index program and are not seasonally adjusted. To learn more, see "Consumer Price Index — September 2013" (HTML) (PDF), news release USDL‑13‑2076.
Bureau of Labor Statistics, U.S. Department of Labor, The Economics Daily, Consumer prices up 1.2 percent over the year ended September 2013 at https://www.bls.gov/opub/ted/2013/ted_20131031.htm (visited February 11, 2026).

