An official website of the United States government
 United States Department of Labor
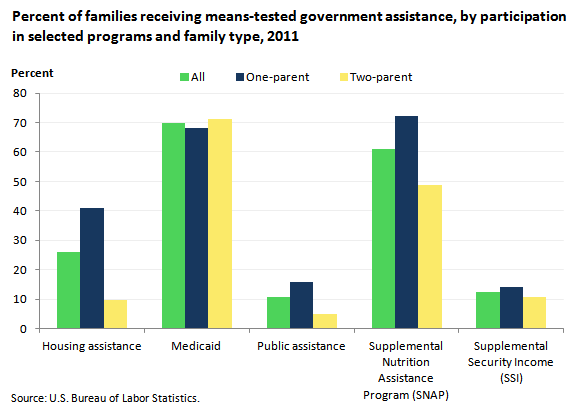
In 2011, there were 27.1 million families in the United States with at least one child under 18 years old. About 24 percent of families with children under 18 received government means-tested assistance benefits. Among families receiving assistance, 51.6 percent were one-parent families, and 48.4 percent were two-parent families. Among families receiving government means-tested assistance, Medicaid was the program with the highest participation rate (69.7 percent).

| Program | All | One-parent | Two-parent |
|---|---|---|---|
Housing assistance | 25.9 | 41.1 | 9.6 |
Medicaid | 69.7 | 68.2 | 71.3 |
Public assistance | 10.7 | 15.7 | 5.1 |
Supplemental Nutrition Assistance Program (SNAP) | 60.9 | 72.2 | 48.9 |
Supplemental Security Income (SSI) | 12.5 | 14.2 | 10.7 |
Supplemental Nutrition Assistance Program (SNAP) benefits were reported by 60.9 percent of families receiving assistance. A greater proportion of one-parent families received SNAP benefits (72.2 percent, compared with 48.9 percent of two-parent families). Nearly 26 percent of families received housing assistance; one-parent families had a participation rate of 41 percent, compared with almost 10 percent for two-parent families. A small proportion (12.5 percent) of families received Supplemental Security Income benefits.
Public assistance had the lowest participation rate (10.7 percent). Participation, however, was 15.7 percent for one-parent families, compared with 5.1 percent for two-parent families.
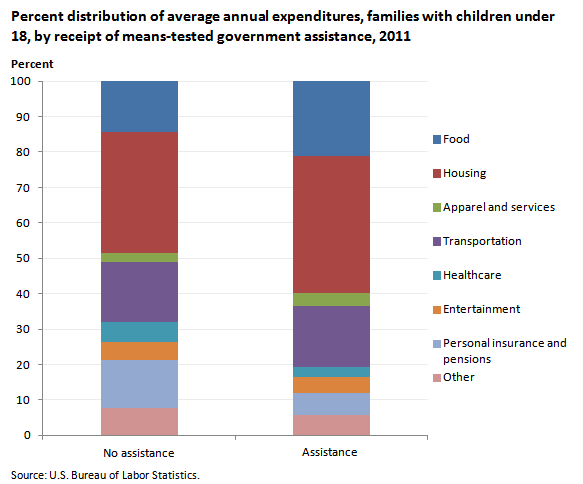
In 2011, total expenditures were more than twice as high for families not receiving assistance, $66,525, compared with $30,582 for families receiving assistance. For families receiving assistance, food, housing, and transportation accounted for 77.0 percent of the family budget, compared with 65.5 percent of the budget of families not receiving assistance.

| Item | Families receiving | |||
|---|---|---|---|---|
| No assistance | Assistance | |||
| Percent | Dollars | Percent | Dollars | |
Total expenditures | 100.0 | $66,525 | 100.0 | $30,582 |
Food | 14.3 | 9,539 | 21.1 | 6,460 |
Housing | 34.3 | 22,833 | 38.7 | 11,835 |
Apparel and services | 2.4 | 1,628 | 3.7 | 1,123 |
Transportation | 16.9 | 11,249 | 17.2 | 5,271 |
Healthcare | 5.5 | 3,687 | 2.9 | 876 |
Entertainment | 5.1 | 3,423 | 4.4 | 1,347 |
Personal insurance and pensions | 13.7 | 9,116 | 6.2 | 1,890 |
Other | 7.6 | 5,048 | 5.8 | 1,780 |
Housing expenditures represented a smaller share of total expenditures among families not receiving assistance (34.3 percent, compared with 38.7 percent for families receiving assistance). Food expenditures were higher among families not receiving assistance, but accounted for a lower share of total expenditures than among families receiving assistance (14.3 percent and 21.1 percent, respectively).
Healthcare spending was highest in dollar amount and as a percentage of the family budget among families receiving no assistance (5.5 percent, compared with 2.9 percent families receiving assistance). One reason is that 70 percent of families receiving assistance had Medicaid coverage.
These data are from the Consumer Expenditure Survey program. For more information, see the Beyond the Numbers article, "Spending patterns of families receiving means‑tested government assistance," by Ann C. Foster and William R. Hawk, December 2013.
Bureau of Labor Statistics, U.S. Department of Labor, The Economics Daily, Government means-tested assistance among families with children under 18 in 2011 at https://www.bls.gov/opub/ted/2014/ted_20140102.htm (visited February 22, 2026).

