An official website of the United States government
 United States Department of Labor
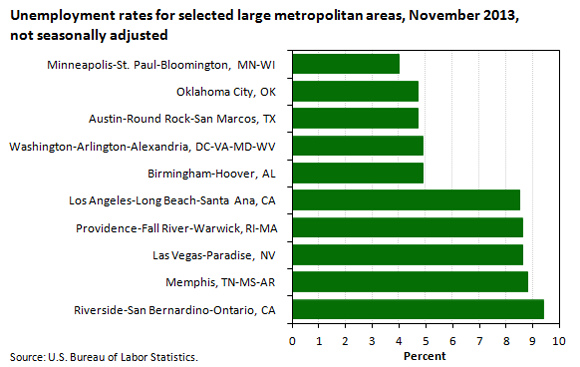
Among the 49 metropolitan areas with a Census 2000 population of 1 million or more, Riverside-San Bernardino-Ontario, California, had the highest unemployment rate in November 2013, at 9.4 percent. Minneapolis-St. Paul-Bloomington, Minnesota-Wisconsin, had the lowest rate among the large areas, at 4.0 percent.

| Metropolitan area | Percent |
|---|---|
Minneapolis-St. Paul-Bloomington, MN-WI | 4.0 |
Oklahoma City, OK | 4.7 |
Austin-Round Rock-San Marcos, TX | 4.7 |
Washington-Arlington-Alexandria, DC-VA-MD-WV | 4.9 |
Birmingham-Hoover, AL | 4.9 |
Los Angeles-Long Beach-Santa Ana, CA | 8.5 |
Providence-Fall River-Warwick, RI-MA | 8.6 |
Las Vegas-Paradise, NV | 8.6 |
Memphis, TN-MS-AR | 8.8 |
Riverside-San Bernardino-Ontario, CA | 9.4 |
From November 2013 to November 2014, the unemployment rate declined in 40 large metropolitan areas, increased in 7 areas, and was unchanged in 2 areas. The largest rate decline occurred in Charlotte-Gastonia-Rock Hill, North Carolina-South Carolina (–2.1 percentage points). Columbus, Ohio, had the largest jobless rate increase over the year (+0.8 percentage point).
Unemployment rates were lower in November than a year earlier in 293 of the 372 metropolitan areas, higher in 71 areas, and unchanged in 8 areas. Twenty-one areas had jobless rates of at least 10.0 percent, and 73 areas had rates of less than 5.0 percent.
These metropolitan area data are from the Local Area Unemployment Statistics program and are not seasonally adjusted. Data for the most recent month are preliminary. To learn more, see “Metropolitan Area Employment and Unemployment — November 2013” (HTML) (PDF), news release USDL‑14‑0001.
Bureau of Labor Statistics, U.S. Department of Labor, The Economics Daily, Metropolitan area unemployment in November 2013 at https://www.bls.gov/opub/ted/2014/ted_20140109.htm (visited February 17, 2026).

