An official website of the United States government
 United States Department of Labor
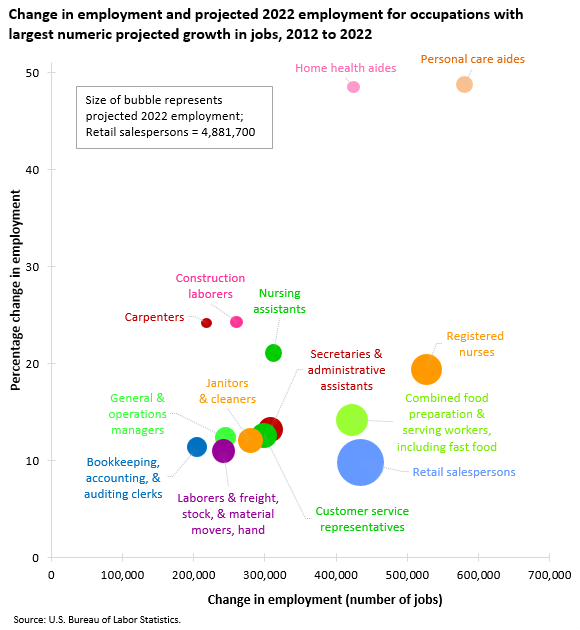
The 30 occupations that are projected to add the most new jobs by 2022 are expected to account for almost half of all new jobs. Over the 2012 to 2022 period, personal care aides is projected to add 580,800 new jobs, more than any other occupation, corresponding to a growth rate of 48.8 percent.

| Occupation | Projected change, 2012–2022 | Projected employment in 2022 | |
|---|---|---|---|
| Employment (number of jobs) | Percent change | ||
Total, all occupations(1) | 15,628,000 | 10.80% | 160,983,700 |
Personal care aides | 580,800 | 48.8 | 1,771,400 |
Registered nurses | 526,800 | 19.4 | 3,238,400 |
Retail salespersons | 434,700 | 9.8 | 4,881,700 |
Home health aides | 424,200 | 48.5 | 1,299,300 |
Combined food preparation and serving workers, including fast food | 421,900 | 14.2 | 3,391,200 |
Nursing assistants | 312,200 | 21.1 | 1,792,000 |
Secretaries and administrative assistants, except legal, medical, and executive | 307,800 | 13.2 | 2,632,300 |
Customer service representatives | 298,700 | 12.6 | 2,661,400 |
Janitors and cleaners, except maids and housekeeping cleaners | 280,000 | 12.1 | 2,604,000 |
Construction laborers | 259,800 | 24.3 | 1,331,000 |
General and operations managers | 244,100 | 12.4 | 2,216,800 |
Laborers and freight, stock, and material movers, hand | 241,900 | 11.0 | 2,439,200 |
Carpenters | 218,200 | 24.2 | 1,119,400 |
Bookkeeping, accounting, and auditing clerks | 204,600 | 11.4 | 2,004,500 |
Heavy and tractor-trailer truck drivers | 192,600 | 11.3 | 1,894,100 |
Medical secretaries | 189,200 | 36.0 | 714,900 |
Childcare workers | 184,100 | 14.0 | 1,496,800 |
Office clerks, general | 184,100 | 6.2 | 3,167,600 |
Maids and housekeeping cleaners | 183,400 | 12.8 | 1,618,000 |
Licensed practical and licensed vocational nurses | 182,900 | 24.8 | 921,300 |
First-line supervisors of office and administrative support workers | 171,500 | 12.1 | 1,589,600 |
Elementary school teachers, except special education | 167,900 | 12.3 | 1,529,100 |
Accountants and auditors | 166,700 | 13.1 | 1,442,200 |
Medical assistants | 162,900 | 29.0 | 723,700 |
Cooks, restaurant | 150,100 | 14.7 | 1,174,200 |
Software developers, applications | 139,900 | 22.8 | 752,900 |
Landscaping and groundskeeping workers | 139,200 | 12.4 | 1,264,000 |
Receptionists and information clerks | 135,900 | 13.5 | 1,142,600 |
Management analysts | 133,800 | 18.6 | 852,500 |
Sales representatives, wholesale and manufacturing, except technical and scientific products | 132,000 | 8.9 | 1,612,800 |
| Footnotes:
(1) Total includes occupations not shown.
| |||
Of the 30 occupations projected to experience the largest employment increases, 5 are in healthcare. Combined, these 5 occupations are projected to add 1.6 million jobs over the 2012–2022 decade. The number of registered nurses is projected to grow by 526,800 (or 19.4 percent), while the number of home health aides is expected to increase by 424,200 (48.5 percent).
The 7 office and administrative support occupations listed in the table of 30 occupations projected to experience the largest employment increases are projected to account for 1.5 million new jobs. This large numeric growth reflects the large size of most of these occupations. The number of secretaries and administrative assistants, except legal, medical, and executive is expected to grow from 2,324,400 to 2,632,300 over the 2012–2022 period, an increase of 307,800 (or 13.2 percent).
Two-thirds of the occupations projected to add the most new jobs typically require a high school diploma or less, while only five typically require a bachelor’s degree.
These data are from the BLS Employment Projections program. For more information, see the Monthly Labor Review article, "Occupational employment projections to 2022," by Emily Richards and Dave Terkanian, December 2013. Additional information about these and many other occupations may be found in the Occupational Outlook Handbook. Note that the chart does not show all 30 of the occupations projected to add the most new jobs by 2022. However, all 30 are listed on the accompanying table.
Bureau of Labor Statistics, U.S. Department of Labor, The Economics Daily, Occupations projected to add most new jobs, 2012 to 2022 at https://www.bls.gov/opub/ted/2014/ted_20140127.htm (visited January 01, 2026).

