An official website of the United States government
 United States Department of Labor
From 2007 to 2012, total annual average employment in all U.S. industries decreased by 3.7 million, to 131.7 million (a decrease of

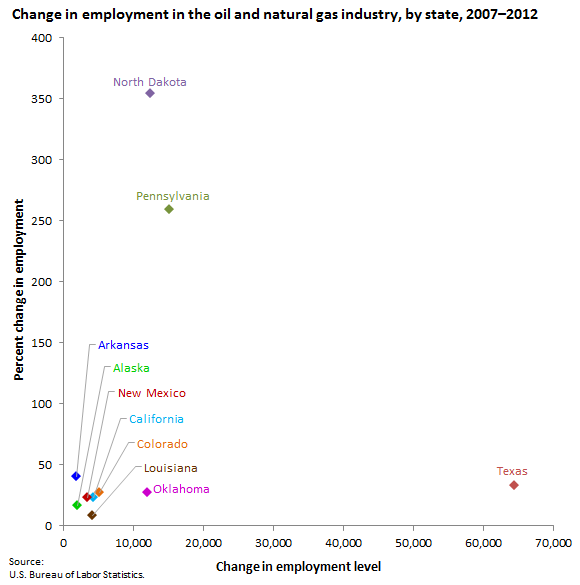
| State | Change in employment level | Percent change in employment |
|---|---|---|
Texas | 64,515 | 33.1 |
Pennsylvania | 15,114 | 259.3 |
North Dakota | 12,477 | 354.3 |
Oklahoma | 12,035 | 27.3 |
Colorado | 5,135 | 27.2 |
California | 4,230 | 23.0 |
Louisiana | 4,071 | 8.7 |
New Mexico | 3,467 | 23.0 |
Alaska | 1,990 | 17.1 |
Arkansas | 1,897 | 40.5 |
NOTE: North Dakota's 2012 over-the-period increases in employment may be understated because they are calculated on the basis of an incomplete sum for 2012. Data for the drilling oil and gas well industry in North Dakota are not disclosable.
| ||
Texas, traditionally a major oil- and natural gas-producing state, recorded the largest increase in oil and natural gas employment over the 2007–2012 period—64,515 (an increase of 33.1 percent).
Pennsylvania had the second-largest employment gain, increasing by 15,114 (259.3 percent).
In North Dakota, employment in the oil and natural gas industry increased by 12,477, which was the largest percentage increase (354.3 percent).
These data are from the Quarterly Census of Employment and Wages program. To learn more, see "The Marcellus Shale gas boom in Pennsylvania: employment and wage trends," Monthly Labor Review, February 2014.
Bureau of Labor Statistics, U.S. Department of Labor, The Economics Daily, Employment changes in the oil and natural gas industry, by state at https://www.bls.gov/opub/ted/2014/ted_20140404.htm (visited February 21, 2026).

