An official website of the United States government
 United States Department of Labor
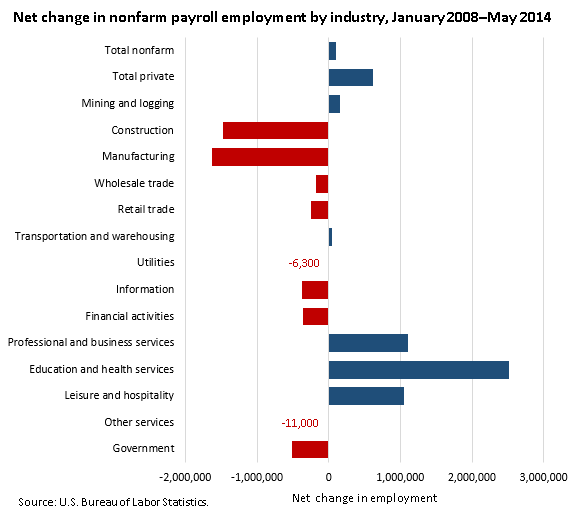
In May 2014, total nonfarm payroll employment rose by 217,000 to 1,384,630—exceeding its January 2008 peak. The economy had lost 8.7 million jobs between January 2008 and February 2010; since then, 8.8 million jobs have been added.

| Industry | Net change(p) |
|---|---|
Total nonfarm | 98,000 |
Total private | 617,000 |
Mining and logging | 160,000 |
Construction | -1,472,000 |
Manufacturing | -1,626,000 |
Wholesale trade | -172,000 |
Retail trade | -251,200 |
Transportation and warehousing | 48,200 |
Utilities | -6,300 |
Information | -371,000 |
Financial activities | -358,000 |
Professional and business services | 1,109,000 |
Education and health services | 2,520,000 |
Leisure and hospitality | 1,047,000 |
Other services | -11,000 |
Government | -519,000 |
Footnotes: | |
Since January 2008, nonfarm payroll employment has increased in industries such as education and health services (+2,520,000), professional and business services (+1,109,000) and leisure and hospitality (+1,047,000).
Industries with decreases in payroll employment from January 2008 to May 2014 include manufacturing (−1,626,000), construction (−1,472,000), government (−519,000) and retail trade (−251,200).
These data are from the Current Employment Statistics (CES) program and are seasonally adjusted. Data for the most recent 2 months are preliminary. To learn more, see "The Employment Situation — May 2014," (HTML) (PDF) news release USDL‑14‑0987. More charts featuring CES employment data can be found in Current Employment Statistics Highlights: May 2014.
Bureau of Labor Statistics, U.S. Department of Labor, The Economics Daily, Payroll employment highest since January 2008 at https://www.bls.gov/opub/ted/2014/ted_20140609.htm (visited February 18, 2026).

