
An official website of the United States government
An official website of the United States government
The .gov means it's official.
Federal government websites often end in .gov or .mil. Before sharing sensitive information,
make sure you're on a federal government site.
The site is secure.
The
https:// ensures that you are connecting to the official website and that any
information you provide is encrypted and transmitted securely.
The Occupational Requirements Survey (ORS) is an establishment survey conducted by the Bureau of Labor Statistics (BLS) for the Social Security Administration (SSA). The survey collects information on vocational preparation and the cognitive and physical requirements of occupations in the U.S. economy, as well as the environmental conditions in which those occupations are performed. Calibration training is a type of refresher training that compares interviewer performance against predetermined standards to assess rating accuracy, inter-rater reliability, and other measures of performance. This paper will review the results of three separate calibration training sessions that focused on a data collector’s ability to identify the presence or absence of physical demands and environmental conditions based on visual observation (assessed by watching job videos), assign Standard Occupational Classification (SOC) codes, and code Specific Vocational Preparation (SVP), which is a measure of the lapsed time required by a typical worker to reach average performance. Information obtained from these sessions was used to help evaluate training and mentoring programs, as well as to provide input into quality assurance procedures. However, the three calibration training sessions described in this paper generally showed minimal impact on performance measures used in the sessions.
Keywords: Calibration training, interviewer calibration, interviewer reliability, interviewer performance
In the summer of 2012, the Social Security Administration (SSA) and the Bureau of Labor Statistics (BLS) signed an interagency agreement, which has been updated annually, to begin the process of testing the collection of data on occupations. As a result, the Occupational Requirements Survey (ORS) was established as a test survey in late 2012. The goal of ORS is to collect and publish occupational information that will replace the outdated data currently used by SSA. More information on the background of ORS can be found in the next section. All ORS products will be made public for use by non-profits, employment agencies, state or federal agencies, the disability community, and other stakeholders.
An ORS interviewer attempts to collect close to 70 data elements related to the occupational requirements of a job. The following four groups of information will be collected:
Based on a series of field tests conducted in 2012 and 2013 to develop and test ORS procedures and data collection tools, survey managers decided to encourage the use of conversational interviewing to collect ORS data. Calibration training is conducted periodically after initial training and uses pre-defined standards to assess the performance of data collectors, called Field Economists. This paper will review results from three calibration sessions that were conducted to assess how well the data collectors had mastered key job skills important to successful interviewing.
In addition to providing Social Security benefits to retirees and survivors, the Social Security Administration (SSA) administers two large disability programs which provide benefit payments to millions of beneficiaries each year. Determinations for adult disability applicants are based on a five-step process that evaluates the capabilities of the worker, the requirements of their past work, and their ability to perform other work in the U.S. economy. In some cases, if an applicant is denied disability benefits, SSA policy requires adjudicators to document the decision by citing examples of jobs the claimant can still perform despite restrictions (such as limited ability to balance, stand, or carry objects) [1].
For over 50 years, the Social Security Administration has turned to the Department of Labor's Dictionary of Occupational Titles (DOT) as its primary source of occupational information to process the disability claims. SSA has incorporated many DOT conventions into their disability regulations. However, the DOT was last updated in its entirety in the late 1970’s, and a partial update was completed in 1991. Consequently, the SSA adjudicators who make the disability decisions must continue to refer to an increasingly outdated resource because it remains the most compatible with their statutory mandate and is the best source of data at this time.
When an applicant is denied SSA benefits, SSA must sometimes document the decision by citing examples of jobs that the claimant can still perform, despite their functional limitations. However, since the DOT has not been updated for so long, there are some jobs in the American economy that are not even represented in the DOT, and other jobs, in fact many often-cited jobs, no longer exist in large numbers in the American economy.
SSA has investigated numerous alternative data sources for the DOT such as adapting the Employment and Training Administration’s Occupational Information Network (O*NET), using the BLS Occupational Employment Statistics program (OES), and developing their own survey. But they were not successful with any of those potential data sources and turned to the National Compensation Survey program at the Bureau of Labor Statistics.
In an ideal world, if the data collection approach is sound and the training effective, it shouldn’t matter which interviewer collects the desired information. Rather, it should be possible to interchange interviewers and still obtain the same data. Calibration training sessions help determine how consistent, or interchangeable, data collectors, called Field Economists (FEs), are by assessing how well they meet pre-established standards of performance. Calibration training can be viewed as a type of refresher training; however, calibration sessions typically are focused on a specific skill; are limited in duration (generally three hours); involve some type of pre- vs post-assessment activity; measure performance quantitatively, whether using a test score or some measure of inter-rater reliability; and if deficiencies are apparent, they can quickly lead to changes in procedures, definitions, initial training, or quality control activities.
As noted previously, survey managers decided to encourage the use of conversational interviewing to collect the ORS data, although newly hired FEs were also given the option of using highly standardized, scripted data collection forms. There were several factors that influenced this decision, but an overriding reason was that NCS data collection already used conversational interviewing to address widely divergent levels of respondent knowledge and to collect the copious benefits and cost data required by the National Compensation Survey (some respondents are experts in the field of compensation, while others merely maintain pay and benefit records). Moreover, sample designs being considered for ORS included the use of NCS respondents in ORS (Ferguson et al., 2014). Therefore, managers believed that respondents and interviewers would have a difficult time adapting to different interviewing approaches and also expressed concerns about the impact on respondent cooperation in NCS after experiencing a lengthy ORS interview (field test interviews lasted about an hour on average).
Early field tests confirmed these fears when the FEs were required to use standardized interviewing scripts without any deviations following guidelines described in Fowler and Mangione (1990). Numerous respondent, FE, and observer debriefings consistently and clearly indicated that both respondents and FEs did not like this approach, finding it boring, repetitious, and tedious, with potentially negative effects on data quality and response.2 One of several criticisms of scripted interviewing made by Suchman and Jordan (1990) was that “the prohibition against redesign [of survey questions] leads to a depersonalization of the interview in ways that we believe detract from respondents’ sense of involvement with or responsibility for the interview process.” ORS FEs reported these types of negative respondent reactions in early field tests when the use of standardized questions was required. In addition, experienced FEs felt that scripted interviewing kept them from drawing on their existing knowledge of occupational data in the ORS interview.
Of special note, NCS is relatively unique among federal statistical surveys because Field Economists collect the data and a significant portion of data collection occurs face-to-face. Each FE must have a college diploma with a required number of economic or statistics courses, and is required to complete a rigorous training and certification program before being allowed to collect data independently (Ferguson, 2013).
Since the decision was made to encourage the use of conversational interviewing, an extensive training plan was put in place to bring FEs working on ORS up to the requisite skill level. In addition, an extensive amount of work went into developing and testing data collection forms that could be easily used in a conversational interview. Calibration sessions, or training sessions designed to assess and improve consistency in data collection, followed initial training at varying intervals and focused on specific skill areas. An internal team was responsible for reviewing results from the field tests and determining areas that would most benefit from calibration training. In the ORS field testing phase, four calibration training sessions were planned that covered the following topics:
Since the fourth session was not completed when this paper was prepared, only results from the first three calibration sessions are covered. Results from the fourth calibration session will be covered in a future paper.
For any type of data collection to be successful, interviewers must first be able to gain an acceptable level of cooperation and motivate respondents to provide quality data. In establishment surveys especially, respondents often cannot provide survey answers from memory alone, and must refer to records or other documents, or request information from others in the organization.
Calibration training is conducted at various time intervals after initial training. Its purpose is to focus on critical skill areas and to generate measures of reliability to determine how well key skills and knowledge have been mastered. To determine which content should be covered in calibration sessions, an internal team relied on the following sources:
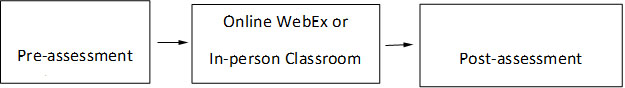
These sources identified skill areas that would benefit from additional, focused training. The design and length of a calibration training session can vary, but it often follows the sequence shown in Figure 1. Generally, there is a pre-assessment exercise that introduces a topic and obtains a measure of existing proficiency on a specific job skill before the calibration training session begins. The online or classroom calibration training covers specific training objectives and gives trainees ample opportunity to ask questions. Finally, a post-assessment exercise is used to assess the impact of the training intervention and to determine if areas of needed improvement remain. Sometimes the pre-assessment exercise might be the same, or very similar, to the post-course, and sometimes they differ. The decision depends on the training objectives and other factors (for example, the amount of time between the pre-assessment and post-assessment exercises, the cost of developing the evaluation exercises, etc.). Results from calibration training can be used to improve initial training, plan follow-up refresher training, revise quality control procedures, and make revisions to existing procedures. The total length of calibration sessions generally does not exceed three hours and most are generally conducted using WebEx, which enables inexpensive, remote training to be conducted.
Figure 1: Basic Model for Calibration Training
The objective of Calibration Session #1 was to determine if FEs had a clear understanding of the physical and environmental demands measured by ORS, so that they could convey this understanding to respondents and also apply this knowledge when the opportunity arose during job observations.
Three WebEx sessions3 were conducted with approximately 15 participants in each session (44 participants total in all sessions). Each online, WebEx session lasted about 1.5 hours and included Field Economists and both regional and national office participants. The pre-assessment assignment, which was generally completed within a week prior to the online session, required each participant to watch four videos of persons performing tasks in different occupations (identified as Videos 1-4), record the data elements they determined to be present, and then submit their answers online using a fillable pdf form. Each online, WebEx session was divided into three segments of approximately one-half hour in length (1.5 hours total). Correct answers for coding the videos were determined in advance by members of the calibration team. Participants’ answers were matched against the targeted/gold-standard answers to determine overall agreement, but inter-rater reliability statistics were also computed. Following is a brief summary of each of the three online classroom segments.
5.2.1 Segment 1 (first half hour) – The remaining videos (i.e., Videos 5-8) were shown during the classroom training using WebEx. As each video was shown, participants answered polling questions, which asked them to identify the data elements present in the video. Once all participants had submitted answers to the polling question, the results were immediately shared with the group, and a discussion followed that covered 1) why participants did or did not feel a data element was present, 2) verification of the targeted “answers,” and 3) the conceptual reasons for presence (or absence) of elements. This approach was repeated for each of the four videos.
5.2.2 Segment 2 (second half hour) – Participants left the WebEx session temporarily to complete a post-assessment assignment. This assignment entailed viewing Videos 1-4 again, identifying the data elements present, and submitting another set of answers. Participants who did not submit their answers prior to the WebEx resuming had to repeat the session at another time.
5.2.3 Segment 3 (final half hour) – Once all answers had been submitted by the participants, the team compared the pre and post answers and ran agreement statistics by data element. Adobe Acrobat Professional was used to capture the answers of all participants and to export them to Excel for almost immediate analysis. All data elements identified as present but with less than 100% agreement among participants were discussed in the WebEx session. This was followed by a discussion of the rationale for participant choices as well as the targeted answers. Screen shots from individual videos were used as necessary to illustrate the presence or absence of a data element. This sequence was repeated for each of the post-assessment videos. Once all sessions had been completed, the final answers were posted on a SharePoint site so that the participants could review them at their leisure.
Participants were sent an email with the links to the answer sheets, technical guidance materials (e.g., procedures manual, FE guide), and the videos. The videos, which lasted several minutes, showed four different workers (elementary teacher, general office clerk, heavy truck driver, and order filler) performing their jobs.
As noted, FEs were asked to observe the same four videos (Videos 1-4) and to identify the presence (or absence) of physical and environmental demands on two separate occasions. Although using the same videos for pre- and post-evaluation purposes is not an ideal approach, the team concluded that it was not feasible to use different videos because of the cost and time required to develop each video, as well as the difficulty of ensuring that the overall difficulty level of the occupations selected for pre and post assessment would be the same (any observed differences between pre and post measurements could be due to either the online WebEx training or to the selection of jobs/videos). To reduce possible carryover effects, the pre-assessment answers were not shared with the participants until after the training.
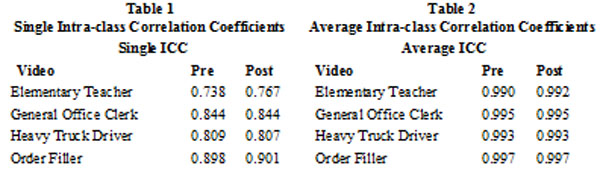
The simplest approach for assessing accuracy is to calculate the percent correct for the 33 individual elements (and overall) and compare these measures for the pre- and post-ratings. The overall percent agreement, averaged over 33 data elements and four jobs, was 91.6 percent correct in the pre-assessment activity and 92.3 percent correct in the post-assessment. Percent agreement was also calculated separately for the 33 elements, but due to space limitations is not reported in this paper. In the pre-assessment activity, the percent correct ranged from 52.8 percent to 100 percent over the 33 elements, and from 55.6 percent to 100 percent in the post-assessment. However, simple percent agreement can be misleading because it does not account for chance agreement. Therefore, to account for chance agreement, intra-class correlation coefficients were also computed, which will be discussed next. Intra-class correlation coefficients (ICC) provide an estimate of reliability in ratings across more than two raters (Wuensch, 2007), and were computed using pre- and post-WebEx ratings for Videos 1-4 (36 sets of complete ratings from 44 participants were used in these calculations). A two-way mixed effects model with measures of absolute agreement was used (Nichols, 1998). This model assumes that the analysis was run using all possible raters (i.e., Field Economists).
A measure of absolute agreement was used because we were interested in exploring systematic differences in rating levels (Nichols, 1998). ICCs were produced for both a single rater and multiple raters. The single ICC is used when in practice only one rater will collect data on a respondent, and the average ICC is used when in practice multiple raters will collect data on a respondent (Nichols, 1998; Wuensch, 2007). Therefore, for ORS data collection, the single ICC is the most appropriate measure of reliability.
The overall reliability of the ratings was good (> 0.75). Only one of the pre-WebEx videos (elementary teacher) generated ratings that were considered to have moderate agreement (0.50 to 0.75) (Wrobel, 2008). Except for one video (heavy truck driver video in the post-WebEx assessment, which dropped by 0.002), all of the intra-class correlation coefficients either increased or remained the same after the WebEx training. However, these differences were very small. Based on these results, it appears that inter-rater reliability is good whether we intend to use a single rater or a group of raters, that inter-rater reliability was relatively high to begin with and remained high, and that the online training session did not change the reliability of FE ratings.
Field Economists could identify the physical and environmental demands of jobs in videos with high accuracy and good reliability. However, the online training session did little to change the accuracy or reliability of these ratings.
This session required participants to apply their knowledge of the Standard Occupational Classification (SOC)4 guidelines and principles, with a special focus on occupational areas that had caused known coding problems in previous field tests. Participants were asked to use an O*NET online resource 5 to determine the correct eight-digit SOC code for eight job descriptions.
Calibration Session #2 consisted of three components: (1) a pre-assessment assignment, (2) a WebEx session, and a (3) post-assessment assignment. Each component required approximately one hour to complete. Three separate WebEx sessions were conducted, and each one included a mix of Field Economists, along with regional and national office participants. The total number of participants in each session ranged from 14 to 22 individuals (52 total), and participants were required to submit the pre-assessment assignment answers prior to the WebEx session (generally 1-2 weeks prior).
6.1.1 Pre-assessment Assignment - The pre-assessment assignment required each participant to do the following:
An attempt was made to balance the difficulty of the four occupations included in the pre-assessment assignment with the four occupations included in the post-assessment assignment. Members of the Calibration Team read all the job descriptions, assigned 8-digit SOC codes respectively, and used a consensus approach to rate the coding difficulty of each occupation.
6.1.2 WebEx Sessions - Each WebEx session was scheduled to last one hour, though the actual length varied based on the amount of discussion within a given session. The online sessions included review and discussion of the pre-assessment assignment. Throughout the sessions, graphs summarizing pre-assessment results were displayed to show the percentage of participants selecting the correct answer as well as the two most common incorrect answers selected by participants. Participants were then invited to explain why they chose the answer they did. The training facilitator then explained why and how the correct answer was selected and answered any subsequent questions from participants. WebEx polling questions were used to emphasize some of the basic SOC coding principles and guidelines covered in the pre-assessment assignment presentation. The polling questions were asked at breaks in the discussion of the four pre-assessment job descriptions with answers shared immediately.
6.1.3 Post-assessment Assignment - Participants were given a post-assessment assignment to complete after the WebEx session. This assignment mirrored the pre-assessment assignment; however, it used new job descriptions related to those in the pre-course. Participants were told to submit their answers within one hour or they would need to repeat the calibration. Everyone who participated followed this instruction.
For both the pre-assessment and post-assessment assignments, participants were sent an email with the job descriptions and answer sheets. The eight job descriptions were written using elements of real-world job descriptions and adapted in length and detail to meet session requirements. Links to the PowerPoint presentation and O*NET online were also sent with the pre-assessment assignment.
Coding performance was first assessed by viewing accuracy averaged across the occupations included in the pre- and post-session assessments (four occupations in each). Each item in the SOC hierarchy is designated by a six-digit code with an extra two digits added for a given occupation to allow users to determine which O*NET SOC occupations are the same as SOC occupations.
The hyphen between the second and third digit is used only for presentation clarity. The first two digits of the SOC code represent the major group; the third digit represents the minor group; the fourth and fifth digits represent the broad occupation; and the detailed occupation is represented by the sixth digit. The last two digits, the extensions “.01, .02, ... .50,” denote occupations derived from the O*NET system.
As noted, different occupations were used in the pre and post assessments. The first question of interest was “What was the average level of accuracy at the major occupation level (first 2 digits) and at the 8-digit level?” Results are shown in Figure 2. Percentages in Figure 2 are based on 54 participants in the pre-session assessment and 52 participants in the post-session.
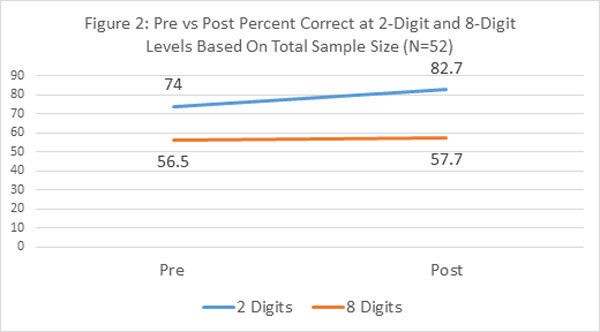
Accuracy at the major group level (first 2 digits) was 8.7 percent higher in the post-session assessment than in the pre-session assessment. Using a paired-sample t test, this change was statistically significant at a 95% confidence level (P = 0.017, t = -2.478, df=51, 2-tailed test). Accuracy at the 8-digit level was lower, with a difference of only 1.2 percent between the pre and post assessments.
An alternative way of assessing performance is to see how coding accuracy varied across different occupation levels (2-digits, 3-digits, 5-digits, 6-digits, 8-digits) given assignment of a correct code at the preceding level. These results are shown in Figure 3. When viewing Figure 3, it’s important to note that the percentages shown at each more detailed occupation level generally reflect ever decreasing sample sizes. For example, if 90.7% of 54 field economists correctly assigned the major occupation code at the 2-digit level, then the denominator for determining the percentage correct at the minor occupation level (3-digit) would be 49 (0.907 x 54= 49).
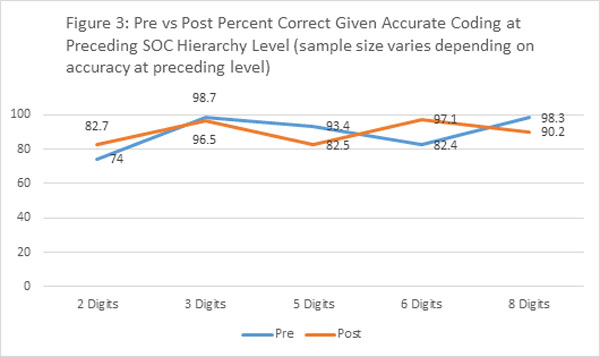
None of the coding level comparisons (3, 5, 6, 8 digits) were statistically significant, except for the difference at the 2-digit level, which was discussed previously.
Calibration Session #2 focused on unclear and confusing SOC definitions such as computer specialist occupations (i.e., tech jobs) that had caused coding difficulties in previous field testing. Despite additional training, which had a positive effect on the 2-digit classification of these troublesome occupational areas, performance remained lower than desired. Therefore, the team suggested revising initial training to emphasize conceptual issues and to ensure that review and quality assurance procedures were implemented to pay special attention to SOC coding.
The purpose of Calibration Session #3 was to improve the accuracy of coding specific vocational preparation (SVP). Specific Vocational Preparation is a component of worker characteristics information found in the Dictionary of Occupational Titles (U.S. Department of Labor, 1991). SVP is defined as the amount of lapsed time required by a typical worker to learn the techniques, acquire the information, and develop the facility needed for average performance in a specific job-worker situation.6
In O*NET, five job zone levels are used to categorize jobs according to complexity. These job zone levels range from Level 1 (jobs requiring little or no training) to Level 5 (jobs requiring higher education, training, and experience). Each job zone level is associated with an SVP range, as shown in the table below:
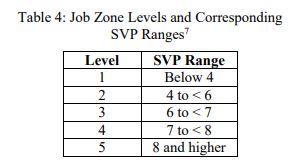
SVP has proven useful as a means of stratifying occupations in terms of their level of required vocational preparation. Obtaining SVP information using survey questions has proven challenging at times, and the questions and question order have undergone revisions in ORS field tests (Mockovak and Kaplan, 2015).
Unlike previous sessions, this calibration session was conducted in a classroom setting in conjunction with another training session. There were four parts to this calibration session: (1) an initial exercise, (2) in-class discussion, (3) a final exercise, and a (4) final discussion. This session required participants to code SVP based on written job descriptions. Field Economists were expected to obtain the following information from the written job descriptions:
1. What is the minimum education required? If no minimum, must workers be able to read and write?
2. Is prior work experience required? If so, how much?
3. What post-employment training is required (for example, OJT, mentoring, etc.)? How long does each type of training last?
4. Is a professional certification, state or industry license, or other training required before the worker would be hired? How long does it take to obtain each type of certification/license, training?
Gold standard answers were determined by calibration team members.
7.1.1 Initial Coding Exercise - Participants were given three job descriptions. Using the written descriptions and working by themselves, participants had 30 minutes to code the SVP level and components for each description.
7.1.2 In-class Discussion - After completing the pre-class exercise, participants were assigned to a small group. Each group was given 15 minutes to discuss members’ answers, and to come to a consensus on the correct SVP level and SVP components. After 15 minutes, the teams shared and discussed their answers with the trainers and the larger group.
During the classroom discussion, it was discovered that FEs were applying different definitions of what should be covered under post-employment training. This occurred because some of the FEs had participated in early field tests and definitions had changed without their knowledge. Unfortunately, a decision about which interpretation was correct could not be made until after the completion of training. Therefore, as a follow-up to this training, the definition for post-employment training was clarified and shared with all participants. In following analyses, it is referred to as the “old” and “new” definition.
7.1.3 Final Coding Exercise and Final Discussion - The process for the final exercise and the final discussion were the same as the process for the in-class discussion.
Table 5 shows how the accuracy of components of SVP level varied based on use of the old or new definitions of post-employment training for 21 FEs. SVP accuracy was consistently higher for the General Contractor occupations (Electrician and Plumber) and for the law firm associate (first year).
Focusing on the two teacher occupations and using the old definition, SVP level accuracy was high for the high school teacher and moderate for the elementary school teacher, but applying the new definition dropped accuracy to unacceptable levels for both occupations.
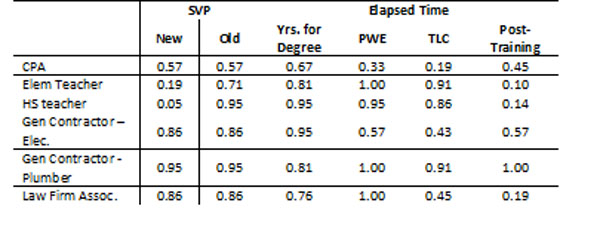
*Yrs. For Degree – Minimum education; PWE – Prior Work Experience; TLC – Training, License, and Certification; Post-training – Post-employment training.
The accuracy of elapsed times entered for each SVP component varied widely depending on the occupation. Looking at all components, SVP elapsed times were most accurately entered for the plumber, but each of the other occupations had components that were poorly estimated. Pre vs post estimates of reliability could not be computed for this session because, as mentioned previously, the classroom discussion led to a disagreement about the definition of post-employment training, and this issue was not resolved until after the training was completed, so the results are shown for both definitions.
SVP coding was made more difficult in this session because participants coded SVP from paper documents and weren’t able to ask probing questions of respondents as they would do in a realistic interviewing situation. However, the session revealed that confusion existed about which activities or training should count toward post-employment training (the definition had undergone revisions during sequential pretests). Therefore, as a followup to this training, the definition for post-employment training was clarified and shared with all participants.
To improve future training and Field Economist performance, it’s important to know where errors were made in entering the time estimate for each SVP component. The distributions of correct and incorrect answers for each SVP component for each occupation were generated, but in the interests of brevity are not shown or discussed in this report.
The results of calibration sessions described in this paper do not reflect the impact of quality assurance processes. We fully expect the various QA methods will lead to better coding in production. ORS will use the following quality assurance processes:
1. Each ORS Schedule is first reviewed by the Field Economist that collected it. Until FEs are certified, their completed schedules are also reviewed by a mentor.
2. Five percent of ORS schedules will be selected for reinterview, where the reviewer re-contacts the respondent.
3. Approximately 15% of ORS schedules (forms) will also undergo a full-schedule review.
4. Roughly 20% of ORS schedules will be selected for targeted review by a Data Analysis Team that targets a combination of certainty elements, and a random sampling of other elements, for independent verification.
5. All schedules go through a review where batch edits are run.
For more detail about the quality assurance process, see Harney and Brown (2015) and Meharenna (2015).
Several approaches, for example, reinterview, observation/monitoring, analysis of paradata, questionnaire/form reviews, can be used to monitor the quality of interviewing in an ongoing survey. This paper describes another option: the use of calibration training.
Field Economists who collect data for the National Compensation Survey (NCS) and the Occupational Requirements Survey (ORS) are hired with college degrees and trained to serve as professional interviewers in establishment surveys. They proceed through a demanding internal training program and receive extensive on-the-job training before being allowed to collect data independently. In addition to an extensive training program, the Field Economists work within a comprehensive quality assurance program to ensure that the highest possible data are collected. The calibration sessions described in this paper are an important part of that quality assessment and training process.
The three calibration training sessions described in this paper generally showed minimal impact on key performance measures used in the sessions. There are several possible reasons for the lack of impact of the calibration training. In the first calibration session (identifying the presence of physical demands and environmental conditions), performance was already at high, acceptable levels in the pre-assessment activity, and remained high during the post-assessment activity. The second calibration session focused on SOC coding of occupational areas that had caused conceptual problems in previous pretests, which may have led to the session being overly difficult. In the third calibration session, which was conducted in a classroom, the discussion of “gold standard” answers led to disagreement about a procedural definition of an element of SVP that had undergone revisions in previous pretesting. As a result, a final decision about the correct interpretation to use could not be made until after the completion of the calibration session, so participants’ pre- and post-assessment scores were scored using both definitions.
Another factor possibly limiting the impact of the calibration training sessions was that they were limited in length (1.5 hours maximum for the instructional portion, 3 hours or so overall), so the material covered, and the depth in which it was covered, may have been insufficient to impact performance. More difficult skills, such as those focused on in Calibration Session 2 (SOC coding), probably require more time and practice to master, along with coding a greater variety of occupations. The Calibration Team also discussed the possibility that a selection bias may have been present that inadvertently led to the assessment activities being overly difficult in Sessions 2 and 3. Another possibility is that although the team made an attempt to balance the difficulty of the pre- and post-assessment activities in Sessions 2 and 3, in reality, this was very difficult to do, especially with the small number of occupations involved. So a lack of significant improvement in performance measures may simply reflect a lack of equivalent difficulty of the pre- and post-measures (the pre- and post-assessment videos were identical in Session #1). This problem could have been partially addressed through the use of more occupational examples, but that would have led to increased training time and costs, which was not an option given budgetary constraints and competing demands for the FEs’ time, since calibration sessions took time away from actual data collection.
In addition, the first two sessions were presented using WebEx, which may not be as effective as classroom training. WebEx enables online, remote training, and helps to control training costs when dealing with a widely dispersed interviewing work force, which is the case in ORS. An attempt was made to make the WebEx sessions highly interactive through the use of polling questions and feeding back task results. However, the use of WebEx posed a variety of difficulties for some participants including poor audio quality, videos that froze during playback, and connectivity problems. These problems were noted and participants were encouraged to take corrective actions (for example, download videos to desktops for playback, rather than from a server), but these problems definitely degraded performance an unknown amount for some participants. Moreover, conducting almost any type of session using WebEx may negatively impact performance when compared to equivalent face-to-face training.
Even though the calibration training sessions failed to show much impact on interviewer performance, they still proved useful as a quick check on the quality of performance, and provided information that could be fed back into and addressed by the quality review process. The third session, in particular, identified conceptual issues that, to that point, had escaped the attention of the quality review process. As a direct result of the session, the problem was identified and immediately rectified.
As noted in the introduction, only the first three of four planned calibration sessions are described in this paper. The fourth session, observing and coding an actual conversational interview to determine the consistency of Field Economist coding, was in progress when this paper was prepared, and will be covered in a future paper.
The authors wish to thank Brandon Kopp for his careful review of early versions of this paper and members of the Calibration Team ― Michelle Green, Tamara Harney, Karl Hartmann, Renee Hersey, Steve Hill, Brian Kirby, Karen Litschgi, Lindsey Peterson, and Nancy Rowinski ― for their hard work in designing, developing, and running these calibration sessions.
Ferguson, G. 2013. Testing the Collection of Occupational Requirements Data. In JSM Proceedings, Government Statistics Section. Alexandria, VA: American Statistical Association. 2291-2305.
Ferguson, G., McNulty, E., and Ponikowski, C. 2014. Occupational Requirements Survey Sample Design Evaluation. In JSM Proceedings, Government Statistics Section. Alexandria, VA: American Statistical Association. 2924-2938.
Fowler, F.J. and Mangione, T.W. 1990. Standardized Survey Interviewing: Minimizing Interviewer-Related Error. Newbury Park, CA: Sage.
Harney, T. and Brown, K. 2015. Building Quality Assurance for the ORS. Proceedings of the 2015 Joint Statistical Meetings, Seattle, WA.
Meharenna, R. 2015. ORS Data Review Process. Proceedings of the 2015 Joint Statistical Meetings, Seattle, WA.
Mockovak, W. and Kaplan, R. 2015. Comparing Results from Telephone Reinterview with Unmoderated, Online Cognitive Interviewing. Proceedings of the American Association for Public Opinion Research Annual Conference.
Nichols, D. 1998. Choosing an intra-class correlation coefficient. Retrieved from UCLA Institute for Digital Research and Education Lecture Notes Online Web site: https://stats.oarc.ucla.edu/spss/library/spss-library-choosing-an-intraclass-correlation-coefficient/
Oswald, F., Campbell, J., McCloy, R., Rivkin, D., and Lewis, P. 1999. Stratifying Occupational Units by Specific Vocational Preparation (SVP). Active URL: http://www.onetcenter.org/dl_files/SVP.pdf
U.S. Department of Labor, Employment and Training Administration. 1991. Dictionary of Occupational Titles, Fourth Edition, Revised, 1991.
Wrobel, J. S., & Armstrong, D. G. 2008. Reliability and validity of current physical examination techniques of the foot and ankle. Journal of the American Podiatric Medical Association, 98(3), 197-206.
Wuensch, K. 2007. Inter-rater agreement [Word document]. Retrieved from East Carolina University, Department of Psychology Lecture Notes Online Web site: http://core.ecu.edu/psyc/wuenschk/docs30/InterRater.pdf
Any opinions expressed in this paper are those of the authors and do not constitute policy of the Bureau of Labor Statistics.