
An official website of the United States government
An official website of the United States government
The .gov means it's official.
Federal government websites often end in .gov or .mil. Before sharing sensitive information,
make sure you're on a federal government site.
The site is secure.
The
https:// ensures that you are connecting to the official website and that any
information you provide is encrypted and transmitted securely.
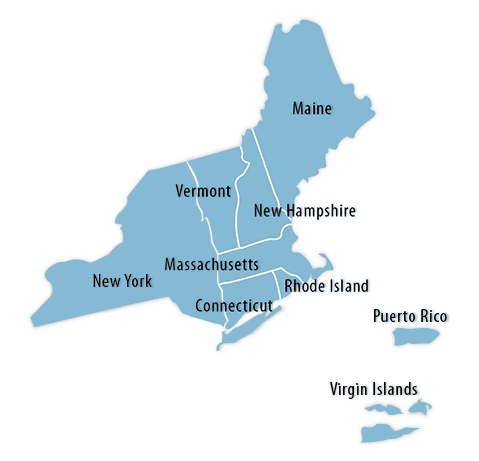
Click a state from the map or pick a state from the list:
Connecticut | Maine | Massachusetts | New Hampshire | New York | Puerto Rico | Rhode Island | Vermont | Virgin Islands
 Economic Summaries:
Economic Summaries are specialized products that combine data graphically from subjects such as unemployment, inflation, and wages into a single document for selected metropolitan areas. To view a specific area in this region, use the dropdown list below or click here.
From September 2025 to December 2025, gross job gains among private-sector establishments in Connecticut were 81,169, while gross job losses were 80,578.
From September 2025 to December 2025, gross job gains among private-sector establishments in Rhode Island were 28,673, while gross job losses were 26,739.
From September 2025 to December 2025, the U.S. Virgin Islands had 2,172 gross job gains and 1,727 gross job losses in the private sector.
The Consumer Price Index for All Urban Consumers (CPI-U) for New York-Newark-Jersey City decreased 0.2 percent from May to June.
The Consumer Price Index for All Urban Consumers (CPI-U) in the Northeast Region fell 0.2 percent in June.