An official website of the United States government
An official website of the United States government
The .gov means it's official.
Federal government websites often end in .gov or .mil. Before sharing sensitive information,
make sure you're on a federal government site.
The site is secure.
The
https:// ensures that you are connecting to the official website and that any
information you provide is encrypted and transmitted securely.
25-1215-ATL
Wednesday, July 30, 2025
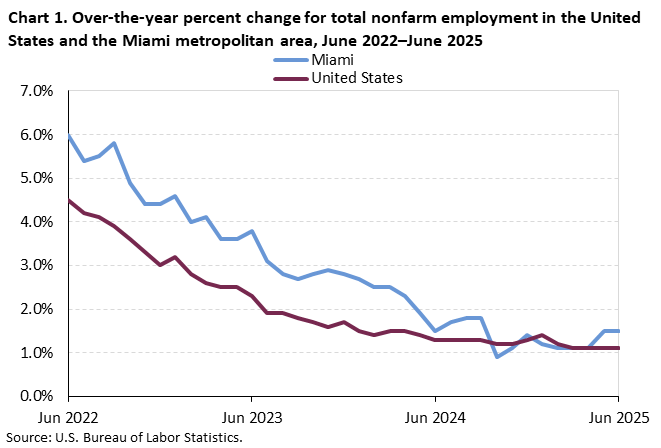
Total nonfarm employment for the Miami-Fort Lauderdale-West Palm Beach, FL, metropolitan area increased by 42,600 over the year in June, the U.S. Bureau of Labor Statistics reported today. Regional Commissioner Victoria G. Lee noted that the local rate of job gain, 1.5 percent, compared to the 1.1-percent national increase. (See chart 1 and table 1.) (All data in this release are not seasonally adjusted; accordingly, over-the-year analysis is used throughout.)
Miami-Fort Lauderdale-West Palm Beach, FL, is made up of three metropolitan divisions—separately identifiable employment centers within the greater metropolitan area. Miami-Miami Beach-Kendall, FL, accounted for 45 percent of the metropolitan area’s total nonfarm employment. Fort Lauderdale-Pompano Beach-Sunrise, FL, accounted for 31 percent of the area’s employment, and West Palm Beach-Boca Raton-Delray Beach, FL, accounted for 24 percent of area employment.
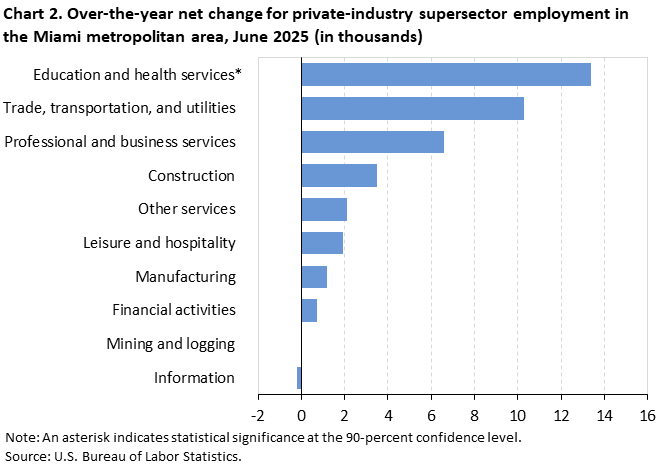
Industry employmentIn Miami-Fort Lauderdale-West Palm Beach, FL, education and health services had the only significant gain (+13,400) among the metropolitan area’s private-industry supersectors. (See chart 2.) The 2.9-percent increase in the metropolitan area’s education and health services supersector compared to the 3.3-percent gain on a national level.
Within the trade, transportation, and utilities supersector, retail trade added 6,300 jobs over the year in the metropolitan area.
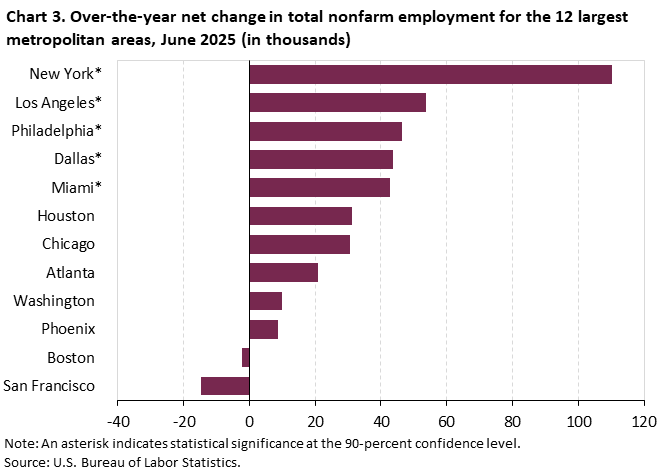
Miami-Fort Lauderdale-West Palm Beach, FL, was 1 of the nation’s 12 largest metropolitan statistical areas in June 2025. Five of twelve areas gained total nonfarm payroll employment over the year: New York-Newark-Jersey City, NY-NJ (+110,100), Los Angeles-Long Beach-Anaheim, CA (+53,600), Philadelphia-Camden-Wilmington, PA-NJ-DE-MD (+46,500), Dallas-Fort Worth-Arlington, TX (+43,600), and Miami-Fort Lauderdale-West Palm Beach, FL (+42,600). (See table 2 and chart 3.)
Miami-Fort Lauderdale-West Palm Beach, FL, and Philadelphia-Camden-Wilmington, PA-NJ-DE-MD, each had a 1.5-percent rate of job gain, followed by New York-Newark-Jersey City, NY-NJ (+1.1 percent), Dallas-Fort Worth-Arlington, TX (+1.0 percent), and Los Angeles-Long Beach-Anaheim, CA (+0.9 percent).
The Metropolitan Area Employment and Unemployment release for July 2025 is scheduled to be released on Wednesday, August 27, 2025, at 10:00 a.m. (ET).
Each year, Current Employment Statistics (CES) estimates are benchmarked to comprehensive counts of employment from the Quarterly Census of Employment and Wages (QCEW). These counts are derived from state unemployment insurance (UI) tax records that nearly all employers are required to file. As part of the benchmark process for benchmark year 2025, census-derived employment counts replace CES payroll employment estimates for all 50 states, the District of Columbia, Puerto Rico, the U.S. Virgin Islands, and about 430 metropolitan areas and divisions for the period from April 2024 to September 2025.
The Bureau of Labor Statistics (BLS) will release first-quarter 2025 data from the QCEW on September 9, 2025, at 10:00 a.m. (ET). At the same time, BLS will publish preliminary benchmark revisions for March 2025 for all 50 states, the District of Columbia, and selected metropolitan areas at the total nonfarm level. The final benchmark revisions for all state and metropolitan area series will be issued with the publication of the January 2026 State Employment and Unemployment news release in March 2026.
This release presents nonfarm payroll employment estimates from the CES program. More information about the CES data is available in the State Employment and Unemployment Summary and the Metropolitan Area Employment and Unemployment Summary. See the Metropolitan Area Employment and Unemployment Technical Note for more information on definitions and methodology.
Reliability of the employment estimates. The estimates presented in this release are based on sample surveys, administrative data, and modeling and, thus, are subject to sampling and other types of errors. Changes in metropolitan area nonfarm payroll employment are cited in the analysis of this release only if they have been determined to be statistically significant at the 90-percent confidence level. Documentation on the reliability of state and area estimates is available for metropolitan areas and metropolitan divisions.
Area definitions. The substate area data published in this news release reflect the U.S. Office of Management and Budget delineations issued on July 21, 2023. The 12 metropolitan areas discussed in this release are the metropolitan areas with the largest population according to the U.S. Census Bureau.
The Miami-Fort Lauderdale-West Palm Beach, FL Metropolitan Statistical Area includes Broward, Miami-Dade, and Palm Beach Counties.
Additional information
State and area employment data from the CES program are available on the BLS website.
Information in this release will be made available to individuals with sensory impairments upon request. Voice phone: (202) 691-5200; Telecommunications Relay Service: 7-1-1.
| Area and Industry | Jun 2024 |
Apr 2025 |
May 2025 |
Jun 2025(p) |
Jun 2024 to Jun 2025(p) |
|
|---|---|---|---|---|---|---|
| Net change |
Percent change |
|||||
|
Miami-Fort Lauderdale-West Palm Beach, FL Metropolitan Statistical Area |
||||||
|
Total nonfarm |
2,922.0 | 3,000.3 | 3,005.4 | 2,964.6 | 42.6 | 1.5 |
|
Mining and logging |
0.9 | 0.9 | 0.9 | 0.9 | 0.0 | 0.0 |
|
Construction |
158.3 | 160.6 | 161.4 | 161.8 | 3.5 | 2.2 |
|
Manufacturing |
101.6 | 102.4 | 102.7 | 102.8 | 1.2 | 1.2 |
|
Trade, transportation, and utilities |
651.4 | 664.9 | 663.9 | 661.7 | 10.3 | 1.6 |
|
Information |
54.4 | 53.8 | 53.9 | 54.2 | -0.2 | -0.4 |
|
Financial activities |
220.2 | 220.0 | 221.6 | 220.9 | 0.7 | 0.3 |
|
Professional and business services |
516.8 | 521.9 | 523.7 | 523.4 | 6.6 | 1.3 |
|
Education and health services |
456.5 | 475.9 | 476.0 | 469.9 | 13.4 | 2.9 |
|
Leisure and hospitality |
345.3 | 356.9 | 357.0 | 347.2 | 1.9 | 0.6 |
|
Other services |
117.8 | 119.4 | 120.3 | 119.9 | 2.1 | 1.8 |
|
Government |
298.8 | 323.6 | 324.0 | 301.9 | 3.1 | 1.0 |
|
Miami-Miami Beach-Kendall, FL Metropolitan Division |
||||||
|
Total nonfarm |
1,314.9 | 1,353.6 | 1,355.3 | 1,335.2 | 20.3 | 1.5 |
|
Mining and logging |
0.6 | 0.6 | 0.6 | 0.6 | 0.0 | 0.0 |
|
Construction |
58.6 | 62.4 | 63.2 | 63.4 | 4.8 | 8.2 |
|
Manufacturing |
47.4 | 47.4 | 47.6 | 47.5 | 0.1 | 0.2 |
|
Trade, transportation, and utilities |
322.2 | 330.8 | 329.9 | 328.5 | 6.3 | 2.0 |
|
Information |
22.9 | 22.7 | 22.8 | 22.9 | 0.0 | 0.0 |
|
Financial activities |
96.6 | 96.3 | 96.9 | 96.7 | 0.1 | 0.1 |
|
Professional and business services |
210.9 | 214.4 | 213.9 | 213.2 | 2.3 | 1.1 |
|
Education and health services |
218.7 | 227.2 | 228.0 | 224.3 | 5.6 | 2.6 |
|
Leisure and hospitality |
152.1 | 156.2 | 157.2 | 152.4 | 0.3 | 0.2 |
|
Other services |
49.7 | 50.3 | 50.5 | 50.3 | 0.6 | 1.2 |
|
Government |
135.2 | 145.3 | 144.7 | 135.4 | 0.2 | 0.1 |
|
Fort Lauderdale-Pompano Beach-Sunrise, FL Metropolitan Division |
||||||
|
Total nonfarm |
915.2 | 935.7 | 937.1 | 926.6 | 11.4 | 1.2 |
|
Construction |
55.2 | 53.9 | 53.8 | 54.1 | -1.1 | -2.0 |
|
Manufacturing |
31.8 | 32.1 | 32.2 | 32.3 | 0.5 | 1.6 |
|
Trade, transportation, and utilities |
202.8 | 206.2 | 206.0 | 205.4 | 2.6 | 1.3 |
|
Information |
20.1 | 19.6 | 19.6 | 19.7 | -0.4 | -2.0 |
|
Financial activities |
73.6 | 73.8 | 74.4 | 73.9 | 0.3 | 0.4 |
|
Professional and business services |
171.6 | 173.7 | 175.1 | 175.2 | 3.6 | 2.1 |
|
Education and health services |
121.2 | 124.4 | 123.7 | 121.8 | 0.6 | 0.5 |
|
Leisure and hospitality |
99.4 | 102.6 | 102.2 | 101.4 | 2.0 | 2.0 |
|
Other services |
37.0 | 37.9 | 38.5 | 38.3 | 1.3 | 3.5 |
|
Government |
102.4 | 111.4 | 111.5 | 104.4 | 2.0 | 2.0 |
|
West Palm Beach-Boca Raton-Delray Beach, FL Metropolitan Division |
||||||
|
Total nonfarm |
691.9 | 711.0 | 713.0 | 702.8 | 10.9 | 1.6 |
|
Construction |
44.5 | 44.3 | 44.4 | 44.3 | -0.2 | -0.4 |
|
Manufacturing |
22.4 | 22.9 | 22.9 | 23.0 | 0.6 | 2.7 |
|
Trade, transportation, and utilities |
126.4 | 127.9 | 128.0 | 127.8 | 1.4 | 1.1 |
|
Information |
11.4 | 11.5 | 11.5 | 11.6 | 0.2 | 1.8 |
|
Financial activities |
50.0 | 49.9 | 50.3 | 50.3 | 0.3 | 0.6 |
|
Professional and business services |
134.3 | 133.8 | 134.7 | 135.0 | 0.7 | 0.5 |
|
Education and health services |
116.6 | 124.3 | 124.3 | 123.8 | 7.2 | 6.2 |
|
Leisure and hospitality |
93.8 | 98.1 | 97.6 | 93.4 | -0.4 | -0.4 |
|
Other services |
31.1 | 31.2 | 31.3 | 31.3 | 0.2 | 0.6 |
|
Government |
61.2 | 66.9 | 67.8 | 62.1 | 0.9 | 1.5 |
| Area | Jun 2024 |
Apr 2025 |
May 2025 |
Jun 2025(p) |
Jun 2024 to Jun 2025(p) |
|
|---|---|---|---|---|---|---|
| Net change |
Percent change |
|||||
|
United States(1) |
||||||
|
Total nonfarm |
158,722 | 159,227 | 159,958 | 160,475 | 1,753 | 1.1 |
|
Mining and logging |
627 | 622 | 623 | 624 | -3 | -0.5 |
|
Construction |
8,378 | 8,214 | 8,352 | 8,492 | 114 | 1.4 |
|
Manufacturing |
12,908 | 12,717 | 12,738 | 12,816 | -92 | -0.7 |
|
Trade, transportation, and utilities |
28,914 | 28,848 | 28,949 | 29,079 | 165 | 0.6 |
|
Information |
2,967 | 2,920 | 2,934 | 2,961 | -6 | -0.2 |
|
Financial activities |
9,200 | 9,190 | 9,224 | 9,290 | 90 | 1.0 |
|
Professional and business services |
22,741 | 22,575 | 22,633 | 22,715 | -26 | -0.1 |
|
Education and health services |
26,265 | 27,333 | 27,289 | 27,131 | 866 | 3.3 |
|
Leisure and hospitality |
17,488 | 16,859 | 17,307 | 17,732 | 244 | 1.4 |
|
Other services |
6,049 | 6,021 | 6,063 | 6,107 | 58 | 1.0 |
|
Government |
23,185 | 23,928 | 23,846 | 23,528 | 343 | 1.5 |
|
Atlanta-Sandy Springs-Roswell, GA |
||||||
|
Total nonfarm |
3,115.2 | 3,109.1 | 3,117.0 | 3,136.2 | 21.0 | 0.7 |
|
Mining and logging |
2.1 | 2.1 | 2.1 | 2.1 | 0.0 | 0.0 |
|
Construction |
152.3 | 146.3 | 146.3 | 148.5 | -3.8 | -2.5 |
|
Manufacturing |
181.6 | 180.1 | 181.1 | 180.8 | -0.8 | -0.4 |
|
Trade, transportation, and utilities |
661.9 | 650.1 | 649.5 | 652.3 | -9.6 | -1.5 |
|
Information |
104.5 | 102.7 | 106.1 | 106.0 | 1.5 | 1.4 |
|
Financial activities |
209.5 | 208.9 | 208.8 | 210.3 | 0.8 | 0.4 |
|
Professional and business services |
572.0 | 569.5 | 568.2 | 574.4 | 2.4 | 0.4 |
|
Education and health services |
440.0 | 459.5 | 461.7 | 463.5 | 23.5 | 5.3 |
|
Leisure and hospitality |
326.0 | 313.9 | 318.7 | 326.4 | 0.4 | 0.1 |
|
Other services |
111.2 | 109.8 | 109.0 | 110.6 | -0.6 | -0.5 |
|
Government |
354.1 | 366.2 | 365.5 | 361.3 | 7.2 | 2.0 |
|
Boston-Cambridge-Newton, MA-NH |
||||||
|
Total nonfarm |
2,796.5 | 2,753.3 | 2,769.4 | 2,794.3 | -2.2 | -0.1 |
|
Mining, logging, and construction |
127.1 | 119.1 | 123.4 | 125.5 | -1.6 | -1.3 |
|
Manufacturing |
166.0 | 162.5 | 163.3 | 163.8 | -2.2 | -1.3 |
|
Trade, transportation, and utilities |
394.7 | 387.8 | 390.2 | 395.0 | 0.3 | 0.1 |
|
Information |
78.0 | 76.0 | 76.8 | 77.4 | -0.6 | -0.8 |
|
Financial activities |
180.3 | 179.5 | 180.0 | 182.5 | 2.2 | 1.2 |
|
Professional and business services |
528.3 | 519.0 | 515.9 | 522.3 | -6.0 | -1.1 |
|
Education and health services |
608.0 | 624.8 | 616.8 | 612.7 | 4.7 | 0.8 |
|
Leisure and hospitality |
292.8 | 262.1 | 278.2 | 291.7 | -1.1 | -0.4 |
|
Other services |
101.1 | 96.3 | 97.3 | 99.6 | -1.5 | -1.5 |
|
Government |
320.2 | 326.2 | 327.5 | 323.8 | 3.6 | 1.1 |
|
Chicago-Naperville-Elgin, IL-IN |
||||||
|
Total nonfarm |
4,773.5 | 4,706.3 | 4,754.2 | 4,804.1 | 30.6 | 0.6 |
|
Mining and logging |
1.7 | 1.7 | 1.7 | 1.7 | 0.0 | 0.0 |
|
Construction |
187.6 | 176.0 | 183.3 | 191.9 | 4.3 | 2.3 |
|
Manufacturing |
410.8 | 404.8 | 401.9 | 406.3 | -4.5 | -1.1 |
|
Trade, transportation, and utilities |
946.1 | 933.8 | 936.3 | 941.8 | -4.3 | -0.5 |
|
Information |
75.8 | 75.6 | 76.1 | 76.5 | 0.7 | 0.9 |
|
Financial activities |
316.0 | 313.3 | 314.8 | 319.2 | 3.2 | 1.0 |
|
Professional and business services |
823.0 | 795.4 | 806.6 | 817.6 | -5.4 | -0.7 |
|
Education and health services |
767.6 | 786.8 | 787.4 | 784.0 | 16.4 | 2.1 |
|
Leisure and hospitality |
493.3 | 467.9 | 484.3 | 499.7 | 6.4 | 1.3 |
|
Other services |
197.2 | 194.1 | 195.7 | 197.5 | 0.3 | 0.2 |
|
Government |
554.4 | 556.9 | 566.1 | 567.9 | 13.5 | 2.4 |
|
Dallas-Fort Worth-Arlington, TX |
||||||
|
Total nonfarm |
4,258.9 | 4,294.6 | 4,312.8 | 4,302.5 | 43.6 | 1.0 |
|
Mining, logging, and construction |
256.7 | 258.3 | 261.7 | 263.4 | 6.7 | 2.6 |
|
Manufacturing |
313.4 | 308.1 | 309.3 | 311.0 | -2.4 | -0.8 |
|
Trade, transportation, and utilities |
887.0 | 889.9 | 893.4 | 892.8 | 5.8 | 0.7 |
|
Information |
89.0 | 89.0 | 87.9 | 88.9 | -0.1 | -0.1 |
|
Financial activities |
380.5 | 383.3 | 385.0 | 384.8 | 4.3 | 1.1 |
|
Professional and business services |
770.7 | 771.2 | 768.8 | 760.5 | -10.2 | -1.3 |
|
Education and health services |
506.2 | 520.1 | 522.1 | 526.7 | 20.5 | 4.0 |
|
Leisure and hospitality |
438.0 | 437.4 | 443.3 | 445.5 | 7.5 | 1.7 |
|
Other services |
143.6 | 140.3 | 142.5 | 143.1 | -0.5 | -0.3 |
|
Government |
473.8 | 497.0 | 498.8 | 485.8 | 12.0 | 2.5 |
|
Houston-Pasadena-The Woodlands, TX |
||||||
|
Total nonfarm |
3,448.4 | 3,467.7 | 3,477.2 | 3,479.5 | 31.1 | 0.9 |
|
Mining and logging |
78.0 | 81.1 | 81.3 | 81.2 | 3.2 | 4.1 |
|
Construction |
233.1 | 232.6 | 233.3 | 236.0 | 2.9 | 1.2 |
|
Manufacturing |
240.6 | 239.5 | 239.0 | 241.5 | 0.9 | 0.4 |
|
Trade, transportation, and utilities |
693.3 | 699.4 | 702.2 | 701.9 | 8.6 | 1.2 |
|
Information |
30.4 | 29.3 | 29.4 | 29.4 | -1.0 | -3.3 |
|
Financial activities |
180.9 | 181.0 | 181.6 | 182.6 | 1.7 | 0.9 |
|
Professional and business services |
567.4 | 560.8 | 560.7 | 557.1 | -10.3 | -1.8 |
|
Education and health services |
457.8 | 469.0 | 469.5 | 470.5 | 12.7 | 2.8 |
|
Leisure and hospitality |
373.8 | 367.9 | 373.9 | 378.1 | 4.3 | 1.2 |
|
Other services |
134.1 | 135.3 | 137.4 | 137.1 | 3.0 | 2.2 |
|
Government |
459.0 | 471.8 | 468.9 | 464.1 | 5.1 | 1.1 |
|
Los Angeles-Long Beach-Anaheim, CA |
||||||
|
Total nonfarm |
6,248.6 | 6,287.8 | 6,306.5 | 6,302.2 | 53.6 | 0.9 |
|
Mining and logging |
2.0 | 2.1 | 2.1 | 2.1 | 0.1 | 5.0 |
|
Construction |
257.3 | 247.7 | 247.7 | 252.3 | -5.0 | -1.9 |
|
Manufacturing |
468.2 | 450.0 | 450.2 | 450.6 | -17.6 | -3.8 |
|
Trade, transportation, and utilities |
1,058.2 | 1,057.7 | 1,060.2 | 1,060.5 | 2.3 | 0.2 |
|
Information |
206.6 | 209.4 | 210.1 | 210.3 | 3.7 | 1.8 |
|
Financial activities |
311.0 | 303.5 | 303.7 | 304.0 | -7.0 | -2.3 |
|
Professional and business services |
959.7 | 960.8 | 961.2 | 953.9 | -5.8 | -0.6 |
|
Education and health services |
1,226.8 | 1,303.7 | 1,303.3 | 1,294.2 | 67.4 | 5.5 |
|
Leisure and hospitality |
775.9 | 764.4 | 774.9 | 782.4 | 6.5 | 0.8 |
|
Other services |
214.0 | 212.8 | 214.8 | 215.0 | 1.0 | 0.5 |
|
Government |
768.9 | 775.7 | 778.3 | 776.9 | 8.0 | 1.0 |
|
Miami-Fort Lauderdale-West Palm Beach, FL |
||||||
|
Total nonfarm |
2,922.0 | 3,000.3 | 3,005.4 | 2,964.6 | 42.6 | 1.5 |
|
Mining and logging |
0.9 | 0.9 | 0.9 | 0.9 | 0.0 | 0.0 |
|
Construction |
158.3 | 160.6 | 161.4 | 161.8 | 3.5 | 2.2 |
|
Manufacturing |
101.6 | 102.4 | 102.7 | 102.8 | 1.2 | 1.2 |
|
Trade, transportation, and utilities |
651.4 | 664.9 | 663.9 | 661.7 | 10.3 | 1.6 |
|
Information |
54.4 | 53.8 | 53.9 | 54.2 | -0.2 | -0.4 |
|
Financial activities |
220.2 | 220.0 | 221.6 | 220.9 | 0.7 | 0.3 |
|
Professional and business services |
516.8 | 521.9 | 523.7 | 523.4 | 6.6 | 1.3 |
|
Education and health services |
456.5 | 475.9 | 476.0 | 469.9 | 13.4 | 2.9 |
|
Leisure and hospitality |
345.3 | 356.9 | 357.0 | 347.2 | 1.9 | 0.6 |
|
Other services |
117.8 | 119.4 | 120.3 | 119.9 | 2.1 | 1.8 |
|
Government |
298.8 | 323.6 | 324.0 | 301.9 | 3.1 | 1.0 |
|
New York-Newark-Jersey City, NY-NJ |
||||||
|
Total nonfarm |
10,052.3 | 10,009.5 | 10,079.4 | 10,162.4 | 110.1 | 1.1 |
|
Mining, logging, and construction |
396.4 | 376.5 | 380.1 | 383.8 | -12.6 | -3.2 |
|
Manufacturing |
334.1 | 330.3 | 330.7 | 333.8 | -0.3 | -0.1 |
|
Trade, transportation, and utilities |
1,609.0 | 1,578.3 | 1,587.3 | 1,594.9 | -14.1 | -0.9 |
|
Information |
312.9 | 309.8 | 311.1 | 314.8 | 1.9 | 0.6 |
|
Financial activities |
830.6 | 814.5 | 815.7 | 832.8 | 2.2 | 0.3 |
|
Professional and business services |
1,644.7 | 1,611.4 | 1,619.4 | 1,640.5 | -4.2 | -0.3 |
|
Education and health services |
2,249.3 | 2,382.4 | 2,391.4 | 2,368.0 | 118.7 | 5.3 |
|
Leisure and hospitality |
967.1 | 884.8 | 928.4 | 972.2 | 5.1 | 0.5 |
|
Other services |
405.5 | 402.0 | 403.3 | 405.5 | 0.0 | 0.0 |
|
Government |
1,302.7 | 1,319.5 | 1,312.0 | 1,316.1 | 13.4 | 1.0 |
|
Philadelphia-Camden-Wilmington, PA-NJ-DE-MD |
||||||
|
Total nonfarm |
3,117.5 | 3,138.3 | 3,153.9 | 3,164.0 | 46.5 | 1.5 |
|
Mining, logging, and construction |
126.9 | 120.9 | 123.1 | 124.3 | -2.6 | -2.0 |
|
Manufacturing |
180.2 | 177.8 | 178.2 | 179.9 | -0.3 | -0.2 |
|
Trade, transportation, and utilities |
543.4 | 540.4 | 544.0 | 546.4 | 3.0 | 0.6 |
|
Information |
52.3 | 51.0 | 51.8 | 52.2 | -0.1 | -0.2 |
|
Financial activities |
228.6 | 224.2 | 224.8 | 227.1 | -1.5 | -0.7 |
|
Professional and business services |
499.2 | 501.5 | 504.7 | 506.2 | 7.0 | 1.4 |
|
Education and health services |
720.4 | 763.4 | 756.6 | 751.6 | 31.2 | 4.3 |
|
Leisure and hospitality |
294.9 | 274.5 | 287.1 | 297.0 | 2.1 | 0.7 |
|
Other services |
127.2 | 129.5 | 130.7 | 130.5 | 3.3 | 2.6 |
|
Government |
344.4 | 355.1 | 352.9 | 348.8 | 4.4 | 1.3 |
|
Phoenix-Mesa-Chandler, AZ |
||||||
|
Total nonfarm |
2,409.5 | 2,476.7 | 2,461.3 | 2,418.2 | 8.7 | 0.4 |
|
Mining and logging |
3.7 | 3.9 | 3.9 | 3.9 | 0.2 | 5.4 |
|
Construction |
181.9 | 181.6 | 179.5 | 179.7 | -2.2 | -1.2 |
|
Manufacturing |
150.8 | 147.2 | 146.8 | 147.9 | -2.9 | -1.9 |
|
Trade, transportation, and utilities |
468.5 | 468.3 | 465.1 | 466.3 | -2.2 | -0.5 |
|
Information |
41.1 | 39.4 | 39.0 | 38.5 | -2.6 | -6.3 |
|
Financial activities |
209.4 | 210.0 | 210.1 | 209.2 | -0.2 | -0.1 |
|
Professional and business services |
383.1 | 388.6 | 386.5 | 378.3 | -4.8 | -1.3 |
|
Education and health services |
400.1 | 424.7 | 423.2 | 415.8 | 15.7 | 3.9 |
|
Leisure and hospitality |
261.4 | 269.3 | 269.1 | 264.1 | 2.7 | 1.0 |
|
Other services |
78.4 | 80.4 | 79.8 | 79.5 | 1.1 | 1.4 |
|
Government |
231.1 | 263.3 | 258.3 | 235.0 | 3.9 | 1.7 |
|
San Francisco-Oakland-Fremont, CA |
||||||
|
Total nonfarm |
2,448.4 | 2,422.8 | 2,429.7 | 2,433.6 | -14.8 | -0.6 |
|
Mining and logging |
0.4 | 0.4 | 0.4 | 0.4 | 0.0 | 0.0 |
|
Construction |
121.0 | 115.6 | 116.5 | 119.7 | -1.3 | -1.1 |
|
Manufacturing |
140.4 | 132.8 | 132.7 | 131.0 | -9.4 | -6.7 |
|
Trade, transportation, and utilities |
340.8 | 341.3 | 342.5 | 341.7 | 0.9 | 0.3 |
|
Information |
136.5 | 131.5 | 131.1 | 131.3 | -5.2 | -3.8 |
|
Financial activities |
132.1 | 127.9 | 128.2 | 128.5 | -3.6 | -2.7 |
|
Professional and business services |
491.2 | 483.7 | 482.1 | 482.6 | -8.6 | -1.8 |
|
Education and health services |
411.8 | 428.3 | 427.2 | 426.5 | 14.7 | 3.6 |
|
Leisure and hospitality |
256.1 | 243.5 | 247.4 | 250.1 | -6.0 | -2.3 |
|
Other services |
88.0 | 87.0 | 88.5 | 89.0 | 1.0 | 1.1 |
|
Government |
330.1 | 330.8 | 333.1 | 332.8 | 2.7 | 0.8 |
|
Washington-Arlington-Alexandria, DC-VA-MD-WV |
||||||
|
Total nonfarm |
3,408.0 | 3,396.5 | 3,408.2 | 3,418.0 | 10.0 | 0.3 |
|
Mining, logging, and construction |
166.8 | 174.7 | 177.0 | 179.7 | 12.9 | 7.7 |
|
Manufacturing |
57.1 | 57.0 | 57.0 | 57.1 | 0.0 | 0.0 |
|
Trade, transportation, and utilities |
401.7 | 397.3 | 399.1 | 399.7 | -2.0 | -0.5 |
|
Information |
81.3 | 80.6 | 81.5 | 81.8 | 0.5 | 0.6 |
|
Financial activities |
154.7 | 154.3 | 154.3 | 155.4 | 0.7 | 0.5 |
|
Professional and business services |
815.1 | 801.4 | 803.9 | 807.5 | -7.6 | -0.9 |
|
Education and health services |
475.7 | 494.3 | 492.9 | 489.3 | 13.6 | 2.9 |
|
Leisure and hospitality |
342.5 | 323.6 | 332.1 | 342.5 | 0.0 | 0.0 |
|
Other services |
186.1 | 185.8 | 187.0 | 189.4 | 3.3 | 1.8 |
|
Government |
727.0 | 727.5 | 723.4 | 715.6 | -11.4 | -1.6 |
|
Footnotes |
||||||
Last Modified Date: Wednesday, July 30, 2025