
An official website of the United States government
An official website of the United States government
The .gov means it's official.
Federal government websites often end in .gov or .mil. Before sharing sensitive information,
make sure you're on a federal government site.
The site is secure.
The
https:// ensures that you are connecting to the official website and that any
information you provide is encrypted and transmitted securely.
Examine budget estimates for completeness, accuracy, and conformance with procedures and regulations. Analyze budgeting and accounting reports. Excludes �Financial and Investment Analysts� (13-2051).
Employment estimate and mean wage estimates for Budget Analysts:
| Employment (1) | Employment RSE (3) |
Mean hourly wage |
Mean annual wage (2) |
Wage RSE (3) |
|---|---|---|---|---|
| 47,310 | 0.6 % | $ 43.69 | $ 90,880 | 0.4 % |
Percentile wage estimates for Budget Analysts:
| Percentile | 10% | 25% | 50% (Median) |
75% | 90% |
|---|---|---|---|---|---|
| Hourly Wage | $ 27.29 | $ 32.95 | $ 40.84 | $ 51.67 | $ 63.29 |
| Annual Wage (2) | $ 56,760 | $ 68,540 | $ 84,940 | $ 107,470 | $ 131,630 |
Industries with the highest published employment and wages for Budget Analysts are provided. For a list of all industries with employment in Budget Analysts, see the Create Customized Tables function.
Industries with the highest levels of employment in Budget Analysts:
| Industry | Employment (1) | Percent of industry employment | Hourly mean wage | Annual mean wage (2) |
|---|---|---|---|---|
| Federal, State, and Local Government, excluding State and Local Government Schools and Hospitals and the U.S. Postal Service (OEWS Designation) | 11,870 | 0.55 | $ 47.23 | $ 98,230 |
| State Government, excluding Schools and Hospitals (OEWS Designation) | 5,560 | 0.26 | $ 37.92 | $ 78,870 |
| Local Government, excluding Schools and Hospitals (OEWS Designation) | 5,150 | 0.09 | $ 42.75 | $ 88,910 |
| Colleges, Universities, and Professional Schools | 4,500 | 0.15 | $ 36.68 | $ 76,290 |
| Management of Companies and Enterprises | 3,270 | 0.12 | $ 45.86 | $ 95,390 |
Industries with the highest concentration of employment in Budget Analysts:
| Industry | Employment (1) | Percent of industry employment | Hourly mean wage | Annual mean wage (2) |
|---|---|---|---|---|
| Manufacturing and Reproducing Magnetic and Optical Media | 80 | 0.66 | $ 60.64 | $ 126,140 |
| Federal, State, and Local Government, excluding State and Local Government Schools and Hospitals and the U.S. Postal Service (OEWS Designation) | 11,870 | 0.55 | $ 47.23 | $ 98,230 |
| State Government, excluding Schools and Hospitals (OEWS Designation) | 5,560 | 0.26 | $ 37.92 | $ 78,870 |
| Navigational, Measuring, Electromedical, and Control Instruments Manufacturing | 700 | 0.17 | $ 55.83 | $ 116,120 |
| Ship and Boat Building | 240 | 0.16 | $ 38.30 | $ 79,660 |
Top paying industries for Budget Analysts:
| Industry | Employment (1) | Percent of industry employment | Hourly mean wage | Annual mean wage (2) |
|---|---|---|---|---|
| Manufacturing and Reproducing Magnetic and Optical Media | 80 | 0.66 | $ 60.64 | $ 126,140 |
| Computing Infrastructure Providers, Data Processing, Web Hosting, and Related Services | 70 | 0.01 | $ 55.87 | $ 116,210 |
| Navigational, Measuring, Electromedical, and Control Instruments Manufacturing | 700 | 0.17 | $ 55.83 | $ 116,120 |
| Software Publishers | 180 | 0.03 | $ 55.79 | $ 116,040 |
| Traveler Accommodation | 510 | 0.03 | $ 55.31 | $ 115,050 |
States and areas with the highest published employment, location quotients, and wages for Budget Analysts are provided. For a list of all areas with employment in Budget Analysts, see the Create Customized Tables function.
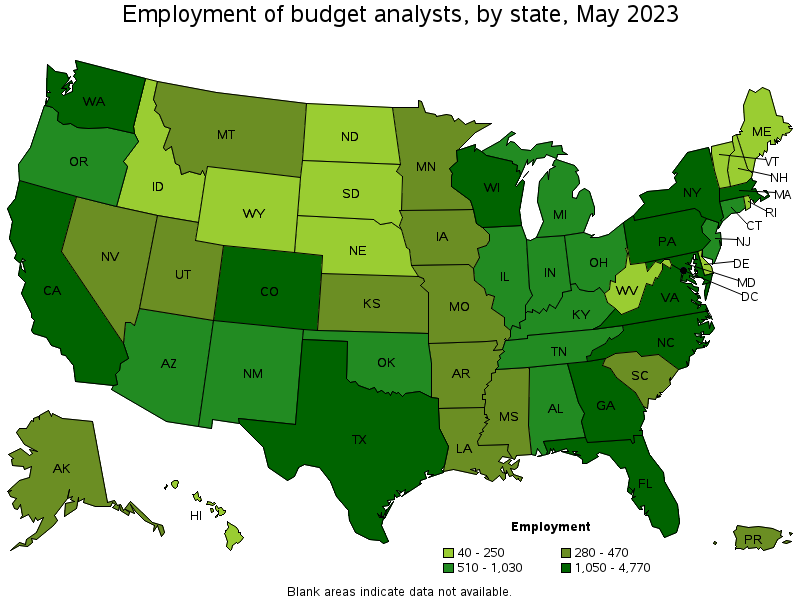
States with the highest employment level in Budget Analysts:
| State | Employment (1) | Employment per thousand jobs | Location quotient (9) | Hourly mean wage | Annual mean wage (2) |
|---|---|---|---|---|---|
| California | 4,770 | 0.27 | 0.85 | $ 49.52 | $ 102,990 |
| Texas | 3,770 | 0.28 | 0.89 | $ 39.31 | $ 81,760 |
| Florida | 3,710 | 0.39 | 1.24 | $ 40.84 | $ 84,950 |
| New York | 2,990 | 0.32 | 1.02 | $ 47.97 | $ 99,780 |
| Virginia | 2,620 | 0.66 | 2.11 | $ 50.02 | $ 104,050 |
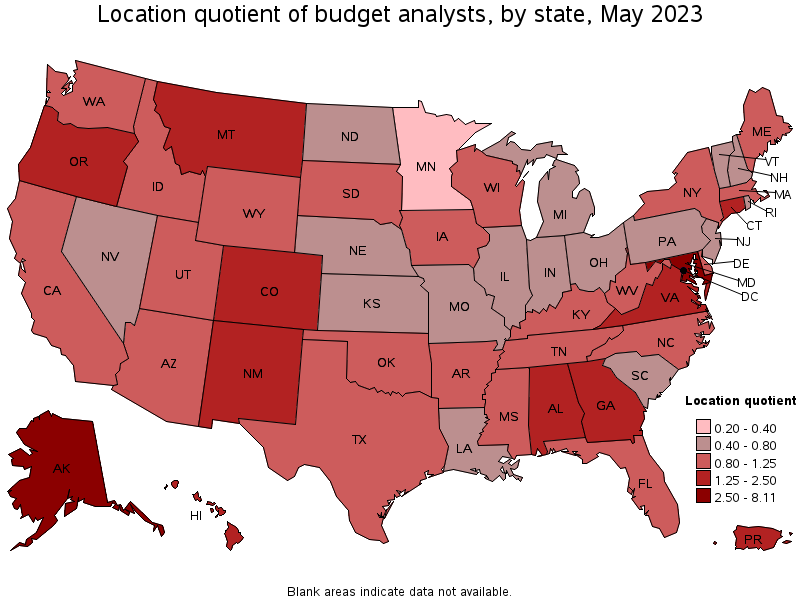
States with the highest concentration of jobs and location quotients in Budget Analysts:
| State | Employment (1) | Employment per thousand jobs | Location quotient (9) | Hourly mean wage | Annual mean wage (2) |
|---|---|---|---|---|---|
| District of Columbia | 1,680 | 2.40 | 7.69 | $ 55.11 | $ 114,620 |
| Maryland | 2,440 | 0.91 | 2.93 | $ 51.02 | $ 106,130 |
| Alaska | 280 | 0.90 | 2.89 | $ 44.55 | $ 92,660 |
| New Mexico | 630 | 0.75 | 2.40 | $ 44.98 | $ 93,550 |
| Virginia | 2,620 | 0.66 | 2.11 | $ 50.02 | $ 104,050 |
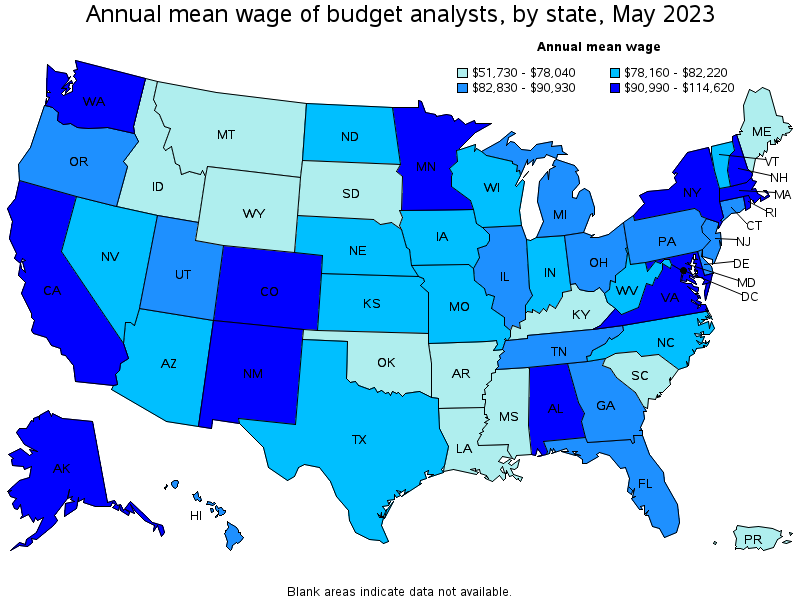
Top paying states for Budget Analysts:
| State | Employment (1) | Employment per thousand jobs | Location quotient (9) | Hourly mean wage | Annual mean wage (2) |
|---|---|---|---|---|---|
| District of Columbia | 1,680 | 2.40 | 7.69 | $ 55.11 | $ 114,620 |
| Maryland | 2,440 | 0.91 | 2.93 | $ 51.02 | $ 106,130 |
| Virginia | 2,620 | 0.66 | 2.11 | $ 50.02 | $ 104,050 |
| California | 4,770 | 0.27 | 0.85 | $ 49.52 | $ 102,990 |
| New York | 2,990 | 0.32 | 1.02 | $ 47.97 | $ 99,780 |
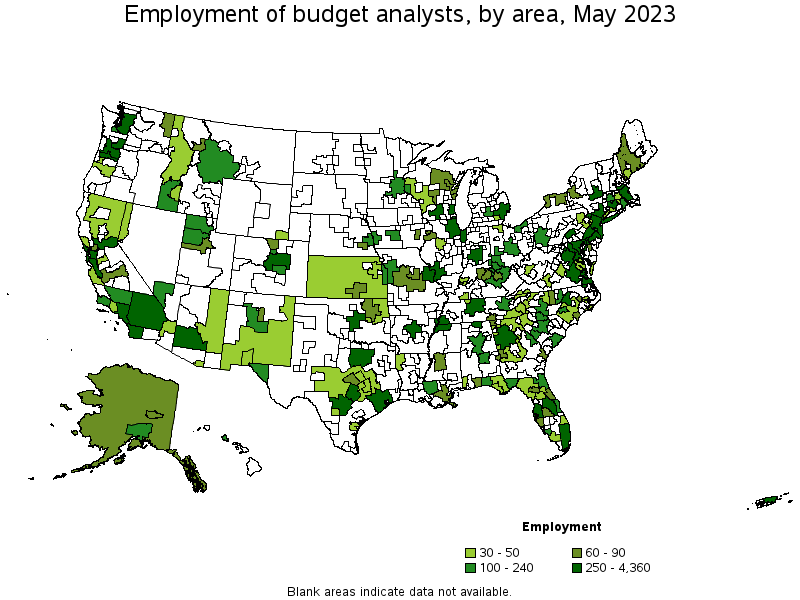
Metropolitan areas with the highest employment level in Budget Analysts:
| Metropolitan area | Employment (1) | Employment per thousand jobs | Location quotient (9) | Hourly mean wage | Annual mean wage (2) |
|---|---|---|---|---|---|
| Washington-Arlington-Alexandria, DC-VA-MD-WV | 4,360 | 1.41 | 4.52 | $ 55.56 | $ 115,560 |
| New York-Newark-Jersey City, NY-NJ-PA | 2,300 | 0.24 | 0.78 | $ 51.00 | $ 106,070 |
| Los Angeles-Long Beach-Anaheim, CA | 1,560 | 0.25 | 0.81 | $ 50.45 | $ 104,940 |
| Atlanta-Sandy Springs-Roswell, GA | 1,240 | 0.44 | 1.41 | $ 46.06 | $ 95,790 |
| Baltimore-Columbia-Towson, MD | 1,200 | 0.92 | 2.96 | $ 47.08 | $ 97,930 |
| Miami-Fort Lauderdale-West Palm Beach, FL | 1,100 | 0.40 | 1.29 | $ 45.35 | $ 94,330 |
| Dallas-Fort Worth-Arlington, TX | 1,060 | 0.27 | 0.86 | $ 39.57 | $ 82,300 |
| Boston-Cambridge-Nashua, MA-NH | 1,030 | 0.37 | 1.19 | $ 46.03 | $ 95,740 |
| Denver-Aurora-Lakewood, CO | 740 | 0.46 | 1.49 | $ 45.62 | $ 94,880 |
| Seattle-Tacoma-Bellevue, WA | 660 | 0.32 | 1.02 | $ 46.71 | $ 97,160 |
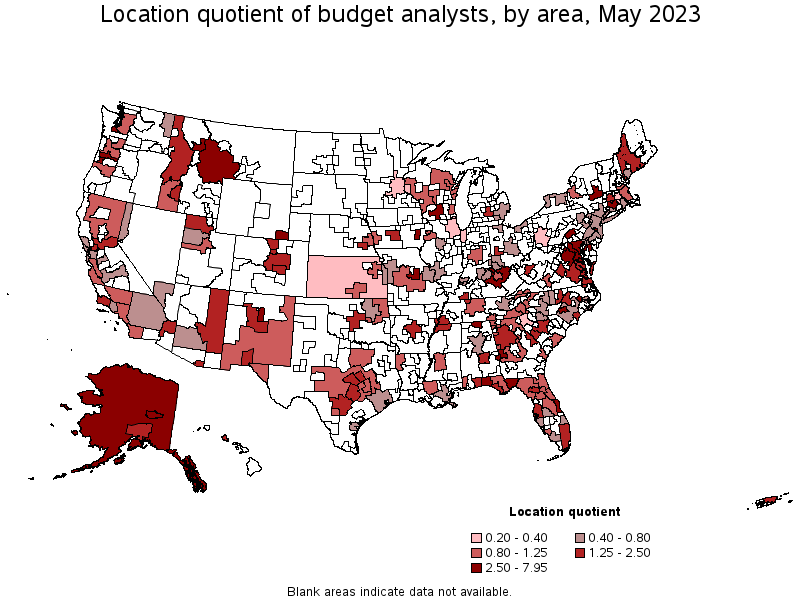
Metropolitan areas with the highest concentration of jobs and location quotients in Budget Analysts:
| Metropolitan area | Employment (1) | Employment per thousand jobs | Location quotient (9) | Hourly mean wage | Annual mean wage (2) |
|---|---|---|---|---|---|
| Huntsville, AL | 620 | 2.48 | 7.95 | $ 51.25 | $ 106,590 |
| Fairbanks, AK | 80 | 2.38 | 7.65 | $ 41.74 | $ 86,830 |
| Salem, OR | 310 | 1.70 | 5.47 | $ 45.94 | $ 95,540 |
| Olympia-Tumwater, WA | 210 | 1.67 | 5.37 | $ 39.98 | $ 83,160 |
| Fayetteville, NC | 210 | 1.59 | 5.11 | $ 44.29 | $ 92,130 |
| Washington-Arlington-Alexandria, DC-VA-MD-WV | 4,360 | 1.41 | 4.52 | $ 55.56 | $ 115,560 |
| Crestview-Fort Walton Beach-Destin, FL | 170 | 1.38 | 4.42 | $ 40.26 | $ 83,740 |
| Albany-Schenectady-Troy, NY | 570 | 1.29 | 4.14 | $ 38.41 | $ 79,880 |
| Jefferson City, MO | 80 | 1.11 | 3.55 | $ 30.51 | $ 63,460 |
| Cheyenne, WY | 50 | 1.08 | 3.46 | $ 36.42 | $ 75,750 |
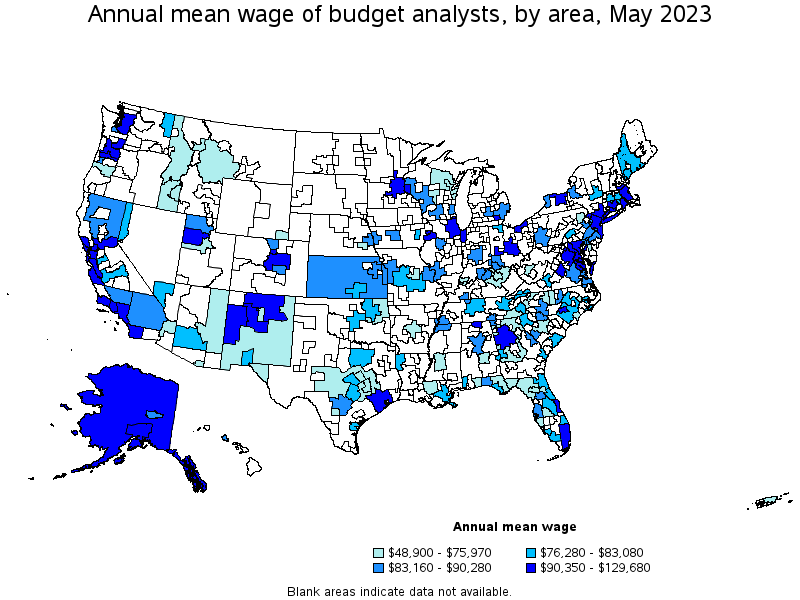
Top paying metropolitan areas for Budget Analysts:
| Metropolitan area | Employment (1) | Employment per thousand jobs | Location quotient (9) | Hourly mean wage | Annual mean wage (2) |
|---|---|---|---|---|---|
| San Jose-Sunnyvale-Santa Clara, CA | 330 | 0.29 | 0.94 | $ 62.35 | $ 129,680 |
| Washington-Arlington-Alexandria, DC-VA-MD-WV | 4,360 | 1.41 | 4.52 | $ 55.56 | $ 115,560 |
| San Francisco-Oakland-Hayward, CA | 590 | 0.24 | 0.78 | $ 54.66 | $ 113,700 |
| Santa Rosa, CA | 40 | 0.20 | 0.65 | $ 52.93 | $ 110,100 |
| Huntsville, AL | 620 | 2.48 | 7.95 | $ 51.25 | $ 106,590 |
| New York-Newark-Jersey City, NY-NJ-PA | 2,300 | 0.24 | 0.78 | $ 51.00 | $ 106,070 |
| Los Angeles-Long Beach-Anaheim, CA | 1,560 | 0.25 | 0.81 | $ 50.45 | $ 104,940 |
| Santa Maria-Santa Barbara, CA | 100 | 0.48 | 1.54 | $ 49.65 | $ 103,280 |
| Vallejo-Fairfield, CA | 60 | 0.44 | 1.40 | $ 48.96 | $ 101,840 |
| San Diego-Carlsbad, CA | 470 | 0.31 | 0.99 | $ 48.71 | $ 101,310 |
Nonmetropolitan areas with the highest employment in Budget Analysts:
| Nonmetropolitan area | Employment (1) | Employment per thousand jobs | Location quotient (9) | Hourly mean wage | Annual mean wage (2) |
|---|---|---|---|---|---|
| Central Kentucky nonmetropolitan area | 190 | 1.02 | 3.28 | $ 29.06 | $ 60,430 |
| Southwest Montana nonmetropolitan area | 170 | 1.14 | 3.65 | $ 34.82 | $ 72,430 |
| Southwest Maine nonmetropolitan area | 90 | 0.46 | 1.49 | $ 36.80 | $ 76,530 |
| Alaska nonmetropolitan area | 90 | 0.84 | 2.69 | $ 48.08 | $ 100,010 |
| Central Missouri nonmetropolitan area | 60 | 0.37 | 1.20 | $ 38.76 | $ 80,620 |
Nonmetropolitan areas with the highest concentration of jobs and location quotients in Budget Analysts:
| Nonmetropolitan area | Employment (1) | Employment per thousand jobs | Location quotient (9) | Hourly mean wage | Annual mean wage (2) |
|---|---|---|---|---|---|
| Southwest Montana nonmetropolitan area | 170 | 1.14 | 3.65 | $ 34.82 | $ 72,430 |
| Central Kentucky nonmetropolitan area | 190 | 1.02 | 3.28 | $ 29.06 | $ 60,430 |
| Alaska nonmetropolitan area | 90 | 0.84 | 2.69 | $ 48.08 | $ 100,010 |
| Northeast Virginia nonmetropolitan area | 40 | 0.73 | 2.33 | $ 58.84 | $ 122,400 |
| Northwestern Idaho nonmetropolitan area | 40 | 0.52 | 1.67 | $ 35.61 | $ 74,080 |
Top paying nonmetropolitan areas for Budget Analysts:
| Nonmetropolitan area | Employment (1) | Employment per thousand jobs | Location quotient (9) | Hourly mean wage | Annual mean wage (2) |
|---|---|---|---|---|---|
| Northeast Virginia nonmetropolitan area | 40 | 0.73 | 2.33 | $ 58.84 | $ 122,400 |
| Northern New Mexico nonmetropolitan area | (8) | (8) | (8) | $ 53.46 | $ 111,190 |
| Alaska nonmetropolitan area | 90 | 0.84 | 2.69 | $ 48.08 | $ 100,010 |
| North Valley-Northern Mountains Region of California nonmetropolitan area | 30 | 0.33 | 1.05 | $ 41.86 | $ 87,070 |
| Kansas nonmetropolitan area | 40 | 0.09 | 0.30 | $ 41.19 | $ 85,660 |
These estimates are calculated with data collected from employers in all industry sectors, all metropolitan and nonmetropolitan areas, and all states and the District of Columbia. The top employment and wage figures are provided above. The complete list is available in the downloadable XLS files.
The percentile wage estimate is the value of a wage below which a certain percent of workers fall. The median wage is the 50th percentile wage estimate—50 percent of workers earn less than the median and 50 percent of workers earn more than the median. More about percentile wages.
(1) Estimates for detailed occupations do not sum to the totals because the totals include occupations not shown separately. Estimates do not include self-employed workers.
(2) Annual wages have been calculated by multiplying the hourly mean wage by a "year-round, full-time" hours figure of 2,080 hours; for those occupations where there is not an hourly wage published, the annual wage has been directly calculated from the reported survey data.
(3) The relative standard error (RSE) is a measure of the reliability of a survey statistic. The smaller the relative standard error, the more precise the estimate.
(8) Estimate not released.
(9) The location quotient is the ratio of the area concentration of occupational employment to the national average concentration. A location quotient greater than one indicates the occupation has a higher share of employment than average, and a location quotient less than one indicates the occupation is less prevalent in the area than average.
Other OEWS estimates and related information:
May 2023 National Occupational Employment and Wage Estimates
May 2023 State Occupational Employment and Wage Estimates
May 2023 Metropolitan and Nonmetropolitan Area Occupational Employment and Wage Estimates
May 2023 National Industry-Specific Occupational Employment and Wage Estimates
Last Modified Date: April 3, 2024