
An official website of the United States government
An official website of the United States government
The .gov means it's official.
Federal government websites often end in .gov or .mil. Before sharing sensitive information,
make sure you're on a federal government site.
The site is secure.
The
https:// ensures that you are connecting to the official website and that any
information you provide is encrypted and transmitted securely.
Research, study, and prepare maps and other spatial data in digital or graphic form for one or more purposes, such as legal, social, political, educational, and design purposes. May work with Geographic Information Systems (GIS). May design and evaluate algorithms, data structures, and user interfaces for GIS and mapping systems. May collect, analyze, and interpret geographic information provided by geodetic surveys, aerial photographs, and satellite data.
Employment estimate and mean wage estimates for Cartographers and Photogrammetrists:
| Employment (1) | Employment RSE (3) |
Mean hourly wage |
Mean annual wage (2) |
Wage RSE (3) |
|---|---|---|---|---|
| 12,330 | 4.0 % | $ 37.89 | $ 78,810 | 0.8 % |
Percentile wage estimates for Cartographers and Photogrammetrists:
| Percentile | 10% | 25% | 50% (Median) |
75% | 90% |
|---|---|---|---|---|---|
| Hourly Wage | $ 23.39 | $ 29.06 | $ 36.64 | $ 45.97 | $ 54.59 |
| Annual Wage (2) | $ 48,660 | $ 60,430 | $ 76,210 | $ 95,610 | $ 113,540 |
Industries with the highest published employment and wages for Cartographers and Photogrammetrists are provided. For a list of all industries with employment in Cartographers and Photogrammetrists, see the Create Customized Tables function.
Industries with the highest levels of employment in Cartographers and Photogrammetrists:
| Industry | Employment (1) | Percent of industry employment | Hourly mean wage | Annual mean wage (2) |
|---|---|---|---|---|
| Local Government, excluding Schools and Hospitals (OEWS Designation) | 4,760 | 0.09 | $ 37.65 | $ 78,300 |
| Architectural, Engineering, and Related Services | 2,300 | 0.14 | $ 34.50 | $ 71,760 |
| Management, Scientific, and Technical Consulting Services | 1,010 | 0.05 | $ 33.81 | $ 70,330 |
| Federal, State, and Local Government, excluding State and Local Government Schools and Hospitals and the U.S. Postal Service (OEWS Designation) | 550 | 0.03 | $ 50.37 | $ 104,770 |
| State Government, excluding Schools and Hospitals (OEWS Designation) | 500 | 0.02 | $ 35.06 | $ 72,910 |
Industries with the highest concentration of employment in Cartographers and Photogrammetrists:
| Industry | Employment (1) | Percent of industry employment | Hourly mean wage | Annual mean wage (2) |
|---|---|---|---|---|
| Natural Gas Distribution | 320 | 0.28 | $ 49.23 | $ 102,400 |
| Architectural, Engineering, and Related Services | 2,300 | 0.14 | $ 34.50 | $ 71,760 |
| Local Government, excluding Schools and Hospitals (OEWS Designation) | 4,760 | 0.09 | $ 37.65 | $ 78,300 |
| Oil and Gas Extraction | 80 | 0.08 | $ 54.66 | $ 113,700 |
| Electric Power Generation, Transmission and Distribution | 260 | 0.07 | $ 43.99 | $ 91,490 |
Top paying industries for Cartographers and Photogrammetrists:
| Industry | Employment (1) | Percent of industry employment | Hourly mean wage | Annual mean wage (2) |
|---|---|---|---|---|
| Oil and Gas Extraction | 80 | 0.08 | $ 54.66 | $ 113,700 |
| Federal, State, and Local Government, excluding State and Local Government Schools and Hospitals and the U.S. Postal Service (OEWS Designation) | 550 | 0.03 | $ 50.37 | $ 104,770 |
| Natural Gas Distribution | 320 | 0.28 | $ 49.23 | $ 102,400 |
| Electric Power Generation, Transmission and Distribution | 260 | 0.07 | $ 43.99 | $ 91,490 |
| Merchant Wholesalers, Nondurable Goods (4241, 4247, and 4249 only) | 40 | 0.01 | $ 43.67 | $ 90,840 |
States and areas with the highest published employment, location quotients, and wages for Cartographers and Photogrammetrists are provided. For a list of all areas with employment in Cartographers and Photogrammetrists, see the Create Customized Tables function.
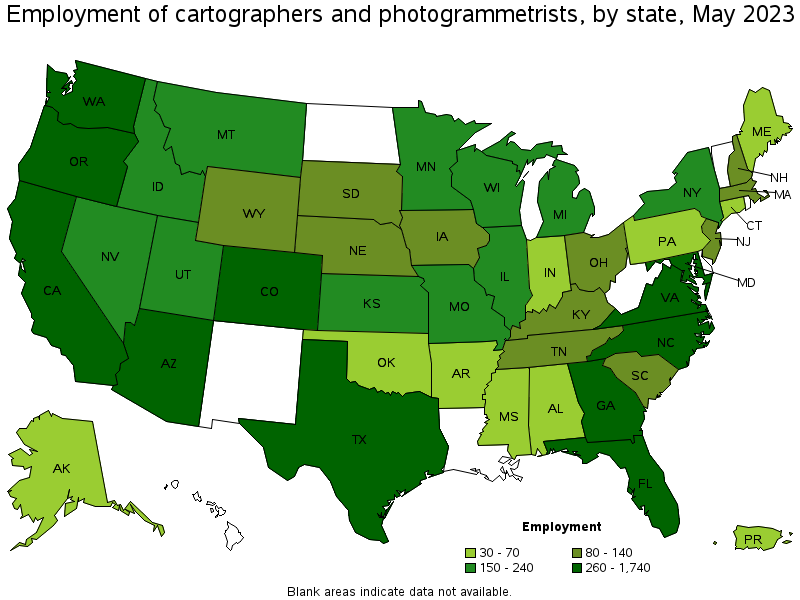
States with the highest employment level in Cartographers and Photogrammetrists:
| State | Employment (1) | Employment per thousand jobs | Location quotient (9) | Hourly mean wage | Annual mean wage (2) |
|---|---|---|---|---|---|
| Texas | 1,740 | 0.13 | 1.58 | $ 35.92 | $ 74,720 |
| California | 1,140 | 0.06 | 0.78 | $ 48.50 | $ 100,870 |
| Colorado | 1,050 | 0.37 | 4.57 | $ 42.66 | $ 88,740 |
| North Carolina | 840 | 0.18 | 2.16 | $ 32.43 | $ 67,450 |
| Virginia | 730 | 0.18 | 2.26 | $ 38.56 | $ 80,200 |
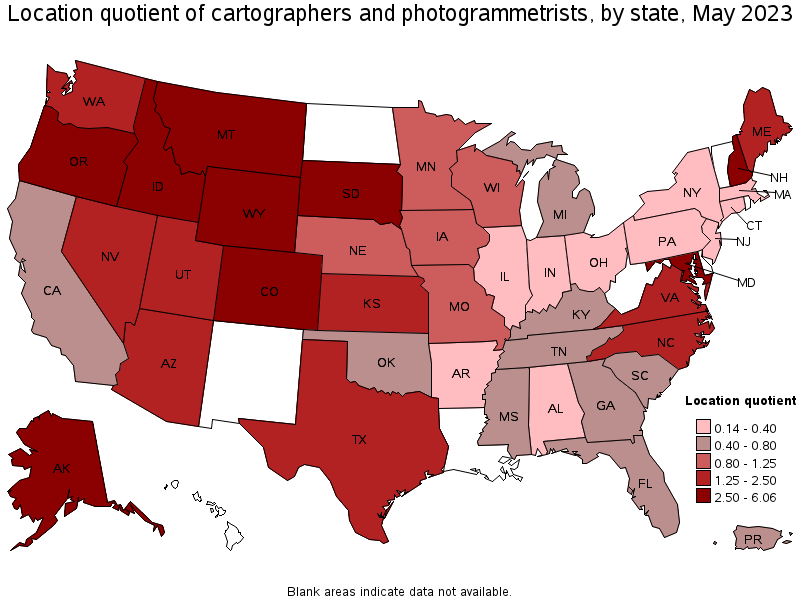
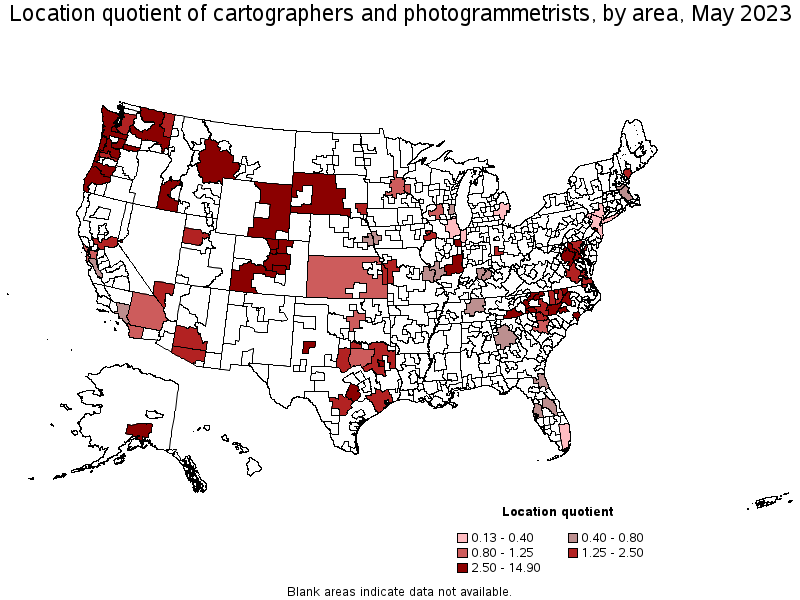
States with the highest concentration of jobs and location quotients in Cartographers and Photogrammetrists:
| State | Employment (1) | Employment per thousand jobs | Location quotient (9) | Hourly mean wage | Annual mean wage (2) |
|---|---|---|---|---|---|
| Wyoming | 130 | 0.49 | 6.06 | $ 32.72 | $ 68,060 |
| Montana | 240 | 0.47 | 5.84 | $ 27.59 | $ 57,390 |
| Colorado | 1,050 | 0.37 | 4.57 | $ 42.66 | $ 88,740 |
| Idaho | 230 | 0.28 | 3.49 | $ 26.78 | $ 55,710 |
| Oregon | 530 | 0.27 | 3.34 | $ 39.18 | $ 81,500 |
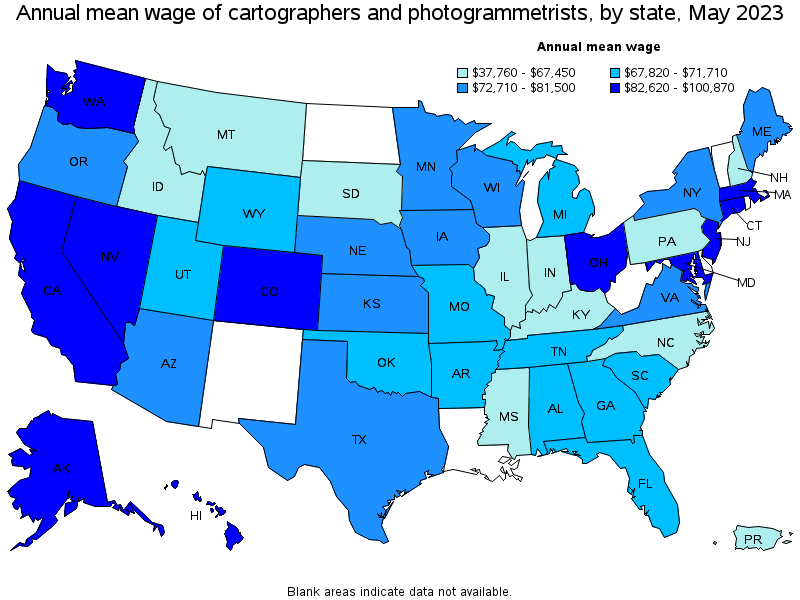
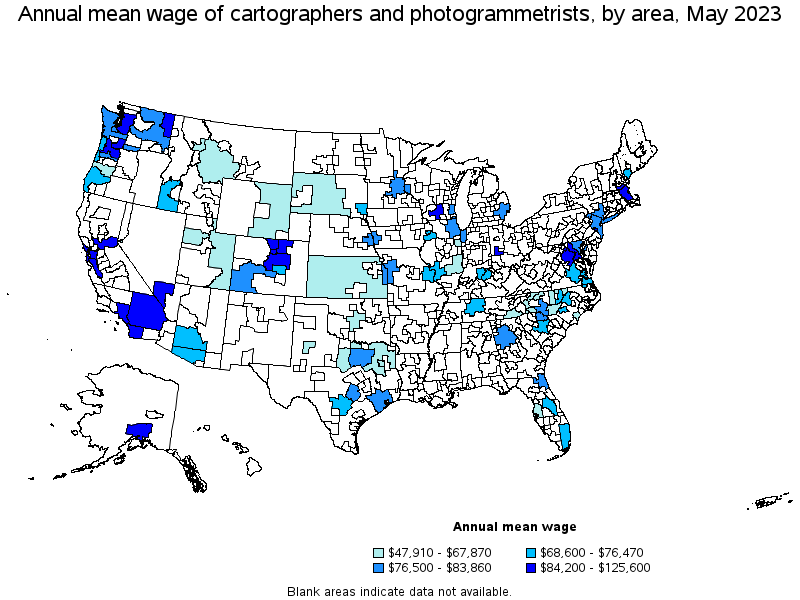
Top paying states for Cartographers and Photogrammetrists:
| State | Employment (1) | Employment per thousand jobs | Location quotient (9) | Hourly mean wage | Annual mean wage (2) |
|---|---|---|---|---|---|
| California | 1,140 | 0.06 | 0.78 | $ 48.50 | $ 100,870 |
| Washington | 650 | 0.19 | 2.30 | $ 43.44 | $ 90,350 |
| Connecticut | 50 | 0.03 | 0.36 | $ 43.03 | $ 89,510 |
| Massachusetts | 110 | 0.03 | 0.37 | $ 42.85 | $ 89,130 |
| Maryland | 570 | 0.21 | 2.63 | $ 42.81 | $ 89,040 |
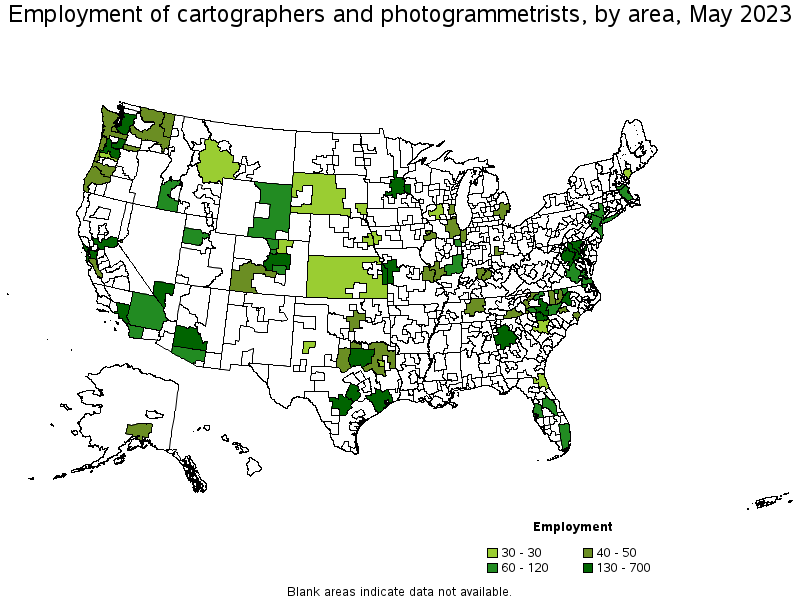
Metropolitan areas with the highest employment level in Cartographers and Photogrammetrists:
| Metropolitan area | Employment (1) | Employment per thousand jobs | Location quotient (9) | Hourly mean wage | Annual mean wage (2) |
|---|---|---|---|---|---|
| Washington-Arlington-Alexandria, DC-VA-MD-WV | 700 | 0.23 | 2.77 | $ 45.24 | $ 94,100 |
| Denver-Aurora-Lakewood, CO | 660 | 0.42 | 5.12 | $ 44.60 | $ 92,780 |
| Houston-The Woodlands-Sugar Land, TX | 430 | 0.14 | 1.67 | $ 36.82 | $ 76,590 |
| Austin-Round Rock, TX | 370 | 0.30 | 3.69 | $ 38.43 | $ 79,930 |
| Dallas-Fort Worth-Arlington, TX | 330 | 0.08 | 1.03 | $ 38.12 | $ 79,280 |
| Portland-Vancouver-Hillsboro, OR-WA | 330 | 0.27 | 3.38 | $ 41.54 | $ 86,410 |
| Seattle-Tacoma-Bellevue, WA | 320 | 0.15 | 1.87 | $ 45.85 | $ 95,370 |
| Los Angeles-Long Beach-Anaheim, CA | 270 | 0.04 | 0.54 | $ 46.42 | $ 96,550 |
| Phoenix-Mesa-Scottsdale, AZ | 240 | 0.11 | 1.31 | $ 35.51 | $ 73,850 |
| Raleigh, NC | 240 | 0.34 | 4.15 | $ 33.32 | $ 69,300 |
Metropolitan areas with the highest concentration of jobs and location quotients in Cartographers and Photogrammetrists:
| Metropolitan area | Employment (1) | Employment per thousand jobs | Location quotient (9) | Hourly mean wage | Annual mean wage (2) |
|---|---|---|---|---|---|
| Carson City, NV | 40 | 1.21 | 14.90 | $ 30.98 | $ 64,440 |
| Boulder, CO | 90 | 0.45 | 5.60 | $ 40.52 | $ 84,270 |
| Denver-Aurora-Lakewood, CO | 660 | 0.42 | 5.12 | $ 44.60 | $ 92,780 |
| Fort Collins, CO | 70 | 0.40 | 4.88 | $ 40.68 | $ 84,610 |
| Fayetteville, NC | 40 | 0.34 | 4.20 | $ 36.16 | $ 75,210 |
| Raleigh, NC | 240 | 0.34 | 4.15 | $ 33.32 | $ 69,300 |
| Olympia-Tumwater, WA | 40 | 0.32 | 3.96 | $ 40.32 | $ 83,860 |
| Austin-Round Rock, TX | 370 | 0.30 | 3.69 | $ 38.43 | $ 79,930 |
| Tyler, TX | 30 | 0.29 | 3.59 | $ 31.25 | $ 65,000 |
| Greeley, CO | 30 | 0.29 | 3.55 | $ 43.91 | $ 91,340 |
Top paying metropolitan areas for Cartographers and Photogrammetrists:
| Metropolitan area | Employment (1) | Employment per thousand jobs | Location quotient (9) | Hourly mean wage | Annual mean wage (2) |
|---|---|---|---|---|---|
| San Jose-Sunnyvale-Santa Clara, CA | 50 | 0.04 | 0.50 | $ 60.39 | $ 125,600 |
| San Francisco-Oakland-Hayward, CA | 190 | 0.08 | 0.98 | $ 56.56 | $ 117,630 |
| Sacramento--Roseville--Arden-Arcade, CA | 130 | 0.12 | 1.53 | $ 53.94 | $ 112,190 |
| Dayton, OH | 40 | 0.12 | 1.51 | $ 48.69 | $ 101,280 |
| Los Angeles-Long Beach-Anaheim, CA | 270 | 0.04 | 0.54 | $ 46.42 | $ 96,550 |
| Seattle-Tacoma-Bellevue, WA | 320 | 0.15 | 1.87 | $ 45.85 | $ 95,370 |
| Washington-Arlington-Alexandria, DC-VA-MD-WV | 700 | 0.23 | 2.77 | $ 45.24 | $ 94,100 |
| Denver-Aurora-Lakewood, CO | 660 | 0.42 | 5.12 | $ 44.60 | $ 92,780 |
| Las Vegas-Henderson-Paradise, NV | 130 | 0.12 | 1.43 | $ 44.30 | $ 92,140 |
| Trenton, NJ | 60 | 0.26 | 3.25 | $ 44.22 | $ 91,990 |
Nonmetropolitan areas with the highest employment in Cartographers and Photogrammetrists:
| Nonmetropolitan area | Employment (1) | Employment per thousand jobs | Location quotient (9) | Hourly mean wage | Annual mean wage (2) |
|---|---|---|---|---|---|
| Eastern Wyoming nonmetropolitan area | 70 | 0.80 | 9.82 | $ 32.63 | $ 67,870 |
| East Central Illinois nonmetropolitan area | 60 | 0.53 | 6.48 | $ 24.89 | $ 51,780 |
| Piedmont North Carolina nonmetropolitan area | 60 | 0.22 | 2.73 | $ 25.73 | $ 53,510 |
| Western Washington nonmetropolitan area | 50 | 0.42 | 5.18 | $ 39.83 | $ 82,840 |
| Southwest Colorado nonmetropolitan area | 50 | 0.49 | 6.09 | $ 36.78 | $ 76,500 |
Nonmetropolitan areas with the highest concentration of jobs and location quotients in Cartographers and Photogrammetrists:
| Nonmetropolitan area | Employment (1) | Employment per thousand jobs | Location quotient (9) | Hourly mean wage | Annual mean wage (2) |
|---|---|---|---|---|---|
| Eastern Wyoming nonmetropolitan area | 70 | 0.80 | 9.82 | $ 32.63 | $ 67,870 |
| West South Dakota nonmetropolitan area | 30 | 0.55 | 6.80 | $ 24.18 | $ 50,290 |
| East Central Illinois nonmetropolitan area | 60 | 0.53 | 6.48 | $ 24.89 | $ 51,780 |
| Southwest Colorado nonmetropolitan area | 50 | 0.49 | 6.09 | $ 36.78 | $ 76,500 |
| Western Washington nonmetropolitan area | 50 | 0.42 | 5.18 | $ 39.83 | $ 82,840 |
Top paying nonmetropolitan areas for Cartographers and Photogrammetrists:
| Nonmetropolitan area | Employment (1) | Employment per thousand jobs | Location quotient (9) | Hourly mean wage | Annual mean wage (2) |
|---|---|---|---|---|---|
| Western Washington nonmetropolitan area | 50 | 0.42 | 5.18 | $ 39.83 | $ 82,840 |
| Eastern Washington nonmetropolitan area | 40 | 0.34 | 4.19 | $ 39.25 | $ 81,650 |
| Southwest Colorado nonmetropolitan area | 50 | 0.49 | 6.09 | $ 36.78 | $ 76,500 |
| Coast Oregon nonmetropolitan area | 40 | 0.33 | 4.06 | $ 36.76 | $ 76,470 |
| Eastern Wyoming nonmetropolitan area | 70 | 0.80 | 9.82 | $ 32.63 | $ 67,870 |
These estimates are calculated with data collected from employers in all industry sectors, all metropolitan and nonmetropolitan areas, and all states and the District of Columbia. The top employment and wage figures are provided above. The complete list is available in the downloadable XLS files.
The percentile wage estimate is the value of a wage below which a certain percent of workers fall. The median wage is the 50th percentile wage estimate—50 percent of workers earn less than the median and 50 percent of workers earn more than the median. More about percentile wages.
(1) Estimates for detailed occupations do not sum to the totals because the totals include occupations not shown separately. Estimates do not include self-employed workers.
(2) Annual wages have been calculated by multiplying the hourly mean wage by a "year-round, full-time" hours figure of 2,080 hours; for those occupations where there is not an hourly wage published, the annual wage has been directly calculated from the reported survey data.
(3) The relative standard error (RSE) is a measure of the reliability of a survey statistic. The smaller the relative standard error, the more precise the estimate.
(9) The location quotient is the ratio of the area concentration of occupational employment to the national average concentration. A location quotient greater than one indicates the occupation has a higher share of employment than average, and a location quotient less than one indicates the occupation is less prevalent in the area than average.
Other OEWS estimates and related information:
May 2023 National Occupational Employment and Wage Estimates
May 2023 State Occupational Employment and Wage Estimates
May 2023 Metropolitan and Nonmetropolitan Area Occupational Employment and Wage Estimates
May 2023 National Industry-Specific Occupational Employment and Wage Estimates
Last Modified Date: April 3, 2024