
An official website of the United States government
An official website of the United States government
The .gov means it's official.
Federal government websites often end in .gov or .mil. Before sharing sensitive information,
make sure you're on a federal government site.
The site is secure.
The
https:// ensures that you are connecting to the official website and that any
information you provide is encrypted and transmitted securely.
Assist social scientists in laboratory, survey, and other social science research. May help prepare findings for publication and assist in laboratory analysis, quality control, or data management. Excludes �Teaching Assistants, Postsecondary� (25-9044).
Employment estimate and mean wage estimates for Social Science Research Assistants:
| Employment (1) | Employment RSE (3) |
Mean hourly wage |
Mean annual wage (2) |
Wage RSE (3) |
|---|---|---|---|---|
| 30,890 | 2.9 % | $ 29.99 | $ 62,370 | 1.5 % |
Percentile wage estimates for Social Science Research Assistants:
| Percentile | 10% | 25% | 50% (Median) |
75% | 90% |
|---|---|---|---|---|---|
| Hourly Wage | $ 17.83 | $ 22.18 | $ 27.11 | $ 33.52 | $ 46.50 |
| Annual Wage (2) | $ 37,080 | $ 46,140 | $ 56,400 | $ 69,720 | $ 96,720 |
Industries with the highest published employment and wages for Social Science Research Assistants are provided. For a list of all industries with employment in Social Science Research Assistants, see the Create Customized Tables function.
Industries with the highest levels of employment in Social Science Research Assistants:
| Industry | Employment (1) | Percent of industry employment | Hourly mean wage | Annual mean wage (2) |
|---|---|---|---|---|
| Colleges, Universities, and Professional Schools | 12,960 | 0.42 | $ 28.33 | $ 58,930 |
| Scientific Research and Development Services | 10,340 | 1.12 | $ 32.11 | $ 66,790 |
| General Medical and Surgical Hospitals | 1,370 | 0.02 | $ 27.48 | $ 57,150 |
| Management, Scientific, and Technical Consulting Services | 1,350 | 0.07 | $ 37.99 | $ 79,030 |
| Other Professional, Scientific, and Technical Services | 1,120 | 0.13 | $ 25.44 | $ 52,920 |
Industries with the highest concentration of employment in Social Science Research Assistants:
| Industry | Employment (1) | Percent of industry employment | Hourly mean wage | Annual mean wage (2) |
|---|---|---|---|---|
| Scientific Research and Development Services | 10,340 | 1.12 | $ 32.11 | $ 66,790 |
| Colleges, Universities, and Professional Schools | 12,960 | 0.42 | $ 28.33 | $ 58,930 |
| Monetary Authorities-Central Bank | 50 | 0.25 | $ 31.78 | $ 66,100 |
| Social Advocacy Organizations | 440 | 0.17 | $ 23.36 | $ 48,580 |
| Other Professional, Scientific, and Technical Services | 1,120 | 0.13 | $ 25.44 | $ 52,920 |
Top paying industries for Social Science Research Assistants:
| Industry | Employment (1) | Percent of industry employment | Hourly mean wage | Annual mean wage (2) |
|---|---|---|---|---|
| Merchant Wholesalers, Nondurable Goods (4242 and 4246 only) | 40 | 0.01 | $ 81.70 | $ 169,940 |
| Management, Scientific, and Technical Consulting Services | 1,350 | 0.07 | $ 37.99 | $ 79,030 |
| Educational Support Services | 230 | 0.09 | $ 33.77 | $ 70,240 |
| Medical and Diagnostic Laboratories | 40 | 0.01 | $ 32.40 | $ 67,400 |
| Management of Companies and Enterprises | 150 | 0.01 | $ 32.31 | $ 67,190 |
States and areas with the highest published employment, location quotients, and wages for Social Science Research Assistants are provided. For a list of all areas with employment in Social Science Research Assistants, see the Create Customized Tables function.
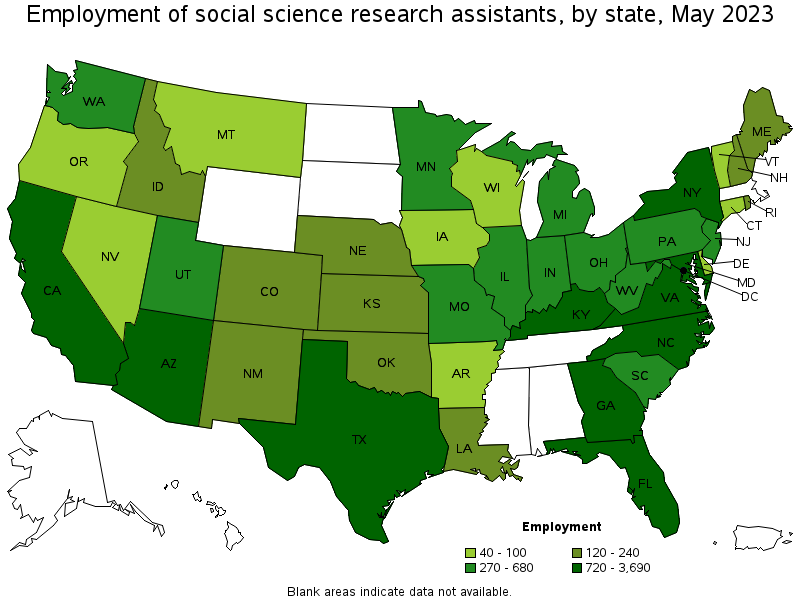
States with the highest employment level in Social Science Research Assistants:
| State | Employment (1) | Employment per thousand jobs | Location quotient (9) | Hourly mean wage | Annual mean wage (2) |
|---|---|---|---|---|---|
| New York | 3,690 | 0.39 | 1.93 | $ 30.67 | $ 63,790 |
| California | 3,440 | 0.19 | 0.94 | $ 35.39 | $ 73,610 |
| North Carolina | 3,240 | 0.68 | 3.32 | $ 27.39 | $ 56,960 |
| District of Columbia | 2,390 | 3.40 | 16.71 | $ 35.84 | $ 74,550 |
| Georgia | 2,100 | 0.44 | 2.17 | $ 35.93 | $ 74,740 |
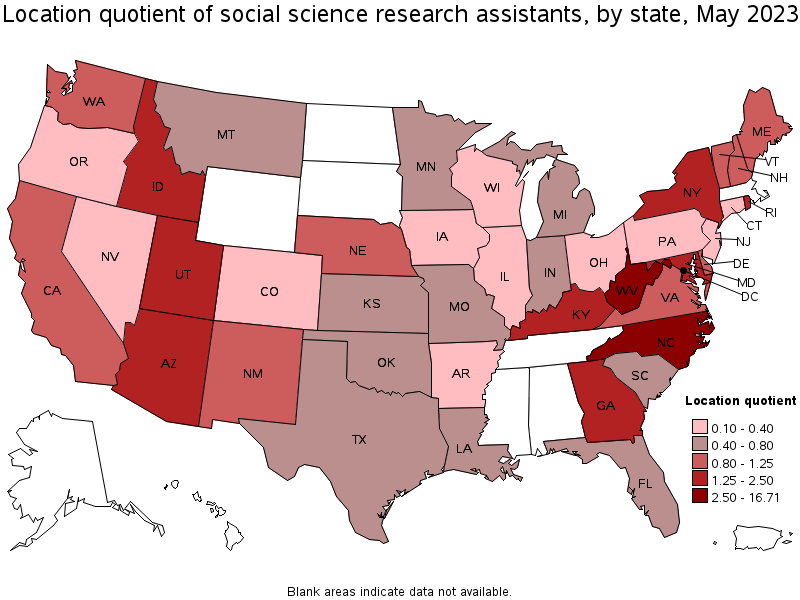
States with the highest concentration of jobs and location quotients in Social Science Research Assistants:
| State | Employment (1) | Employment per thousand jobs | Location quotient (9) | Hourly mean wage | Annual mean wage (2) |
|---|---|---|---|---|---|
| District of Columbia | 2,390 | 3.40 | 16.71 | $ 35.84 | $ 74,550 |
| North Carolina | 3,240 | 0.68 | 3.32 | $ 27.39 | $ 56,960 |
| West Virginia | 370 | 0.53 | 2.61 | $ 24.76 | $ 51,490 |
| Kentucky | 990 | 0.50 | 2.48 | $ 33.24 | $ 69,140 |
| Georgia | 2,100 | 0.44 | 2.17 | $ 35.93 | $ 74,740 |
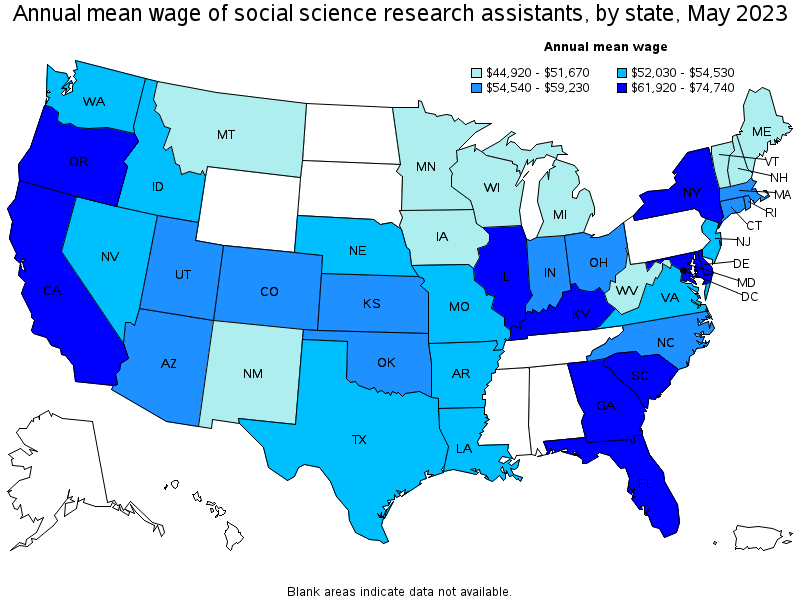
Top paying states for Social Science Research Assistants:
| State | Employment (1) | Employment per thousand jobs | Location quotient (9) | Hourly mean wage | Annual mean wage (2) |
|---|---|---|---|---|---|
| Georgia | 2,100 | 0.44 | 2.17 | $ 35.93 | $ 74,740 |
| District of Columbia | 2,390 | 3.40 | 16.71 | $ 35.84 | $ 74,550 |
| California | 3,440 | 0.19 | 0.94 | $ 35.39 | $ 73,610 |
| Kentucky | 990 | 0.50 | 2.48 | $ 33.24 | $ 69,140 |
| South Carolina | 320 | 0.15 | 0.72 | $ 32.44 | $ 67,460 |
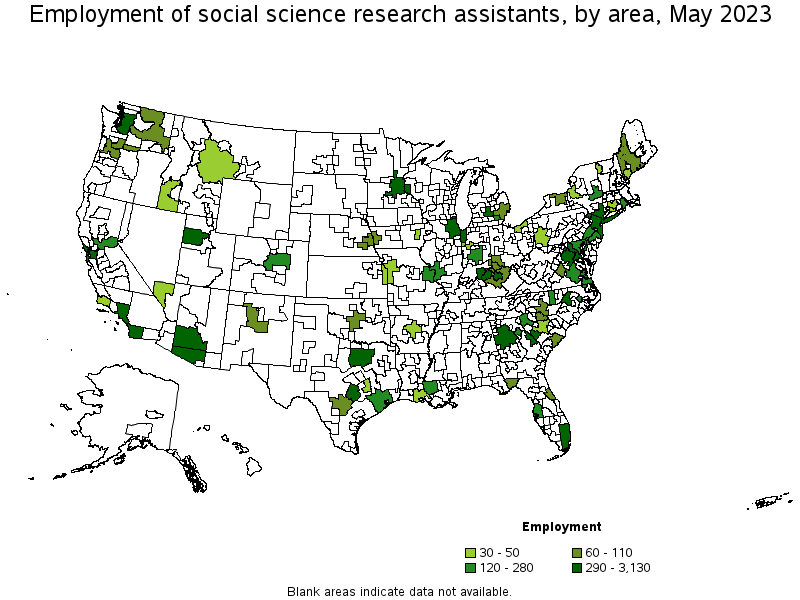
Metropolitan areas with the highest employment level in Social Science Research Assistants:
| Metropolitan area | Employment (1) | Employment per thousand jobs | Location quotient (9) | Hourly mean wage | Annual mean wage (2) |
|---|---|---|---|---|---|
| Washington-Arlington-Alexandria, DC-VA-MD-WV | 3,130 | 1.01 | 4.98 | $ 34.39 | $ 71,540 |
| New York-Newark-Jersey City, NY-NJ-PA | 3,080 | 0.32 | 1.59 | $ 32.22 | $ 67,010 |
| Atlanta-Sandy Springs-Roswell, GA | 1,230 | 0.44 | 2.14 | $ 40.64 | $ 84,520 |
| Los Angeles-Long Beach-Anaheim, CA | 1,210 | 0.20 | 0.96 | $ 32.41 | $ 67,400 |
| Tucson, AZ | 920 | 2.40 | 11.81 | $ 25.89 | $ 53,860 |
| San Francisco-Oakland-Hayward, CA | 720 | 0.30 | 1.46 | $ 38.46 | $ 80,000 |
| Salt Lake City, UT | 540 | 0.67 | 3.28 | $ 26.68 | $ 55,500 |
| Austin-Round Rock, TX | 530 | 0.43 | 2.11 | $ 26.42 | $ 54,950 |
| Raleigh, NC | 490 | 0.70 | 3.46 | $ 27.88 | $ 58,000 |
| Louisville/Jefferson County, KY-IN | 460 | 0.69 | 3.40 | $ 38.12 | $ 79,280 |

Metropolitan areas with the highest concentration of jobs and location quotients in Social Science Research Assistants:
| Metropolitan area | Employment (1) | Employment per thousand jobs | Location quotient (9) | Hourly mean wage | Annual mean wage (2) |
|---|---|---|---|---|---|
| Athens-Clarke County, GA | 280 | 3.06 | 15.05 | $ 25.70 | $ 53,460 |
| Tucson, AZ | 920 | 2.40 | 11.81 | $ 25.89 | $ 53,860 |
| Greenville, NC | 150 | 1.82 | 8.95 | $ 26.29 | $ 54,690 |
| Lansing-East Lansing, MI | 350 | 1.66 | 8.18 | $ 27.35 | $ 56,880 |
| Augusta-Richmond County, GA-SC | 290 | 1.26 | 6.18 | $ 30.02 | $ 62,440 |
| Lexington-Fayette, KY | 290 | 1.05 | 5.14 | $ 26.38 | $ 54,870 |
| Washington-Arlington-Alexandria, DC-VA-MD-WV | 3,130 | 1.01 | 4.98 | $ 34.39 | $ 71,540 |
| Charlottesville, VA | 90 | 0.77 | 3.80 | $ 25.94 | $ 53,960 |
| Ann Arbor, MI | 160 | 0.76 | 3.73 | $ 21.04 | $ 43,770 |
| Raleigh, NC | 490 | 0.70 | 3.46 | $ 27.88 | $ 58,000 |

Top paying metropolitan areas for Social Science Research Assistants:
| Metropolitan area | Employment (1) | Employment per thousand jobs | Location quotient (9) | Hourly mean wage | Annual mean wage (2) |
|---|---|---|---|---|---|
| Atlanta-Sandy Springs-Roswell, GA | 1,230 | 0.44 | 2.14 | $ 40.64 | $ 84,520 |
| San Francisco-Oakland-Hayward, CA | 720 | 0.30 | 1.46 | $ 38.46 | $ 80,000 |
| Louisville/Jefferson County, KY-IN | 460 | 0.69 | 3.40 | $ 38.12 | $ 79,280 |
| Columbia, SC | 30 | 0.08 | 0.40 | $ 36.67 | $ 76,270 |
| Washington-Arlington-Alexandria, DC-VA-MD-WV | 3,130 | 1.01 | 4.98 | $ 34.39 | $ 71,540 |
| Los Angeles-Long Beach-Anaheim, CA | 1,210 | 0.20 | 0.96 | $ 32.41 | $ 67,400 |
| Chicago-Naperville-Elgin, IL-IN-WI | 300 | 0.07 | 0.33 | $ 32.29 | $ 67,160 |
| Santa Maria-Santa Barbara, CA | 30 | 0.17 | 0.81 | $ 32.27 | $ 67,120 |
| New York-Newark-Jersey City, NY-NJ-PA | 3,080 | 0.32 | 1.59 | $ 32.22 | $ 67,010 |
| Baltimore-Columbia-Towson, MD | 220 | 0.17 | 0.84 | $ 31.79 | $ 66,130 |
Nonmetropolitan areas with the highest employment in Social Science Research Assistants:
| Nonmetropolitan area | Employment (1) | Employment per thousand jobs | Location quotient (9) | Hourly mean wage | Annual mean wage (2) |
|---|---|---|---|---|---|
| Eastern Washington nonmetropolitan area | 80 | 0.79 | 3.88 | $ 23.04 | $ 47,910 |
| Central Kentucky nonmetropolitan area | 60 | 0.32 | 1.59 | $ 24.05 | $ 50,030 |
| Southwest Maine nonmetropolitan area | 60 | 0.30 | 1.49 | $ 24.61 | $ 51,190 |
| Southwest Montana nonmetropolitan area | 40 | 0.28 | 1.39 | $ 21.24 | $ 44,170 |
Nonmetropolitan areas with the highest concentration of jobs and location quotients in Social Science Research Assistants:
| Nonmetropolitan area | Employment (1) | Employment per thousand jobs | Location quotient (9) | Hourly mean wage | Annual mean wage (2) |
|---|---|---|---|---|---|
| Eastern Washington nonmetropolitan area | 80 | 0.79 | 3.88 | $ 23.04 | $ 47,910 |
| Central Kentucky nonmetropolitan area | 60 | 0.32 | 1.59 | $ 24.05 | $ 50,030 |
| Southwest Maine nonmetropolitan area | 60 | 0.30 | 1.49 | $ 24.61 | $ 51,190 |
| Southwest Montana nonmetropolitan area | 40 | 0.28 | 1.39 | $ 21.24 | $ 44,170 |
Top paying nonmetropolitan areas for Social Science Research Assistants:
| Nonmetropolitan area | Employment (1) | Employment per thousand jobs | Location quotient (9) | Hourly mean wage | Annual mean wage (2) |
|---|---|---|---|---|---|
| Southwest Maine nonmetropolitan area | 60 | 0.30 | 1.49 | $ 24.61 | $ 51,190 |
| Central Kentucky nonmetropolitan area | 60 | 0.32 | 1.59 | $ 24.05 | $ 50,030 |
| Eastern Washington nonmetropolitan area | 80 | 0.79 | 3.88 | $ 23.04 | $ 47,910 |
| Southwest Montana nonmetropolitan area | 40 | 0.28 | 1.39 | $ 21.24 | $ 44,170 |
These estimates are calculated with data collected from employers in all industry sectors, all metropolitan and nonmetropolitan areas, and all states and the District of Columbia. The top employment and wage figures are provided above. The complete list is available in the downloadable XLS files.
The percentile wage estimate is the value of a wage below which a certain percent of workers fall. The median wage is the 50th percentile wage estimate—50 percent of workers earn less than the median and 50 percent of workers earn more than the median. More about percentile wages.
(1) Estimates for detailed occupations do not sum to the totals because the totals include occupations not shown separately. Estimates do not include self-employed workers.
(2) Annual wages have been calculated by multiplying the hourly mean wage by a "year-round, full-time" hours figure of 2,080 hours; for those occupations where there is not an hourly wage published, the annual wage has been directly calculated from the reported survey data.
(3) The relative standard error (RSE) is a measure of the reliability of a survey statistic. The smaller the relative standard error, the more precise the estimate.
(9) The location quotient is the ratio of the area concentration of occupational employment to the national average concentration. A location quotient greater than one indicates the occupation has a higher share of employment than average, and a location quotient less than one indicates the occupation is less prevalent in the area than average.
Other OEWS estimates and related information:
May 2023 National Occupational Employment and Wage Estimates
May 2023 State Occupational Employment and Wage Estimates
May 2023 Metropolitan and Nonmetropolitan Area Occupational Employment and Wage Estimates
May 2023 National Industry-Specific Occupational Employment and Wage Estimates
Last Modified Date: April 3, 2024