
An official website of the United States government
An official website of the United States government
The .gov means it's official.
Federal government websites often end in .gov or .mil. Before sharing sensitive information,
make sure you're on a federal government site.
The site is secure.
The
https:// ensures that you are connecting to the official website and that any
information you provide is encrypted and transmitted securely.
Narrate or write news stories, reviews, or commentary for print, broadcast, or other communications media such as newspapers, magazines, radio, or television. May collect and analyze information through interview, investigation, or observation.
Employment estimate and mean wage estimates for News Analysts, Reporters, and Journalists:
| Employment (1) | Employment RSE (3) |
Mean hourly wage |
Mean annual wage (2) |
Wage RSE (3) |
|---|---|---|---|---|
| 45,020 | 2.2 % | $ 48.76 | $ 101,430 | 1.8 % |
Percentile wage estimates for News Analysts, Reporters, and Journalists:
| Percentile | 10% | 25% | 50% (Median) |
75% | 90% |
|---|---|---|---|---|---|
| Hourly Wage | $ 15.17 | $ 18.34 | $ 27.64 | $ 44.18 | $ 77.10 |
| Annual Wage (2) | $ 31,550 | $ 38,160 | $ 57,500 | $ 91,890 | $ 160,360 |
Industries with the highest published employment and wages for News Analysts, Reporters, and Journalists are provided. For a list of all industries with employment in News Analysts, Reporters, and Journalists, see the Create Customized Tables function.
Industries with the highest levels of employment in News Analysts, Reporters, and Journalists:
| Industry | Employment (1) | Percent of industry employment | Hourly mean wage | Annual mean wage (2) |
|---|---|---|---|---|
| Newspaper, Periodical, Book, and Directory Publishers | 17,310 | 5.92 | $ 26.97 | $ 56,090 |
| Media Streaming Distribution Services, Social Networks, and Other Media Networks and Content Providers | 12,910 | 5.54 | $ 53.87 | $ 112,060 |
| Radio and Television Broadcasting Stations | 10,660 | 8.74 | $ 47.66 | $ 99,130 |
| Motion Picture and Video Industries | 1,350 | 0.34 | (8) | (8) |
| Colleges, Universities, and Professional Schools | 510 | 0.02 | $ 29.33 | $ 61,010 |
Industries with the highest concentration of employment in News Analysts, Reporters, and Journalists:
| Industry | Employment (1) | Percent of industry employment | Hourly mean wage | Annual mean wage (2) |
|---|---|---|---|---|
| Radio and Television Broadcasting Stations | 10,660 | 8.74 | $ 47.66 | $ 99,130 |
| Newspaper, Periodical, Book, and Directory Publishers | 17,310 | 5.92 | $ 26.97 | $ 56,090 |
| Media Streaming Distribution Services, Social Networks, and Other Media Networks and Content Providers | 12,910 | 5.54 | $ 53.87 | $ 112,060 |
| Motion Picture and Video Industries | 1,350 | 0.34 | (8) | (8) |
| Web Search Portals, Libraries, Archives, and Other Information Services | 150 | 0.08 | $ 25.58 | $ 53,210 |
Top paying industries for News Analysts, Reporters, and Journalists:
| Industry | Employment (1) | Percent of industry employment | Hourly mean wage | Annual mean wage (2) |
|---|---|---|---|---|
| Media Streaming Distribution Services, Social Networks, and Other Media Networks and Content Providers | 12,910 | 5.54 | $ 53.87 | $ 112,060 |
| Scientific Research and Development Services | 160 | 0.02 | $ 50.50 | $ 105,050 |
| Radio and Television Broadcasting Stations | 10,660 | 8.74 | $ 47.66 | $ 99,130 |
| Civic and Social Organizations | 30 | 0.01 | $ 45.72 | $ 95,100 |
| Telecommunications | 380 | 0.06 | $ 44.69 | $ 92,960 |
States and areas with the highest published employment, location quotients, and wages for News Analysts, Reporters, and Journalists are provided. For a list of all areas with employment in News Analysts, Reporters, and Journalists, see the Create Customized Tables function.
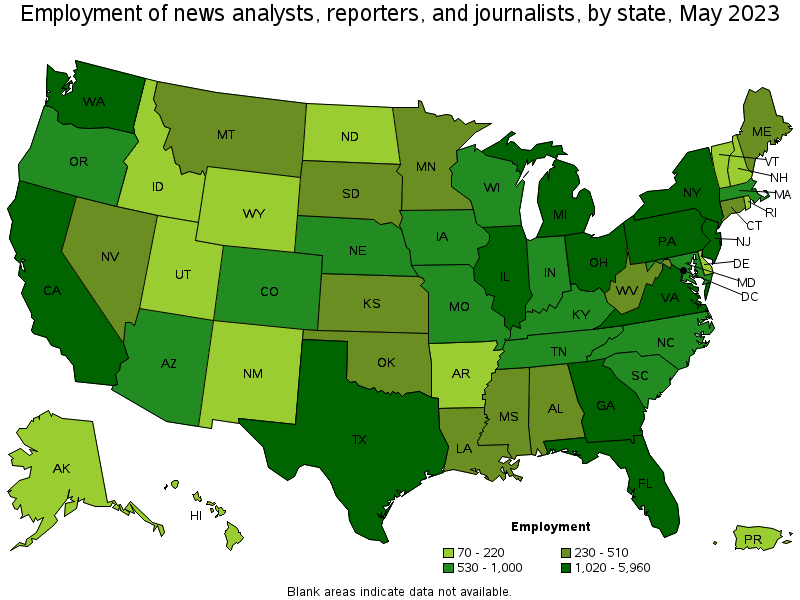
States with the highest employment level in News Analysts, Reporters, and Journalists:
| State | Employment (1) | Employment per thousand jobs | Location quotient (9) | Hourly mean wage | Annual mean wage (2) |
|---|---|---|---|---|---|
| New York | 5,960 | 0.63 | 2.14 | (8) | (8) |
| California | 4,920 | 0.27 | 0.93 | $ 62.77 | $ 130,570 |
| Florida | 3,100 | 0.32 | 1.09 | (8) | (8) |
| Texas | 2,580 | 0.19 | 0.64 | $ 31.70 | $ 65,930 |
| District of Columbia | 2,480 | 3.53 | 11.91 | $ 66.63 | $ 138,590 |
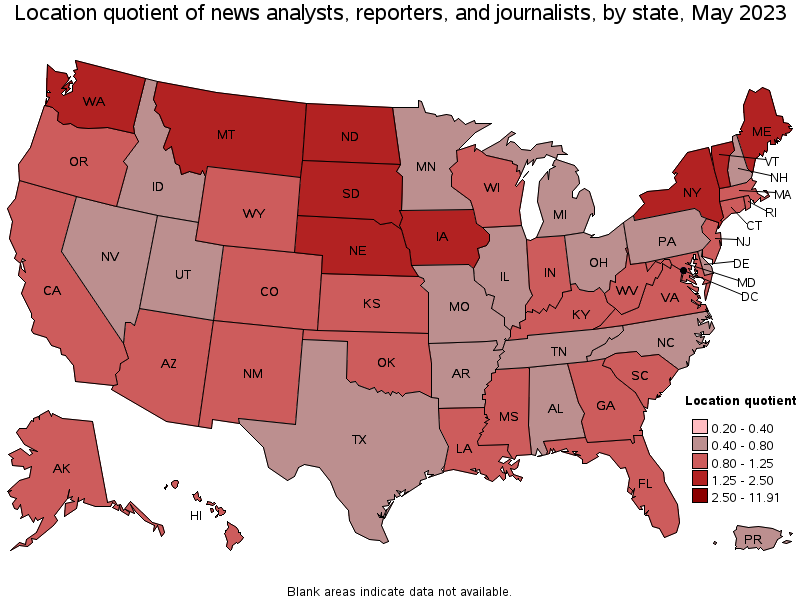
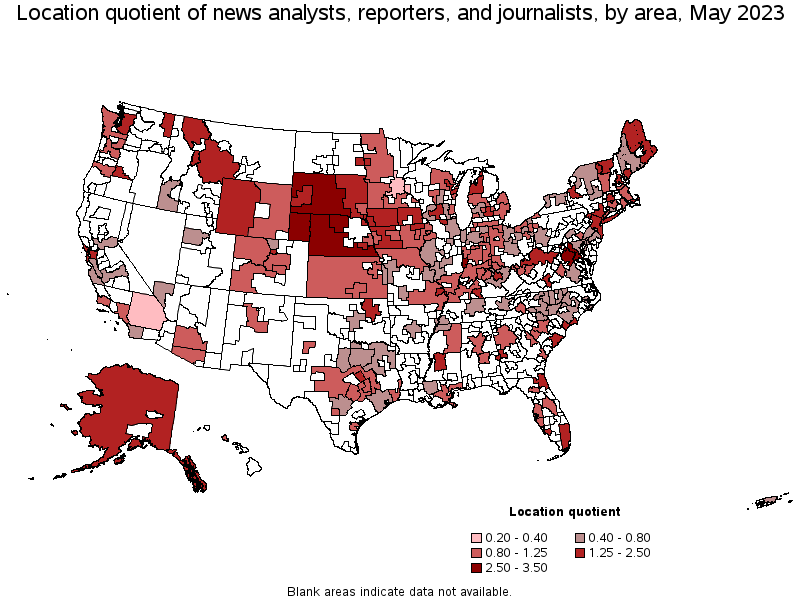
States with the highest concentration of jobs and location quotients in News Analysts, Reporters, and Journalists:
| State | Employment (1) | Employment per thousand jobs | Location quotient (9) | Hourly mean wage | Annual mean wage (2) |
|---|---|---|---|---|---|
| District of Columbia | 2,480 | 3.53 | 11.91 | $ 66.63 | $ 138,590 |
| New York | 5,960 | 0.63 | 2.14 | (8) | (8) |
| Montana | 320 | 0.63 | 2.13 | $ 23.94 | $ 49,800 |
| Nebraska | 570 | 0.57 | 1.93 | $ 23.26 | $ 48,380 |
| South Dakota | 230 | 0.51 | 1.71 | $ 19.81 | $ 41,190 |
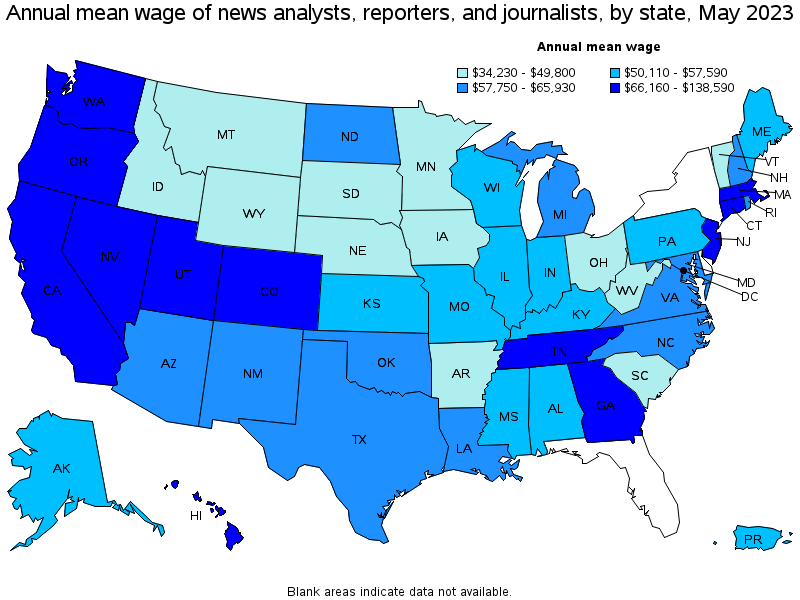
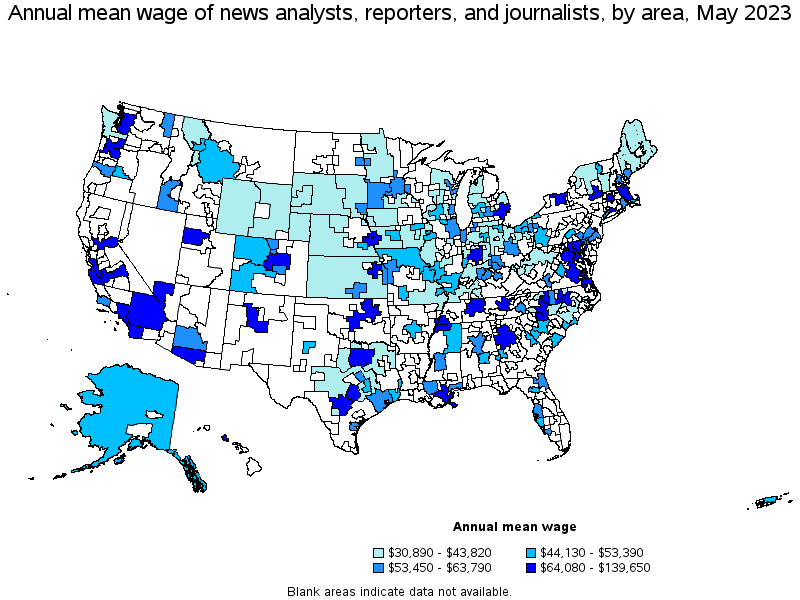
Top paying states for News Analysts, Reporters, and Journalists:
| State | Employment (1) | Employment per thousand jobs | Location quotient (9) | Hourly mean wage | Annual mean wage (2) |
|---|---|---|---|---|---|
| District of Columbia | 2,480 | 3.53 | 11.91 | $ 66.63 | $ 138,590 |
| California | 4,920 | 0.27 | 0.93 | $ 62.77 | $ 130,570 |
| Connecticut | 410 | 0.25 | 0.83 | $ 45.49 | $ 94,620 |
| Nevada | 300 | 0.20 | 0.68 | $ 40.71 | $ 84,670 |
| Georgia | 1,480 | 0.31 | 1.05 | $ 40.29 | $ 83,810 |
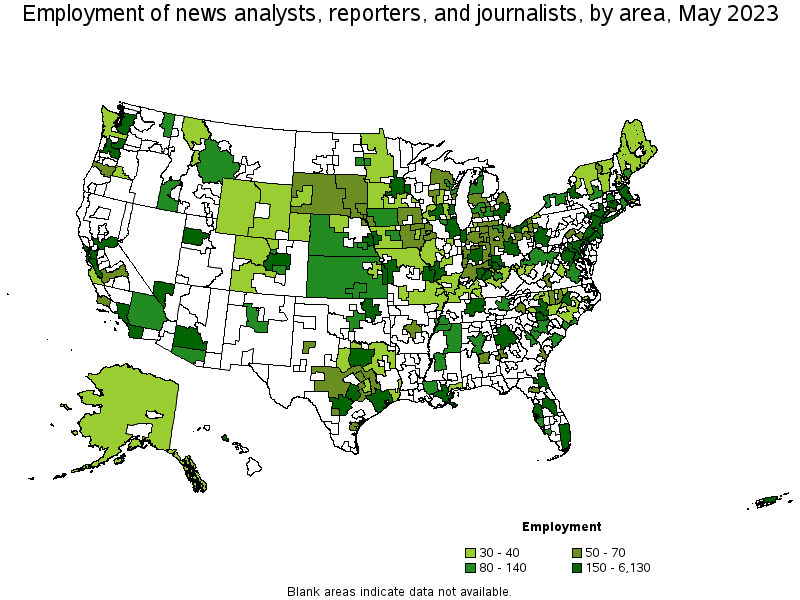
Metropolitan areas with the highest employment level in News Analysts, Reporters, and Journalists:
| Metropolitan area | Employment (1) | Employment per thousand jobs | Location quotient (9) | Hourly mean wage | Annual mean wage (2) |
|---|---|---|---|---|---|
| New York-Newark-Jersey City, NY-NJ-PA | 6,130 | 0.65 | 2.18 | (8) | (8) |
| Washington-Arlington-Alexandria, DC-VA-MD-WV | 2,970 | 0.96 | 3.24 | $ 60.78 | $ 126,420 |
| Los Angeles-Long Beach-Anaheim, CA | 2,220 | 0.36 | 1.21 | $ 67.14 | $ 139,650 |
| San Francisco-Oakland-Hayward, CA | 1,250 | 0.51 | 1.73 | (8) | (8) |
| Miami-Fort Lauderdale-West Palm Beach, FL | 1,210 | 0.45 | 1.50 | (8) | (8) |
| Seattle-Tacoma-Bellevue, WA | 1,050 | 0.50 | 1.70 | $ 41.34 | $ 85,980 |
| Atlanta-Sandy Springs-Roswell, GA | 1,030 | 0.37 | 1.24 | $ 44.48 | $ 92,510 |
| Chicago-Naperville-Elgin, IL-IN-WI | 910 | 0.20 | 0.68 | $ 27.51 | $ 57,220 |
| Boston-Cambridge-Nashua, MA-NH | 700 | 0.25 | 0.85 | $ 42.73 | $ 88,870 |
| Dallas-Fort Worth-Arlington, TX | 640 | 0.16 | 0.54 | $ 33.71 | $ 70,110 |
Metropolitan areas with the highest concentration of jobs and location quotients in News Analysts, Reporters, and Journalists:
| Metropolitan area | Employment (1) | Employment per thousand jobs | Location quotient (9) | Hourly mean wage | Annual mean wage (2) |
|---|---|---|---|---|---|
| Washington-Arlington-Alexandria, DC-VA-MD-WV | 2,970 | 0.96 | 3.24 | $ 60.78 | $ 126,420 |
| Terre Haute, IN | 50 | 0.84 | 2.85 | $ 21.84 | $ 45,420 |
| Lincoln, NE | 130 | 0.71 | 2.38 | $ 21.46 | $ 44,630 |
| Cape Girardeau, MO-IL | 30 | 0.68 | 2.29 | $ 23.50 | $ 48,870 |
| Fargo, ND-MN | 100 | 0.66 | 2.21 | $ 29.02 | $ 60,350 |
| Portland-South Portland, ME | 140 | 0.65 | 2.20 | $ 28.14 | $ 58,520 |
| New York-Newark-Jersey City, NY-NJ-PA | 6,130 | 0.65 | 2.18 | (8) | (8) |
| Boulder, CO | 120 | 0.62 | 2.10 | $ 28.05 | $ 58,350 |
| Sioux City, IA-NE-SD | 50 | 0.60 | 2.03 | $ 20.91 | $ 43,490 |
| Rockford, IL | 80 | 0.58 | 1.96 | $ 22.46 | $ 46,710 |
Top paying metropolitan areas for News Analysts, Reporters, and Journalists:
| Metropolitan area | Employment (1) | Employment per thousand jobs | Location quotient (9) | Hourly mean wage | Annual mean wage (2) |
|---|---|---|---|---|---|
| Los Angeles-Long Beach-Anaheim, CA | 2,220 | 0.36 | 1.21 | $ 67.14 | $ 139,650 |
| Washington-Arlington-Alexandria, DC-VA-MD-WV | 2,970 | 0.96 | 3.24 | $ 60.78 | $ 126,420 |
| Durham-Chapel Hill, NC | 50 | 0.14 | 0.47 | $ 55.77 | $ 116,000 |
| San Diego-Carlsbad, CA | 290 | 0.19 | 0.64 | $ 51.09 | $ 106,260 |
| Sacramento--Roseville--Arden-Arcade, CA | 180 | 0.18 | 0.59 | $ 50.59 | $ 105,220 |
| San Jose-Sunnyvale-Santa Clara, CA | 170 | 0.15 | 0.49 | $ 49.87 | $ 103,730 |
| Memphis, TN-MS-AR | 90 | 0.14 | 0.48 | $ 46.47 | $ 96,650 |
| Austin-Round Rock, TX | 390 | 0.32 | 1.07 | $ 44.63 | $ 92,820 |
| Atlanta-Sandy Springs-Roswell, GA | 1,030 | 0.37 | 1.24 | $ 44.48 | $ 92,510 |
| Rochester, NY | 90 | 0.18 | 0.60 | $ 43.13 | $ 89,700 |
Nonmetropolitan areas with the highest employment in News Analysts, Reporters, and Journalists:
| Nonmetropolitan area | Employment (1) | Employment per thousand jobs | Location quotient (9) | Hourly mean wage | Annual mean wage (2) |
|---|---|---|---|---|---|
| Kansas nonmetropolitan area | 140 | 0.36 | 1.23 | $ 17.68 | $ 36,780 |
| South Nebraska nonmetropolitan area | 130 | 0.90 | 3.05 | $ 20.38 | $ 42,390 |
| Southwest Montana nonmetropolitan area | 90 | 0.62 | 2.08 | $ 22.14 | $ 46,050 |
| Northwest Iowa nonmetropolitan area | 90 | 0.64 | 2.17 | $ 17.30 | $ 35,990 |
| Northwest Lower Peninsula of Michigan nonmetropolitan area | 80 | 0.65 | 2.19 | $ 21.07 | $ 43,820 |
Nonmetropolitan areas with the highest concentration of jobs and location quotients in News Analysts, Reporters, and Journalists:
| Nonmetropolitan area | Employment (1) | Employment per thousand jobs | Location quotient (9) | Hourly mean wage | Annual mean wage (2) |
|---|---|---|---|---|---|
| South Nebraska nonmetropolitan area | 130 | 0.90 | 3.05 | $ 20.38 | $ 42,390 |
| Northwest Nebraska nonmetropolitan area | 30 | 0.86 | 2.91 | $ 17.15 | $ 35,680 |
| West South Dakota nonmetropolitan area | 50 | 0.78 | 2.63 | $ 17.22 | $ 35,830 |
| Northwest Lower Peninsula of Michigan nonmetropolitan area | 80 | 0.65 | 2.19 | $ 21.07 | $ 43,820 |
| Northwest Iowa nonmetropolitan area | 90 | 0.64 | 2.17 | $ 17.30 | $ 35,990 |
Top paying nonmetropolitan areas for News Analysts, Reporters, and Journalists:
| Nonmetropolitan area | Employment (1) | Employment per thousand jobs | Location quotient (9) | Hourly mean wage | Annual mean wage (2) |
|---|---|---|---|---|---|
| Central New Hampshire nonmetropolitan area | 40 | 0.44 | 1.48 | $ 29.26 | $ 60,850 |
| Southwest Minnesota nonmetropolitan area | 40 | 0.34 | 1.15 | $ 28.37 | $ 59,010 |
| Northwest Colorado nonmetropolitan area | 30 | 0.27 | 0.91 | $ 25.49 | $ 53,030 |
| Alaska nonmetropolitan area | 40 | 0.41 | 1.37 | $ 24.35 | $ 50,650 |
| North Missouri nonmetropolitan area | 30 | 0.32 | 1.07 | $ 23.37 | $ 48,600 |
These estimates are calculated with data collected from employers in all industry sectors, all metropolitan and nonmetropolitan areas, and all states and the District of Columbia. The top employment and wage figures are provided above. The complete list is available in the downloadable XLS files.
The percentile wage estimate is the value of a wage below which a certain percent of workers fall. The median wage is the 50th percentile wage estimate—50 percent of workers earn less than the median and 50 percent of workers earn more than the median. More about percentile wages.
(1) Estimates for detailed occupations do not sum to the totals because the totals include occupations not shown separately. Estimates do not include self-employed workers.
(2) Annual wages have been calculated by multiplying the hourly mean wage by a "year-round, full-time" hours figure of 2,080 hours; for those occupations where there is not an hourly wage published, the annual wage has been directly calculated from the reported survey data.
(3) The relative standard error (RSE) is a measure of the reliability of a survey statistic. The smaller the relative standard error, the more precise the estimate.
(8) Estimate not released.
(9) The location quotient is the ratio of the area concentration of occupational employment to the national average concentration. A location quotient greater than one indicates the occupation has a higher share of employment than average, and a location quotient less than one indicates the occupation is less prevalent in the area than average.
Other OEWS estimates and related information:
May 2023 National Occupational Employment and Wage Estimates
May 2023 State Occupational Employment and Wage Estimates
May 2023 Metropolitan and Nonmetropolitan Area Occupational Employment and Wage Estimates
May 2023 National Industry-Specific Occupational Employment and Wage Estimates
Last Modified Date: April 3, 2024