
An official website of the United States government
An official website of the United States government
The .gov means it's official.
Federal government websites often end in .gov or .mil. Before sharing sensitive information,
make sure you're on a federal government site.
The site is secure.
The
https:// ensures that you are connecting to the official website and that any
information you provide is encrypted and transmitted securely.
Assist in operations, under the supervision of surgeons. May, in accordance with state laws, help surgeons to make incisions and close surgical sites, manipulate or remove tissues, implant surgical devices or drains, suction the surgical site, place catheters, clamp or cauterize vessels or tissue, and apply dressings to surgical site. Excludes �Registered Nurses� (29-1141) and �Surgical Technologists� (29-2055).
Employment estimate and mean wage estimates for Surgical Assistants:
| Employment (1) | Employment RSE (3) |
Mean hourly wage |
Mean annual wage (2) |
Wage RSE (3) |
|---|---|---|---|---|
| 18,780 | 6.0 % | $ 31.34 | $ 65,190 | 1.3 % |
Percentile wage estimates for Surgical Assistants:
| Percentile | 10% | 25% | 50% (Median) |
75% | 90% |
|---|---|---|---|---|---|
| Hourly Wage | $ 17.89 | $ 21.68 | $ 28.44 | $ 38.07 | $ 48.64 |
| Annual Wage (2) | $ 37,210 | $ 45,100 | $ 59,160 | $ 79,190 | $ 101,180 |
Industries with the highest published employment and wages for Surgical Assistants are provided. For a list of all industries with employment in Surgical Assistants, see the Create Customized Tables function.
Industries with the highest levels of employment in Surgical Assistants:
| Industry | Employment (1) | Percent of industry employment | Hourly mean wage | Annual mean wage (2) |
|---|---|---|---|---|
| General Medical and Surgical Hospitals | 8,480 | 0.15 | $ 32.83 | $ 68,290 |
| Offices of Dentists | 5,360 | 0.52 | $ 24.57 | $ 51,100 |
| Offices of Physicians | 2,850 | 0.10 | $ 36.40 | $ 75,710 |
| Outpatient Care Centers | 1,090 | 0.10 | $ 32.43 | $ 67,450 |
| Employment Services | 320 | 0.01 | (8) | (8) |
Industries with the highest concentration of employment in Surgical Assistants:
| Industry | Employment (1) | Percent of industry employment | Hourly mean wage | Annual mean wage (2) |
|---|---|---|---|---|
| Offices of Dentists | 5,360 | 0.52 | $ 24.57 | $ 51,100 |
| General Medical and Surgical Hospitals | 8,480 | 0.15 | $ 32.83 | $ 68,290 |
| Outpatient Care Centers | 1,090 | 0.10 | $ 32.43 | $ 67,450 |
| Offices of Physicians | 2,850 | 0.10 | $ 36.40 | $ 75,710 |
| Specialty (except Psychiatric and Substance Abuse) Hospitals | 150 | 0.05 | $ 25.46 | $ 52,950 |
Top paying industries for Surgical Assistants:
| Industry | Employment (1) | Percent of industry employment | Hourly mean wage | Annual mean wage (2) |
|---|---|---|---|---|
| Other Ambulatory Health Care Services | (8) | (8) | $ 48.70 | $ 101,290 |
| Offices of Physicians | 2,850 | 0.10 | $ 36.40 | $ 75,710 |
| General Medical and Surgical Hospitals | 8,480 | 0.15 | $ 32.83 | $ 68,290 |
| Outpatient Care Centers | 1,090 | 0.10 | $ 32.43 | $ 67,450 |
| Colleges, Universities, and Professional Schools | 60 | (7) | $ 29.77 | $ 61,920 |
States and areas with the highest published employment, location quotients, and wages for Surgical Assistants are provided. For a list of all areas with employment in Surgical Assistants, see the Create Customized Tables function.
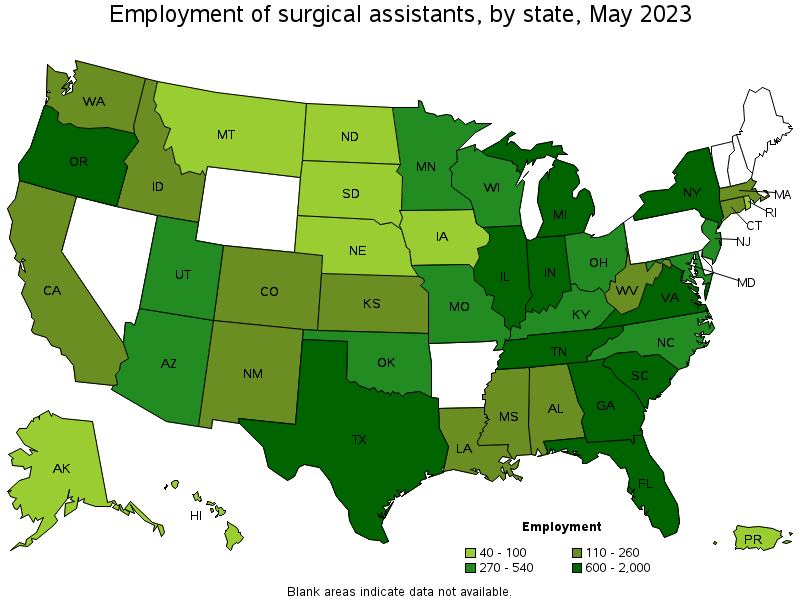
States with the highest employment level in Surgical Assistants:
| State | Employment (1) | Employment per thousand jobs | Location quotient (9) | Hourly mean wage | Annual mean wage (2) |
|---|---|---|---|---|---|
| Texas | 2,000 | 0.15 | 1.19 | $ 34.39 | $ 71,520 |
| Georgia | 1,390 | 0.29 | 2.37 | $ 23.08 | $ 48,000 |
| Illinois | 1,120 | 0.19 | 1.51 | $ 31.32 | $ 65,150 |
| Tennessee | 1,060 | 0.33 | 2.67 | $ 34.02 | $ 70,750 |
| Florida | 1,050 | 0.11 | 0.88 | $ 34.74 | $ 72,250 |
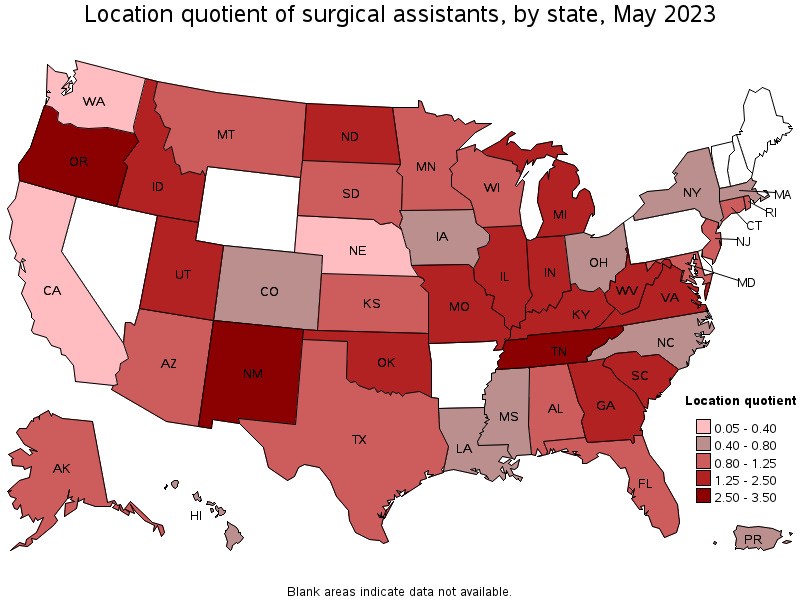
States with the highest concentration of jobs and location quotients in Surgical Assistants:
| State | Employment (1) | Employment per thousand jobs | Location quotient (9) | Hourly mean wage | Annual mean wage (2) |
|---|---|---|---|---|---|
| Tennessee | 1,060 | 0.33 | 2.67 | $ 34.02 | $ 70,750 |
| Oregon | 610 | 0.31 | 2.52 | $ 34.81 | $ 72,410 |
| New Mexico | 260 | 0.31 | 2.51 | (8) | (8) |
| South Carolina | 650 | 0.29 | 2.38 | $ 39.06 | $ 81,250 |
| Georgia | 1,390 | 0.29 | 2.37 | $ 23.08 | $ 48,000 |
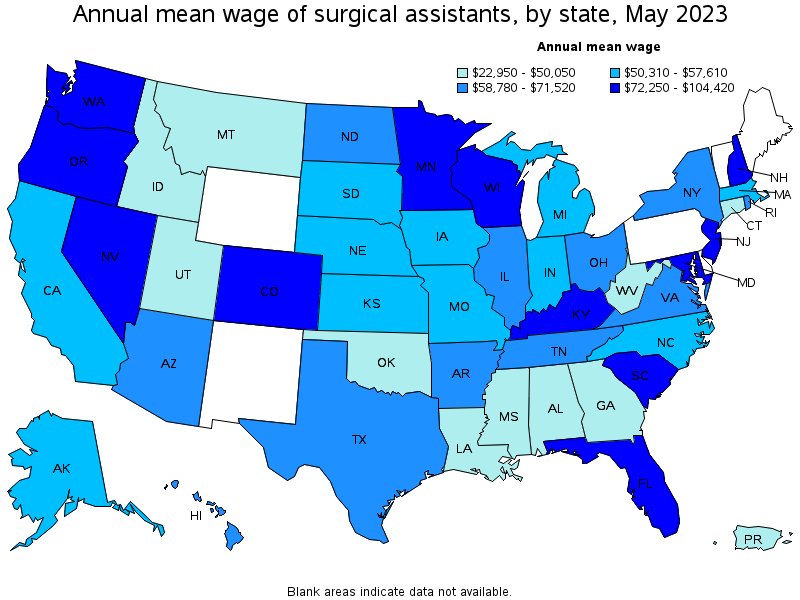
Top paying states for Surgical Assistants:
| State | Employment (1) | Employment per thousand jobs | Location quotient (9) | Hourly mean wage | Annual mean wage (2) |
|---|---|---|---|---|---|
| Minnesota | 390 | 0.14 | 1.11 | $ 50.20 | $ 104,420 |
| Maryland | 270 | 0.10 | 0.82 | $ 44.62 | $ 92,810 |
| Colorado | 200 | 0.07 | 0.57 | $ 43.58 | $ 90,640 |
| New Jersey | 420 | 0.10 | 0.81 | $ 40.40 | $ 84,030 |
| South Carolina | 650 | 0.29 | 2.38 | $ 39.06 | $ 81,250 |
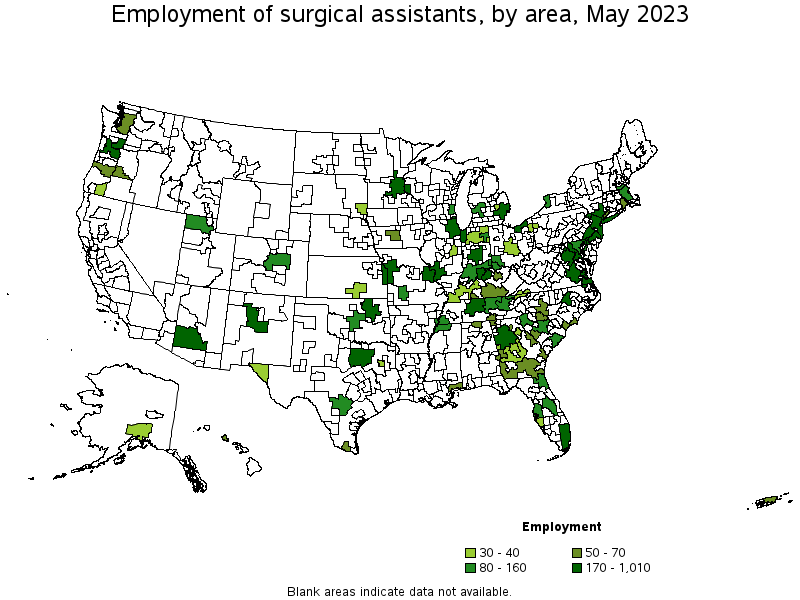
Metropolitan areas with the highest employment level in Surgical Assistants:
| Metropolitan area | Employment (1) | Employment per thousand jobs | Location quotient (9) | Hourly mean wage | Annual mean wage (2) |
|---|---|---|---|---|---|
| Chicago-Naperville-Elgin, IL-IN-WI | 1,010 | 0.22 | 1.81 | $ 31.32 | $ 65,140 |
| Atlanta-Sandy Springs-Roswell, GA | 770 | 0.27 | 2.21 | $ 24.71 | $ 51,390 |
| New York-Newark-Jersey City, NY-NJ-PA | 730 | 0.08 | 0.62 | $ 37.69 | $ 78,400 |
| Dallas-Fort Worth-Arlington, TX | 490 | 0.12 | 1.01 | $ 37.33 | $ 77,650 |
| Detroit-Warren-Dearborn, MI | 490 | 0.26 | 2.10 | $ 24.12 | $ 50,170 |
| Nashville-Davidson--Murfreesboro--Franklin, TN | 490 | 0.46 | 3.68 | $ 39.75 | $ 82,690 |
| Portland-Vancouver-Hillsboro, OR-WA | 370 | 0.31 | 2.51 | $ 32.69 | $ 68,000 |
| Miami-Fort Lauderdale-West Palm Beach, FL | 330 | 0.12 | 0.99 | $ 27.59 | $ 57,380 |
| Washington-Arlington-Alexandria, DC-VA-MD-WV | 330 | 0.11 | 0.85 | $ 42.29 | $ 87,960 |
| Indianapolis-Carmel-Anderson, IN | 270 | 0.25 | 2.00 | $ 30.46 | $ 63,370 |
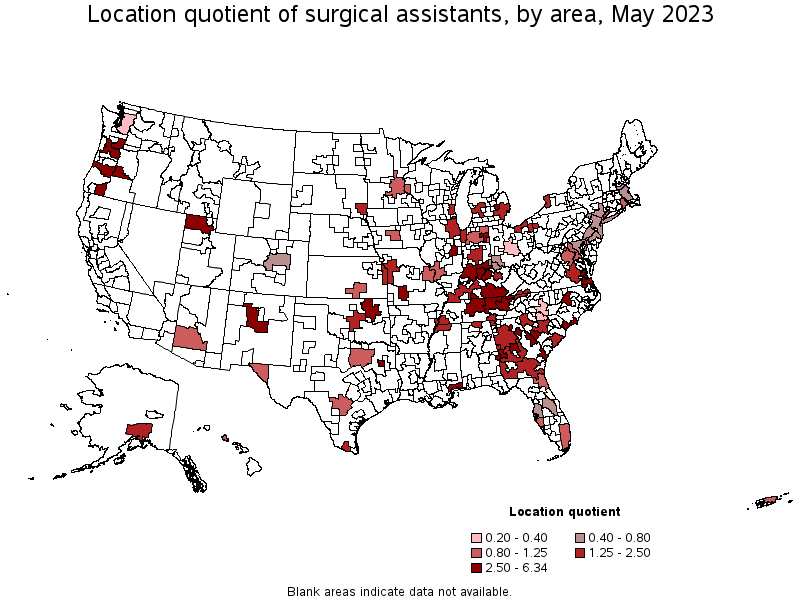
Metropolitan areas with the highest concentration of jobs and location quotients in Surgical Assistants:
| Metropolitan area | Employment (1) | Employment per thousand jobs | Location quotient (9) | Hourly mean wage | Annual mean wage (2) |
|---|---|---|---|---|---|
| Bend-Redmond, OR | 70 | 0.78 | 6.34 | $ 41.66 | $ 86,650 |
| Gainesville, GA | 60 | 0.66 | 5.31 | $ 21.11 | $ 43,900 |
| Albuquerque, NM | 220 | 0.54 | 4.41 | (8) | (8) |
| Columbus, GA-AL | 60 | 0.51 | 4.14 | $ 20.75 | $ 43,150 |
| Ogden-Clearfield, UT | 140 | 0.49 | 3.95 | $ 21.20 | $ 44,090 |
| Tulsa, OK | 210 | 0.48 | 3.84 | $ 19.32 | $ 40,180 |
| Gulfport-Biloxi-Pascagoula, MS | 70 | 0.46 | 3.70 | $ 21.42 | $ 44,550 |
| Nashville-Davidson--Murfreesboro--Franklin, TN | 490 | 0.46 | 3.68 | $ 39.75 | $ 82,690 |
| Macon, GA | 40 | 0.44 | 3.58 | $ 22.61 | $ 47,040 |
| Athens-Clarke County, GA | 40 | 0.43 | 3.50 | $ 27.75 | $ 57,720 |
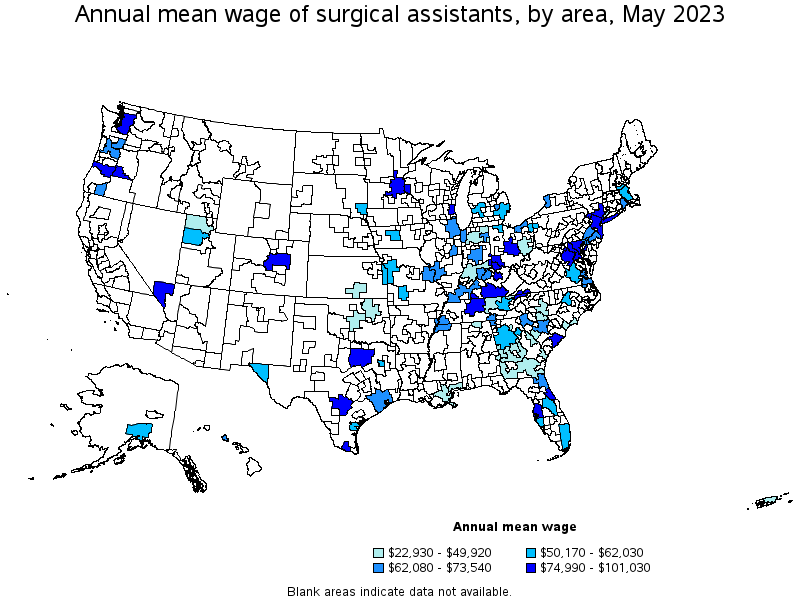
Top paying metropolitan areas for Surgical Assistants:
| Metropolitan area | Employment (1) | Employment per thousand jobs | Location quotient (9) | Hourly mean wage | Annual mean wage (2) |
|---|---|---|---|---|---|
| Charleston-North Charleston, SC | 90 | 0.24 | 1.90 | $ 47.61 | $ 99,030 |
| Deltona-Daytona Beach-Ormond Beach, FL | (8) | (8) | (8) | $ 46.69 | $ 97,120 |
| Denver-Aurora-Lakewood, CO | 110 | 0.07 | 0.54 | $ 44.72 | $ 93,020 |
| Minneapolis-St. Paul-Bloomington, MN-WI | 220 | 0.12 | 0.93 | $ 44.58 | $ 92,720 |
| Baltimore-Columbia-Towson, MD | 120 | 0.09 | 0.73 | $ 44.45 | $ 92,450 |
| Lexington-Fayette, KY | 50 | 0.17 | 1.34 | $ 44.05 | $ 91,630 |
| Cincinnati, OH-KY-IN | 80 | 0.08 | 0.62 | $ 43.97 | $ 91,460 |
| Washington-Arlington-Alexandria, DC-VA-MD-WV | 330 | 0.11 | 0.85 | $ 42.29 | $ 87,960 |
| Bend-Redmond, OR | 70 | 0.78 | 6.34 | $ 41.66 | $ 86,650 |
| Eugene, OR | 50 | 0.31 | 2.53 | $ 41.56 | $ 86,440 |
Nonmetropolitan areas with the highest employment in Surgical Assistants:
| Nonmetropolitan area | Employment (1) | Employment per thousand jobs | Location quotient (9) | Hourly mean wage | Annual mean wage (2) |
|---|---|---|---|---|---|
| North Central Tennessee nonmetropolitan area | 80 | 0.71 | 5.75 | $ 23.54 | $ 48,950 |
| Southern Indiana nonmetropolitan area | 80 | 0.41 | 3.32 | $ 19.30 | $ 40,140 |
| South Georgia nonmetropolitan area | 60 | 0.29 | 2.35 | $ 20.23 | $ 42,090 |
| South Central Kentucky nonmetropolitan area | 60 | 0.32 | 2.62 | $ 48.57 | $ 101,030 |
| Middle Georgia nonmetropolitan area | 40 | 0.29 | 2.35 | $ 19.34 | $ 40,220 |
Nonmetropolitan areas with the highest concentration of jobs and location quotients in Surgical Assistants:
| Nonmetropolitan area | Employment (1) | Employment per thousand jobs | Location quotient (9) | Hourly mean wage | Annual mean wage (2) |
|---|---|---|---|---|---|
| North Central Tennessee nonmetropolitan area | 80 | 0.71 | 5.75 | $ 23.54 | $ 48,950 |
| Southern Indiana nonmetropolitan area | 80 | 0.41 | 3.32 | $ 19.30 | $ 40,140 |
| South Central Kentucky nonmetropolitan area | 60 | 0.32 | 2.62 | $ 48.57 | $ 101,030 |
| Middle Georgia nonmetropolitan area | 40 | 0.29 | 2.35 | $ 19.34 | $ 40,220 |
| South Georgia nonmetropolitan area | 60 | 0.29 | 2.35 | $ 20.23 | $ 42,090 |
Top paying nonmetropolitan areas for Surgical Assistants:
| Nonmetropolitan area | Employment (1) | Employment per thousand jobs | Location quotient (9) | Hourly mean wage | Annual mean wage (2) |
|---|---|---|---|---|---|
| South Central Kentucky nonmetropolitan area | 60 | 0.32 | 2.62 | $ 48.57 | $ 101,030 |
| West Kentucky nonmetropolitan area | 40 | 0.24 | 1.93 | $ 33.88 | $ 70,460 |
| North Central Tennessee nonmetropolitan area | 80 | 0.71 | 5.75 | $ 23.54 | $ 48,950 |
| Northern Indiana nonmetropolitan area | 30 | 0.15 | 1.24 | $ 23.35 | $ 48,570 |
| Eastern Ohio nonmetropolitan area | (8) | (8) | (8) | $ 22.71 | $ 47,230 |
These estimates are calculated with data collected from employers in all industry sectors, all metropolitan and nonmetropolitan areas, and all states and the District of Columbia. The top employment and wage figures are provided above. The complete list is available in the downloadable XLS files.
The percentile wage estimate is the value of a wage below which a certain percent of workers fall. The median wage is the 50th percentile wage estimate—50 percent of workers earn less than the median and 50 percent of workers earn more than the median. More about percentile wages.
(1) Estimates for detailed occupations do not sum to the totals because the totals include occupations not shown separately. Estimates do not include self-employed workers.
(2) Annual wages have been calculated by multiplying the hourly mean wage by a "year-round, full-time" hours figure of 2,080 hours; for those occupations where there is not an hourly wage published, the annual wage has been directly calculated from the reported survey data.
(3) The relative standard error (RSE) is a measure of the reliability of a survey statistic. The smaller the relative standard error, the more precise the estimate.
(7) The value is less than .005 percent of industry employment.
(8) Estimate not released.
(9) The location quotient is the ratio of the area concentration of occupational employment to the national average concentration. A location quotient greater than one indicates the occupation has a higher share of employment than average, and a location quotient less than one indicates the occupation is less prevalent in the area than average.
Other OEWS estimates and related information:
May 2023 National Occupational Employment and Wage Estimates
May 2023 State Occupational Employment and Wage Estimates
May 2023 Metropolitan and Nonmetropolitan Area Occupational Employment and Wage Estimates
May 2023 National Industry-Specific Occupational Employment and Wage Estimates
Last Modified Date: April 3, 2024