
An official website of the United States government
An official website of the United States government
The .gov means it's official.
Federal government websites often end in .gov or .mil. Before sharing sensitive information,
make sure you're on a federal government site.
The site is secure.
The
https:// ensures that you are connecting to the official website and that any
information you provide is encrypted and transmitted securely.
Maintain order among students on a school bus. Duties include helping students safely board and exit and communicating behavioral problems. May perform pretrip and posttrip inspections and prepare for and assist in emergency evacuations.
Employment estimate and mean wage estimates for School Bus Monitors:
| Employment (1) | Employment RSE (3) |
Mean hourly wage |
Mean annual wage (2) |
Wage RSE (3) |
|---|---|---|---|---|
| 72,320 | 1.4 % | $ 16.33 | $ 33,970 | 0.4 % |
Percentile wage estimates for School Bus Monitors:
| Percentile | 10% | 25% | 50% (Median) |
75% | 90% |
|---|---|---|---|---|---|
| Hourly Wage | $ 12.75 | $ 14.20 | $ 15.93 | $ 18.21 | $ 19.75 |
| Annual Wage (2) | $ 26,530 | $ 29,540 | $ 33,130 | $ 37,890 | $ 41,090 |
Industries with the highest published employment and wages for School Bus Monitors are provided. For a list of all industries with employment in School Bus Monitors, see the Create Customized Tables function.
Industries with the highest levels of employment in School Bus Monitors:
| Industry | Employment (1) | Percent of industry employment | Hourly mean wage | Annual mean wage (2) |
|---|---|---|---|---|
| Elementary and Secondary Schools | 32,150 | 0.37 | $ 15.81 | $ 32,890 |
| School and Employee Bus Transportation | 29,830 | 15.10 | $ 16.72 | $ 34,780 |
| Local Government, excluding Schools and Hospitals (OEWS Designation) | 5,550 | 0.10 | $ 17.39 | $ 36,170 |
| Other Transit and Ground Passenger Transportation | 1,370 | 1.39 | $ 15.66 | $ 32,570 |
| Educational Support Services | 1,140 | 0.45 | $ 17.24 | $ 35,860 |
Industries with the highest concentration of employment in School Bus Monitors:
| Industry | Employment (1) | Percent of industry employment | Hourly mean wage | Annual mean wage (2) |
|---|---|---|---|---|
| School and Employee Bus Transportation | 29,830 | 15.10 | $ 16.72 | $ 34,780 |
| Other Transit and Ground Passenger Transportation | 1,370 | 1.39 | $ 15.66 | $ 32,570 |
| Urban Transit Systems | 220 | 0.52 | $ 16.99 | $ 35,350 |
| Educational Support Services | 1,140 | 0.45 | $ 17.24 | $ 35,860 |
| Elementary and Secondary Schools | 32,150 | 0.37 | $ 15.81 | $ 32,890 |
Top paying industries for School Bus Monitors:
| Industry | Employment (1) | Percent of industry employment | Hourly mean wage | Annual mean wage (2) |
|---|---|---|---|---|
| State Government, excluding Schools and Hospitals (OEWS Designation) | 30 | (7) | $ 19.87 | $ 41,330 |
| Local Government, excluding Schools and Hospitals (OEWS Designation) | 5,550 | 0.10 | $ 17.39 | $ 36,170 |
| Educational Support Services | 1,140 | 0.45 | $ 17.24 | $ 35,860 |
| Urban Transit Systems | 220 | 0.52 | $ 16.99 | $ 35,350 |
| School and Employee Bus Transportation | 29,830 | 15.10 | $ 16.72 | $ 34,780 |
States and areas with the highest published employment, location quotients, and wages for School Bus Monitors are provided. For a list of all areas with employment in School Bus Monitors, see the Create Customized Tables function.
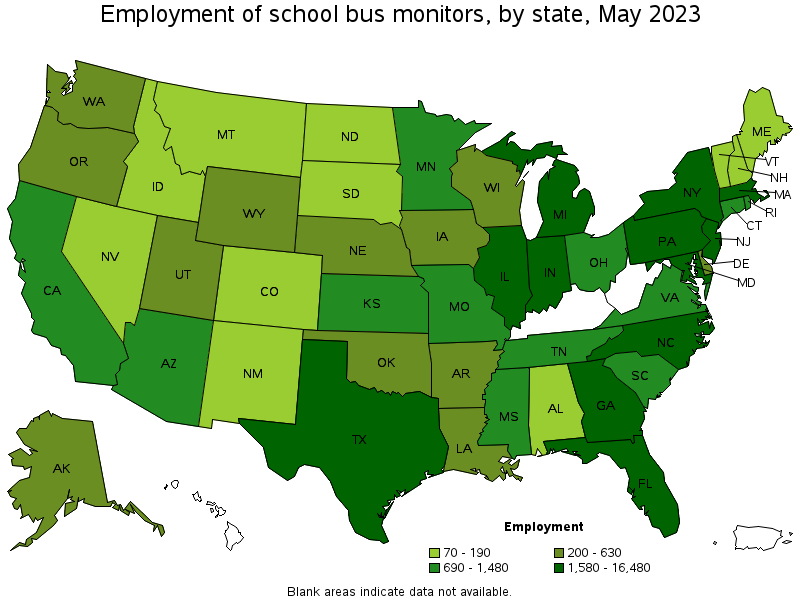
States with the highest employment level in School Bus Monitors:
| State | Employment (1) | Employment per thousand jobs | Location quotient (9) | Hourly mean wage | Annual mean wage (2) |
|---|---|---|---|---|---|
| New York | 16,480 | 1.75 | 3.68 | $ 17.84 | $ 37,110 |
| Texas | 7,030 | 0.52 | 1.09 | $ 14.54 | $ 30,250 |
| Illinois | 5,180 | 0.86 | 1.81 | $ 15.92 | $ 33,110 |
| New Jersey | 5,020 | 1.19 | 2.51 | $ 16.46 | $ 34,240 |
| Florida | 3,950 | 0.41 | 0.87 | $ 14.76 | $ 30,700 |
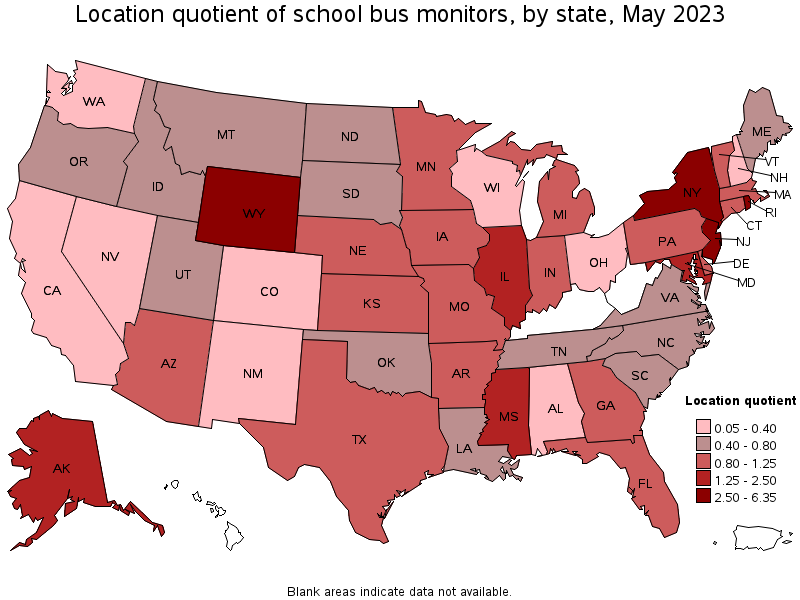
States with the highest concentration of jobs and location quotients in School Bus Monitors:
| State | Employment (1) | Employment per thousand jobs | Location quotient (9) | Hourly mean wage | Annual mean wage (2) |
|---|---|---|---|---|---|
| Rhode Island | 1,480 | 3.02 | 6.35 | $ 18.74 | $ 38,980 |
| New York | 16,480 | 1.75 | 3.68 | $ 17.84 | $ 37,110 |
| New Jersey | 5,020 | 1.19 | 2.51 | $ 16.46 | $ 34,240 |
| Wyoming | 330 | 1.19 | 2.51 | $ 17.04 | $ 35,440 |
| Maryland | 2,700 | 1.01 | 2.12 | $ 17.58 | $ 36,560 |
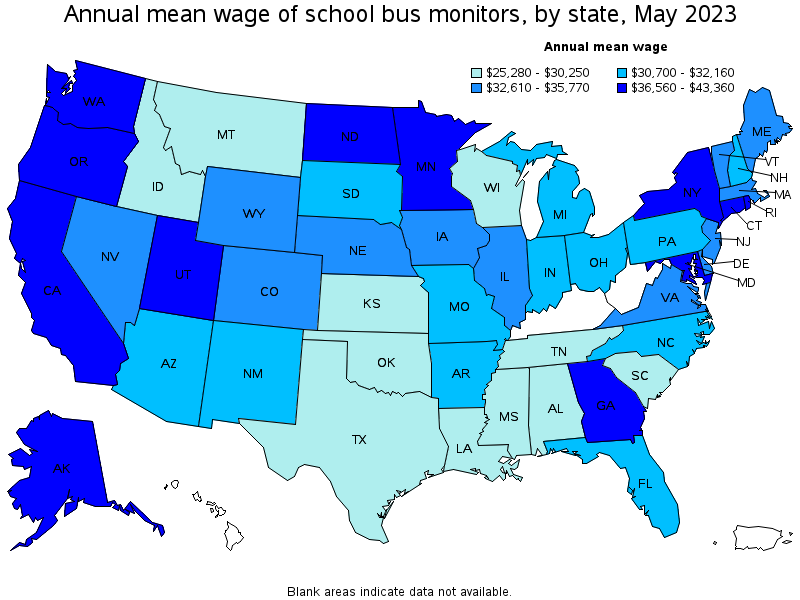
Top paying states for School Bus Monitors:
| State | Employment (1) | Employment per thousand jobs | Location quotient (9) | Hourly mean wage | Annual mean wage (2) |
|---|---|---|---|---|---|
| Connecticut | 800 | 0.48 | 1.01 | $ 20.85 | $ 43,360 |
| Washington | 380 | 0.11 | 0.23 | $ 20.01 | $ 41,620 |
| California | 1,420 | 0.08 | 0.17 | $ 19.01 | $ 39,530 |
| Utah | 630 | 0.37 | 0.79 | $ 18.95 | $ 39,420 |
| Rhode Island | 1,480 | 3.02 | 6.35 | $ 18.74 | $ 38,980 |
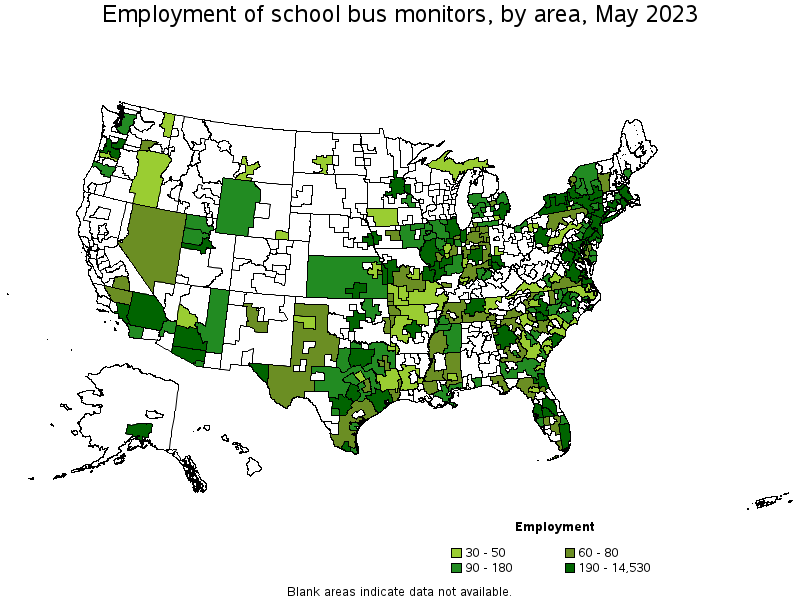
Metropolitan areas with the highest employment level in School Bus Monitors:
| Metropolitan area | Employment (1) | Employment per thousand jobs | Location quotient (9) | Hourly mean wage | Annual mean wage (2) |
|---|---|---|---|---|---|
| New York-Newark-Jersey City, NY-NJ-PA | 14,530 | 1.53 | 3.21 | $ 18.07 | $ 37,590 |
| Chicago-Naperville-Elgin, IL-IN-WI | 3,640 | 0.81 | 1.70 | $ 16.30 | $ 33,900 |
| Philadelphia-Camden-Wilmington, PA-NJ-DE-MD | 2,390 | 0.84 | 1.77 | $ 15.63 | $ 32,500 |
| Houston-The Woodlands-Sugar Land, TX | 1,940 | 0.61 | 1.28 | $ 14.74 | $ 30,650 |
| Washington-Arlington-Alexandria, DC-VA-MD-WV | 1,900 | 0.62 | 1.29 | $ 18.43 | $ 38,340 |
| Dallas-Fort Worth-Arlington, TX | 1,640 | 0.41 | 0.87 | $ 14.95 | $ 31,100 |
| Providence-Warwick, RI-MA | 1,520 | 2.67 | 5.60 | $ 18.63 | $ 38,740 |
| Buffalo-Cheektowaga-Niagara Falls, NY | 1,370 | 2.60 | 5.45 | $ 16.63 | $ 34,590 |
| Rochester, NY | 1,290 | 2.61 | 5.47 | $ 16.40 | $ 34,100 |
| Minneapolis-St. Paul-Bloomington, MN-WI | 1,140 | 0.60 | 1.25 | $ 18.07 | $ 37,580 |
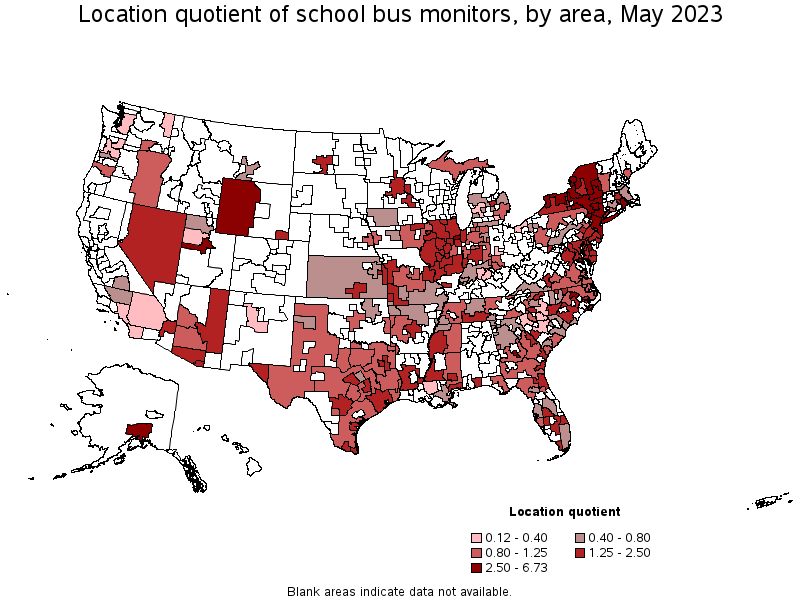
Metropolitan areas with the highest concentration of jobs and location quotients in School Bus Monitors:
| Metropolitan area | Employment (1) | Employment per thousand jobs | Location quotient (9) | Hourly mean wage | Annual mean wage (2) |
|---|---|---|---|---|---|
| Kingston, NY | 180 | 3.20 | 6.73 | $ 15.88 | $ 33,030 |
| Providence-Warwick, RI-MA | 1,520 | 2.67 | 5.60 | $ 18.63 | $ 38,740 |
| Rochester, NY | 1,290 | 2.61 | 5.47 | $ 16.40 | $ 34,100 |
| Buffalo-Cheektowaga-Niagara Falls, NY | 1,370 | 2.60 | 5.45 | $ 16.63 | $ 34,590 |
| Rocky Mount, NC | 110 | 2.04 | 4.28 | $ 16.15 | $ 33,600 |
| Watertown-Fort Drum, NY | 70 | 1.90 | 4.00 | $ 16.88 | $ 35,110 |
| Glens Falls, NY | 90 | 1.89 | 3.96 | $ 16.04 | $ 33,350 |
| Syracuse, NY | 540 | 1.84 | 3.86 | $ 17.39 | $ 36,170 |
| New York-Newark-Jersey City, NY-NJ-PA | 14,530 | 1.53 | 3.21 | $ 18.07 | $ 37,590 |
| Kankakee, IL | 60 | 1.48 | 3.10 | $ 15.15 | $ 31,510 |
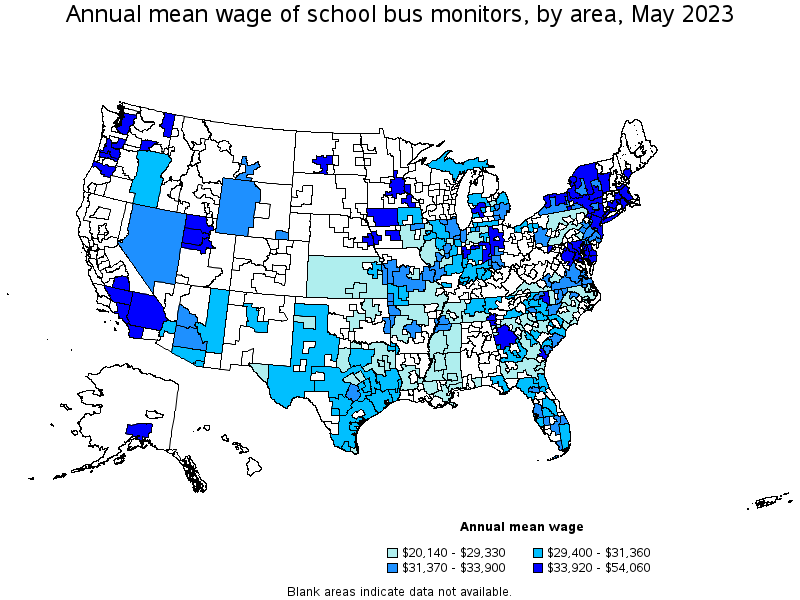
Top paying metropolitan areas for School Bus Monitors:
| Metropolitan area | Employment (1) | Employment per thousand jobs | Location quotient (9) | Hourly mean wage | Annual mean wage (2) |
|---|---|---|---|---|---|
| Bridgeport-Stamford-Norwalk, CT | 330 | 0.83 | 1.74 | $ 25.99 | $ 54,060 |
| Chattanooga, TN-GA | 60 | 0.22 | 0.47 | $ 23.00 | $ 47,830 |
| Seattle-Tacoma-Bellevue, WA | 160 | 0.08 | 0.17 | $ 21.81 | $ 45,370 |
| Provo-Orem, UT | 360 | 1.24 | 2.61 | $ 20.74 | $ 43,150 |
| Atlanta-Sandy Springs-Roswell, GA | 880 | 0.31 | 0.65 | $ 20.27 | $ 42,160 |
| Kennewick-Richland, WA | 60 | 0.50 | 1.04 | $ 19.26 | $ 40,050 |
| Los Angeles-Long Beach-Anaheim, CA | 360 | 0.06 | 0.12 | $ 19.11 | $ 39,740 |
| Portland-Vancouver-Hillsboro, OR-WA | 200 | 0.17 | 0.35 | $ 19.03 | $ 39,580 |
| Bakersfield, CA | 80 | 0.24 | 0.51 | $ 18.82 | $ 39,140 |
| Winston-Salem, NC | (8) | (8) | (8) | $ 18.69 | $ 38,880 |
Nonmetropolitan areas with the highest employment in School Bus Monitors:
| Nonmetropolitan area | Employment (1) | Employment per thousand jobs | Location quotient (9) | Hourly mean wage | Annual mean wage (2) |
|---|---|---|---|---|---|
| Central East New York nonmetropolitan area | 280 | 1.79 | 3.77 | $ 16.31 | $ 33,930 |
| West Central Illinois nonmetropolitan area | 190 | 1.15 | 2.42 | $ 13.81 | $ 28,720 |
| Southwest New York nonmetropolitan area | 190 | 1.10 | 2.30 | $ 15.85 | $ 32,970 |
| Southeast Coastal North Carolina nonmetropolitan area | 180 | 0.74 | 1.55 | $ 13.60 | $ 28,280 |
| Capital/Northern New York nonmetropolitan area | 180 | 1.28 | 2.68 | $ 16.87 | $ 35,090 |
Nonmetropolitan areas with the highest concentration of jobs and location quotients in School Bus Monitors:
| Nonmetropolitan area | Employment (1) | Employment per thousand jobs | Location quotient (9) | Hourly mean wage | Annual mean wage (2) |
|---|---|---|---|---|---|
| Central East New York nonmetropolitan area | 280 | 1.79 | 3.77 | $ 16.31 | $ 33,930 |
| Western Wyoming nonmetropolitan area | 130 | 1.29 | 2.70 | $ 15.76 | $ 32,770 |
| Capital/Northern New York nonmetropolitan area | 180 | 1.28 | 2.68 | $ 16.87 | $ 35,090 |
| West Central Illinois nonmetropolitan area | 190 | 1.15 | 2.42 | $ 13.81 | $ 28,720 |
| Southwest New York nonmetropolitan area | 190 | 1.10 | 2.30 | $ 15.85 | $ 32,970 |
Top paying nonmetropolitan areas for School Bus Monitors:
| Nonmetropolitan area | Employment (1) | Employment per thousand jobs | Location quotient (9) | Hourly mean wage | Annual mean wage (2) |
|---|---|---|---|---|---|
| Northwest Iowa nonmetropolitan area | 40 | 0.32 | 0.68 | $ 19.76 | $ 41,100 |
| Maryland nonmetropolitan area | 60 | 1.08 | 2.27 | $ 18.45 | $ 38,370 |
| Southern Vermont nonmetropolitan area | 60 | 0.57 | 1.20 | $ 17.45 | $ 36,300 |
| Central Indiana nonmetropolitan area | 80 | 0.53 | 1.12 | $ 17.32 | $ 36,030 |
| West Northwestern Ohio nonmetropolitan area | (8) | (8) | (8) | $ 17.11 | $ 35,580 |
These estimates are calculated with data collected from employers in all industry sectors, all metropolitan and nonmetropolitan areas, and all states and the District of Columbia. The top employment and wage figures are provided above. The complete list is available in the downloadable XLS files.
The percentile wage estimate is the value of a wage below which a certain percent of workers fall. The median wage is the 50th percentile wage estimate—50 percent of workers earn less than the median and 50 percent of workers earn more than the median. More about percentile wages.
(1) Estimates for detailed occupations do not sum to the totals because the totals include occupations not shown separately. Estimates do not include self-employed workers.
(2) Annual wages have been calculated by multiplying the hourly mean wage by a "year-round, full-time" hours figure of 2,080 hours; for those occupations where there is not an hourly wage published, the annual wage has been directly calculated from the reported survey data.
(3) The relative standard error (RSE) is a measure of the reliability of a survey statistic. The smaller the relative standard error, the more precise the estimate.
(7) The value is less than .005 percent of industry employment.
(8) Estimate not released.
(9) The location quotient is the ratio of the area concentration of occupational employment to the national average concentration. A location quotient greater than one indicates the occupation has a higher share of employment than average, and a location quotient less than one indicates the occupation is less prevalent in the area than average.
Other OEWS estimates and related information:
May 2023 National Occupational Employment and Wage Estimates
May 2023 State Occupational Employment and Wage Estimates
May 2023 Metropolitan and Nonmetropolitan Area Occupational Employment and Wage Estimates
May 2023 National Industry-Specific Occupational Employment and Wage Estimates
Last Modified Date: April 3, 2024