
An official website of the United States government
An official website of the United States government
The .gov means it's official.
Federal government websites often end in .gov or .mil. Before sharing sensitive information,
make sure you're on a federal government site.
The site is secure.
The
https:// ensures that you are connecting to the official website and that any
information you provide is encrypted and transmitted securely.
Diagnose, inspect, adjust, repair, or overhaul recreational vehicles including travel trailers. May specialize in maintaining gas, electrical, hydraulic, plumbing, or chassis/towing systems as well as repairing generators, appliances, and interior components. Includes workers who perform customized van conversions. Excludes �Automotive Service Technicians and Mechanics� (49-3023) and �Bus and Truck Mechanics and Diesel Engine Specialists� (49-3031) who also work on recreation vehicles.
Employment estimate and mean wage estimates for Recreational Vehicle Service Technicians:
| Employment (1) | Employment RSE (3) |
Mean hourly wage |
Mean annual wage (2) |
Wage RSE (3) |
|---|---|---|---|---|
| 17,360 | 5.2 % | $ 24.37 | $ 50,690 | 1.0 % |
Percentile wage estimates for Recreational Vehicle Service Technicians:
| Percentile | 10% | 25% | 50% (Median) |
75% | 90% |
|---|---|---|---|---|---|
| Hourly Wage | $ 16.18 | $ 18.60 | $ 23.05 | $ 28.94 | $ 34.85 |
| Annual Wage (2) | $ 33,660 | $ 38,690 | $ 47,950 | $ 60,200 | $ 72,500 |
Industries with the highest published employment and wages for Recreational Vehicle Service Technicians are provided. For a list of all industries with employment in Recreational Vehicle Service Technicians, see the Create Customized Tables function.
Industries with the highest levels of employment in Recreational Vehicle Service Technicians:
| Industry | Employment (1) | Percent of industry employment | Hourly mean wage | Annual mean wage (2) |
|---|---|---|---|---|
| Other Motor Vehicle Dealers | 12,080 | 6.88 | $ 24.07 | $ 50,060 |
| Automotive Repair and Maintenance | 1,840 | 0.18 | $ 24.33 | $ 50,600 |
| Automotive Equipment Rental and Leasing | 1,340 | 0.65 | $ 26.35 | $ 54,810 |
| Motor Vehicle Body and Trailer Manufacturing | 1,030 | 0.61 | $ 25.67 | $ 53,390 |
| Motor Vehicle and Motor Vehicle Parts and Supplies Merchant Wholesalers | 270 | 0.07 | $ 20.53 | $ 42,700 |
Industries with the highest concentration of employment in Recreational Vehicle Service Technicians:
| Industry | Employment (1) | Percent of industry employment | Hourly mean wage | Annual mean wage (2) |
|---|---|---|---|---|
| Other Motor Vehicle Dealers | 12,080 | 6.88 | $ 24.07 | $ 50,060 |
| Automotive Equipment Rental and Leasing | 1,340 | 0.65 | $ 26.35 | $ 54,810 |
| Motor Vehicle Body and Trailer Manufacturing | 1,030 | 0.61 | $ 25.67 | $ 53,390 |
| Automotive Repair and Maintenance | 1,840 | 0.18 | $ 24.33 | $ 50,600 |
| Personal and Household Goods Repair and Maintenance | 70 | 0.08 | $ 20.88 | $ 43,430 |
Top paying industries for Recreational Vehicle Service Technicians:
| Industry | Employment (1) | Percent of industry employment | Hourly mean wage | Annual mean wage (2) |
|---|---|---|---|---|
| Automotive Parts, Accessories, and Tire Retailers | (8) | (8) | $ 31.24 | $ 64,980 |
| Automotive Equipment Rental and Leasing | 1,340 | 0.65 | $ 26.35 | $ 54,810 |
| Other Miscellaneous Retailers | 50 | 0.01 | $ 25.78 | $ 53,620 |
| Motor Vehicle Body and Trailer Manufacturing | 1,030 | 0.61 | $ 25.67 | $ 53,390 |
| Automobile Dealers | 110 | 0.01 | $ 25.42 | $ 52,880 |
States and areas with the highest published employment, location quotients, and wages for Recreational Vehicle Service Technicians are provided. For a list of all areas with employment in Recreational Vehicle Service Technicians, see the Create Customized Tables function.
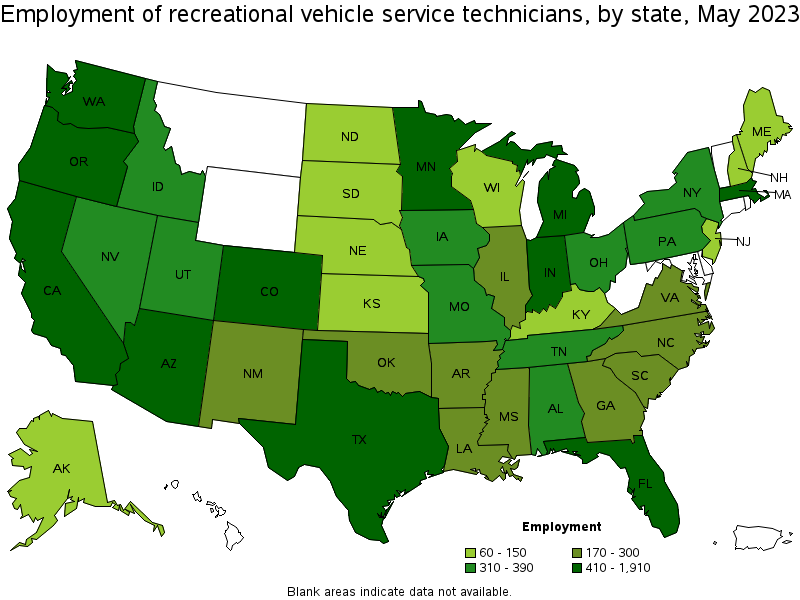
States with the highest employment level in Recreational Vehicle Service Technicians:
| State | Employment (1) | Employment per thousand jobs | Location quotient (9) | Hourly mean wage | Annual mean wage (2) |
|---|---|---|---|---|---|
| Florida | 1,910 | 0.20 | 1.75 | $ 23.84 | $ 49,590 |
| California | 1,510 | 0.08 | 0.74 | $ 27.36 | $ 56,900 |
| Indiana | 1,310 | 0.41 | 3.62 | $ 25.87 | $ 53,820 |
| Texas | 1,310 | 0.10 | 0.84 | $ 22.62 | $ 47,060 |
| Arizona | 1,230 | 0.39 | 3.44 | $ 24.68 | $ 51,330 |
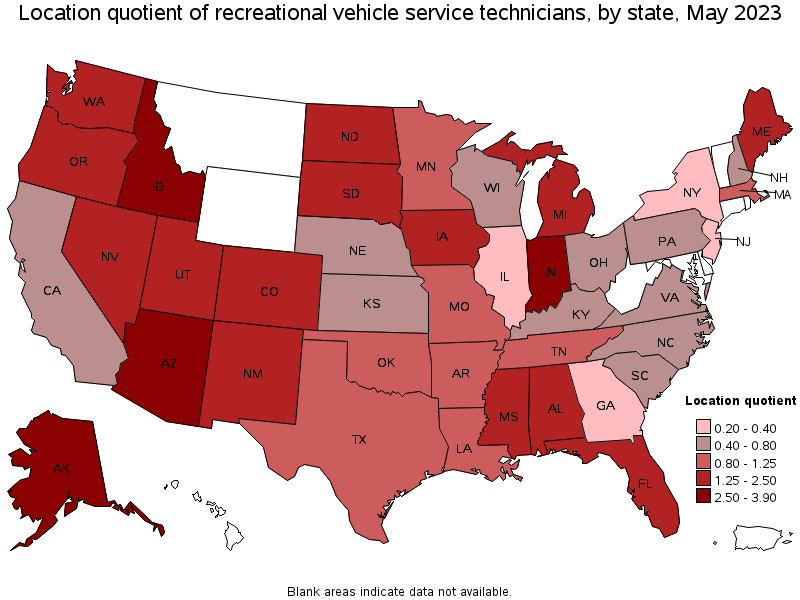
States with the highest concentration of jobs and location quotients in Recreational Vehicle Service Technicians:
| State | Employment (1) | Employment per thousand jobs | Location quotient (9) | Hourly mean wage | Annual mean wage (2) |
|---|---|---|---|---|---|
| Idaho | 370 | 0.45 | 3.90 | $ 25.70 | $ 53,450 |
| Indiana | 1,310 | 0.41 | 3.62 | $ 25.87 | $ 53,820 |
| Arizona | 1,230 | 0.39 | 3.44 | $ 24.68 | $ 51,330 |
| Alaska | 90 | 0.29 | 2.52 | $ 26.43 | $ 54,960 |
| North Dakota | 110 | 0.27 | 2.40 | $ 23.06 | $ 47,970 |
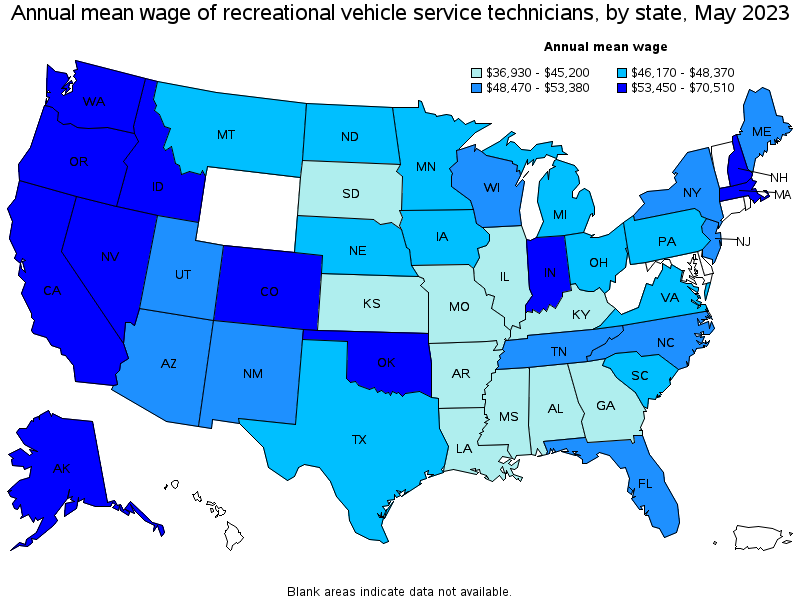
Top paying states for Recreational Vehicle Service Technicians:
| State | Employment (1) | Employment per thousand jobs | Location quotient (9) | Hourly mean wage | Annual mean wage (2) |
|---|---|---|---|---|---|
| Nevada | 310 | 0.21 | 1.83 | $ 33.90 | $ 70,510 |
| Colorado | 470 | 0.17 | 1.46 | $ 29.03 | $ 60,380 |
| New Hampshire | 60 | 0.09 | 0.79 | $ 28.43 | $ 59,140 |
| Washington | 580 | 0.17 | 1.45 | $ 27.82 | $ 57,860 |
| California | 1,510 | 0.08 | 0.74 | $ 27.36 | $ 56,900 |
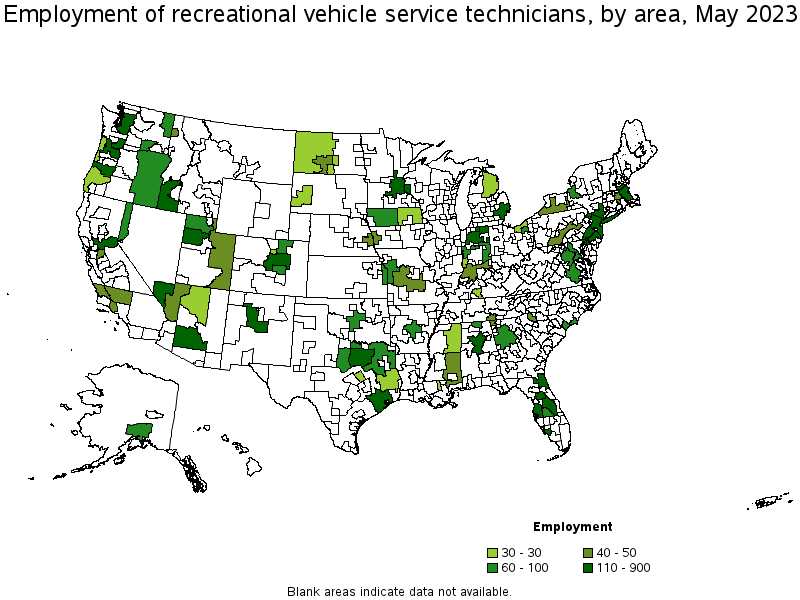
Metropolitan areas with the highest employment level in Recreational Vehicle Service Technicians:
| Metropolitan area | Employment (1) | Employment per thousand jobs | Location quotient (9) | Hourly mean wage | Annual mean wage (2) |
|---|---|---|---|---|---|
| Phoenix-Mesa-Scottsdale, AZ | 900 | 0.39 | 3.45 | $ 25.34 | $ 52,700 |
| Elkhart-Goshen, IN | 650 | 4.76 | 41.62 | $ 27.47 | $ 57,130 |
| Tampa-St. Petersburg-Clearwater, FL | 360 | 0.25 | 2.20 | $ 25.18 | $ 52,370 |
| Dallas-Fort Worth-Arlington, TX | 310 | 0.08 | 0.69 | $ 23.94 | $ 49,780 |
| Boston-Cambridge-Nashua, MA-NH | 310 | 0.11 | 0.97 | $ 27.82 | $ 57,860 |
| Jacksonville, FL | 300 | 0.41 | 3.57 | $ 23.67 | $ 49,240 |
| Seattle-Tacoma-Bellevue, WA | 270 | 0.13 | 1.12 | $ 28.16 | $ 58,570 |
| Detroit-Warren-Dearborn, MI | 230 | 0.12 | 1.06 | $ 23.63 | $ 49,140 |
| Houston-The Woodlands-Sugar Land, TX | 220 | 0.07 | 0.61 | $ 23.83 | $ 49,570 |
| Las Vegas-Henderson-Paradise, NV | 220 | 0.20 | 1.79 | $ 35.01 | $ 72,820 |
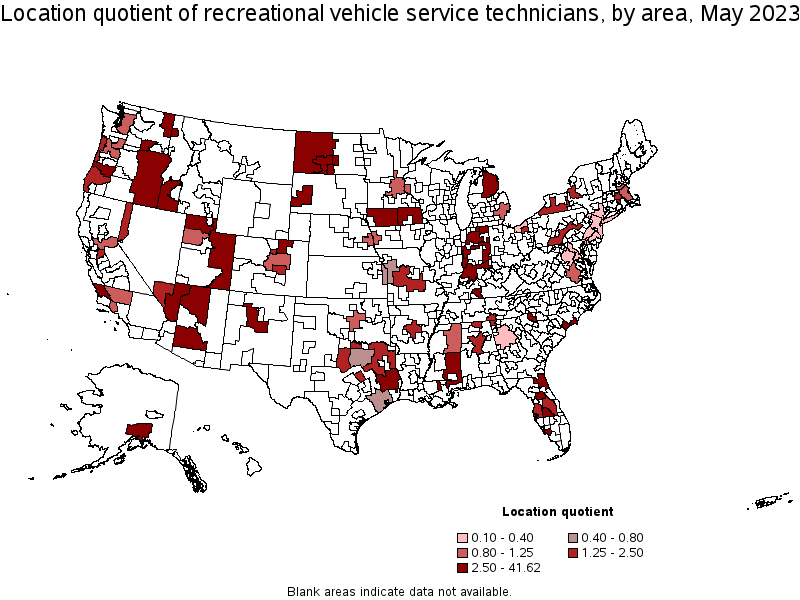
Metropolitan areas with the highest concentration of jobs and location quotients in Recreational Vehicle Service Technicians:
| Metropolitan area | Employment (1) | Employment per thousand jobs | Location quotient (9) | Hourly mean wage | Annual mean wage (2) |
|---|---|---|---|---|---|
| Elkhart-Goshen, IN | 650 | 4.76 | 41.62 | $ 27.47 | $ 57,130 |
| Ocala, FL | 140 | 1.19 | 10.38 | $ 24.23 | $ 50,390 |
| Eugene, OR | 130 | 0.85 | 7.46 | $ 26.79 | $ 55,730 |
| Lake Havasu City-Kingman, AZ | 40 | 0.79 | 6.87 | $ 22.46 | $ 46,710 |
| Hammond, LA | 30 | 0.74 | 6.45 | $ 24.70 | $ 51,380 |
| Coeur d'Alene, ID | 50 | 0.69 | 6.05 | $ 21.40 | $ 44,520 |
| Greeley, CO | 60 | 0.58 | 5.09 | $ 30.44 | $ 63,300 |
| Bismarck, ND | 40 | 0.53 | 4.64 | $ 22.05 | $ 45,870 |
| Boise City, ID | 190 | 0.52 | 4.57 | $ 28.12 | $ 58,500 |
| Kennewick-Richland, WA | 60 | 0.52 | 4.51 | $ 26.04 | $ 54,160 |
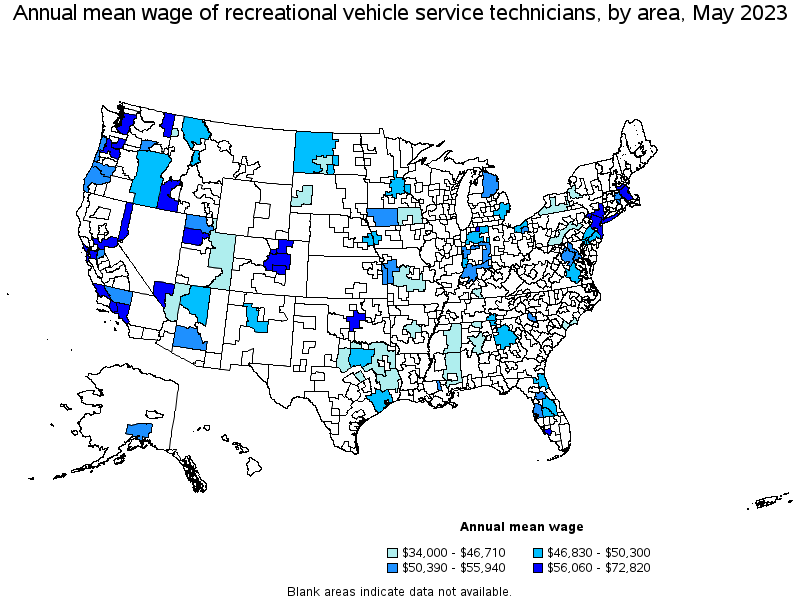
Top paying metropolitan areas for Recreational Vehicle Service Technicians:
| Metropolitan area | Employment (1) | Employment per thousand jobs | Location quotient (9) | Hourly mean wage | Annual mean wage (2) |
|---|---|---|---|---|---|
| Las Vegas-Henderson-Paradise, NV | 220 | 0.20 | 1.79 | $ 35.01 | $ 72,820 |
| Reno, NV | 60 | 0.24 | 2.08 | $ 32.54 | $ 67,690 |
| San Francisco-Oakland-Hayward, CA | (8) | (8) | (8) | $ 31.21 | $ 64,910 |
| Spokane-Spokane Valley, WA | 80 | 0.30 | 2.59 | $ 31.06 | $ 64,610 |
| Denver-Aurora-Lakewood, CO | 190 | 0.12 | 1.04 | $ 30.45 | $ 63,340 |
| Greeley, CO | 60 | 0.58 | 5.09 | $ 30.44 | $ 63,300 |
| San Luis Obispo-Paso Robles-Arroyo Grande, CA | 50 | 0.41 | 3.61 | $ 30.33 | $ 63,080 |
| Oklahoma City, OK | 70 | 0.11 | 0.93 | $ 29.23 | $ 60,790 |
| Sacramento--Roseville--Arden-Arcade, CA | 110 | 0.10 | 0.90 | $ 29.04 | $ 60,400 |
| Boulder, CO | 30 | 0.17 | 1.51 | $ 28.43 | $ 59,130 |
Nonmetropolitan areas with the highest employment in Recreational Vehicle Service Technicians:
| Nonmetropolitan area | Employment (1) | Employment per thousand jobs | Location quotient (9) | Hourly mean wage | Annual mean wage (2) |
|---|---|---|---|---|---|
| Northern Indiana nonmetropolitan area | 120 | 0.58 | 5.04 | $ 23.75 | $ 49,390 |
| Central Indiana nonmetropolitan area | 100 | 0.62 | 5.44 | $ 24.81 | $ 51,600 |
| Northwest Iowa nonmetropolitan area | 90 | 0.68 | 5.96 | $ 25.62 | $ 53,290 |
| North Texas Region of Texas nonmetropolitan area | 60 | 0.23 | 2.02 | $ 20.92 | $ 43,520 |
| Eastern Oregon nonmetropolitan area | 60 | 0.78 | 6.85 | $ 23.54 | $ 48,950 |
Nonmetropolitan areas with the highest concentration of jobs and location quotients in Recreational Vehicle Service Technicians:
| Nonmetropolitan area | Employment (1) | Employment per thousand jobs | Location quotient (9) | Hourly mean wage | Annual mean wage (2) |
|---|---|---|---|---|---|
| Eastern Oregon nonmetropolitan area | 60 | 0.78 | 6.85 | $ 23.54 | $ 48,950 |
| Northwest Iowa nonmetropolitan area | 90 | 0.68 | 5.96 | $ 25.62 | $ 53,290 |
| Central Indiana nonmetropolitan area | 100 | 0.62 | 5.44 | $ 24.81 | $ 51,600 |
| Northern Indiana nonmetropolitan area | 120 | 0.58 | 5.04 | $ 23.75 | $ 49,390 |
| Northeast Lower Peninsula of Michigan nonmetropolitan area | 30 | 0.45 | 3.98 | $ 25.22 | $ 52,450 |
Top paying nonmetropolitan areas for Recreational Vehicle Service Technicians:
| Nonmetropolitan area | Employment (1) | Employment per thousand jobs | Location quotient (9) | Hourly mean wage | Annual mean wage (2) |
|---|---|---|---|---|---|
| Northwest Iowa nonmetropolitan area | 90 | 0.68 | 5.96 | $ 25.62 | $ 53,290 |
| Coast Oregon nonmetropolitan area | 30 | 0.28 | 2.45 | $ 25.34 | $ 52,700 |
| Northeast Lower Peninsula of Michigan nonmetropolitan area | 30 | 0.45 | 3.98 | $ 25.22 | $ 52,450 |
| Central Indiana nonmetropolitan area | 100 | 0.62 | 5.44 | $ 24.81 | $ 51,600 |
| Southern Indiana nonmetropolitan area | 50 | 0.29 | 2.56 | $ 24.55 | $ 51,070 |
These estimates are calculated with data collected from employers in all industry sectors, all metropolitan and nonmetropolitan areas, and all states and the District of Columbia. The top employment and wage figures are provided above. The complete list is available in the downloadable XLS files.
The percentile wage estimate is the value of a wage below which a certain percent of workers fall. The median wage is the 50th percentile wage estimate—50 percent of workers earn less than the median and 50 percent of workers earn more than the median. More about percentile wages.
(1) Estimates for detailed occupations do not sum to the totals because the totals include occupations not shown separately. Estimates do not include self-employed workers.
(2) Annual wages have been calculated by multiplying the hourly mean wage by a "year-round, full-time" hours figure of 2,080 hours; for those occupations where there is not an hourly wage published, the annual wage has been directly calculated from the reported survey data.
(3) The relative standard error (RSE) is a measure of the reliability of a survey statistic. The smaller the relative standard error, the more precise the estimate.
(8) Estimate not released.
(9) The location quotient is the ratio of the area concentration of occupational employment to the national average concentration. A location quotient greater than one indicates the occupation has a higher share of employment than average, and a location quotient less than one indicates the occupation is less prevalent in the area than average.
Other OEWS estimates and related information:
May 2023 National Occupational Employment and Wage Estimates
May 2023 State Occupational Employment and Wage Estimates
May 2023 Metropolitan and Nonmetropolitan Area Occupational Employment and Wage Estimates
May 2023 National Industry-Specific Occupational Employment and Wage Estimates
Last Modified Date: April 3, 2024