
An official website of the United States government
An official website of the United States government
The .gov means it's official.
Federal government websites often end in .gov or .mil. Before sharing sensitive information,
make sure you're on a federal government site.
The site is secure.
The
https:// ensures that you are connecting to the official website and that any
information you provide is encrypted and transmitted securely.
Operate or tend furnaces, such as gas, oil, coal, electric-arc or electric induction, open-hearth, or oxygen furnaces, to melt and refine metal before casting or to produce specified types of steel. Excludes �Heat Treating Equipment Setters, Operators, and Tenders, Metal and Plastic� (51-4191).
Employment estimate and mean wage estimates for Metal-Refining Furnace Operators and Tenders:
| Employment (1) | Employment RSE (3) |
Mean hourly wage |
Mean annual wage (2) |
Wage RSE (3) |
|---|---|---|---|---|
| 20,870 | 4.8 % | $ 26.13 | $ 54,340 | 0.9 % |
Percentile wage estimates for Metal-Refining Furnace Operators and Tenders:
| Percentile | 10% | 25% | 50% (Median) |
75% | 90% |
|---|---|---|---|---|---|
| Hourly Wage | $ 17.87 | $ 21.19 | $ 24.16 | $ 30.69 | $ 39.68 |
| Annual Wage (2) | $ 37,180 | $ 44,080 | $ 50,250 | $ 63,820 | $ 82,530 |
Industries with the highest published employment and wages for Metal-Refining Furnace Operators and Tenders are provided. For a list of all industries with employment in Metal-Refining Furnace Operators and Tenders, see the Create Customized Tables function.
Industries with the highest levels of employment in Metal-Refining Furnace Operators and Tenders:
| Industry | Employment (1) | Percent of industry employment | Hourly mean wage | Annual mean wage (2) |
|---|---|---|---|---|
| Iron and Steel Mills and Ferroalloy Manufacturing | 6,650 | 7.92 | $ 29.67 | $ 61,720 |
| Nonferrous Metal (except Aluminum) Production and Processing | 3,510 | 5.72 | $ 26.70 | $ 55,540 |
| Foundries | 3,500 | 3.26 | $ 23.17 | $ 48,190 |
| Alumina and Aluminum Production and Processing | 2,390 | 4.01 | $ 26.33 | $ 54,760 |
| Merchant Wholesalers, Durable Goods (4232, 4233, 4235, 4236, 4237, and 4239 only) | 970 | 0.06 | $ 17.34 | $ 36,060 |
Industries with the highest concentration of employment in Metal-Refining Furnace Operators and Tenders:
| Industry | Employment (1) | Percent of industry employment | Hourly mean wage | Annual mean wage (2) |
|---|---|---|---|---|
| Iron and Steel Mills and Ferroalloy Manufacturing | 6,650 | 7.92 | $ 29.67 | $ 61,720 |
| Nonferrous Metal (except Aluminum) Production and Processing | 3,510 | 5.72 | $ 26.70 | $ 55,540 |
| Alumina and Aluminum Production and Processing | 2,390 | 4.01 | $ 26.33 | $ 54,760 |
| Foundries | 3,500 | 3.26 | $ 23.17 | $ 48,190 |
| Steel Product Manufacturing from Purchased Steel | 380 | 0.65 | $ 25.35 | $ 52,730 |
Top paying industries for Metal-Refining Furnace Operators and Tenders:
| Industry | Employment (1) | Percent of industry employment | Hourly mean wage | Annual mean wage (2) |
|---|---|---|---|---|
| Metal Ore Mining | 100 | 0.24 | $ 32.42 | $ 67,430 |
| Engine, Turbine, and Power Transmission Equipment Manufacturing | 50 | 0.06 | $ 29.89 | $ 62,180 |
| Iron and Steel Mills and Ferroalloy Manufacturing | 6,650 | 7.92 | $ 29.67 | $ 61,720 |
| Nonferrous Metal (except Aluminum) Production and Processing | 3,510 | 5.72 | $ 26.70 | $ 55,540 |
| Alumina and Aluminum Production and Processing | 2,390 | 4.01 | $ 26.33 | $ 54,760 |
States and areas with the highest published employment, location quotients, and wages for Metal-Refining Furnace Operators and Tenders are provided. For a list of all areas with employment in Metal-Refining Furnace Operators and Tenders, see the Create Customized Tables function.
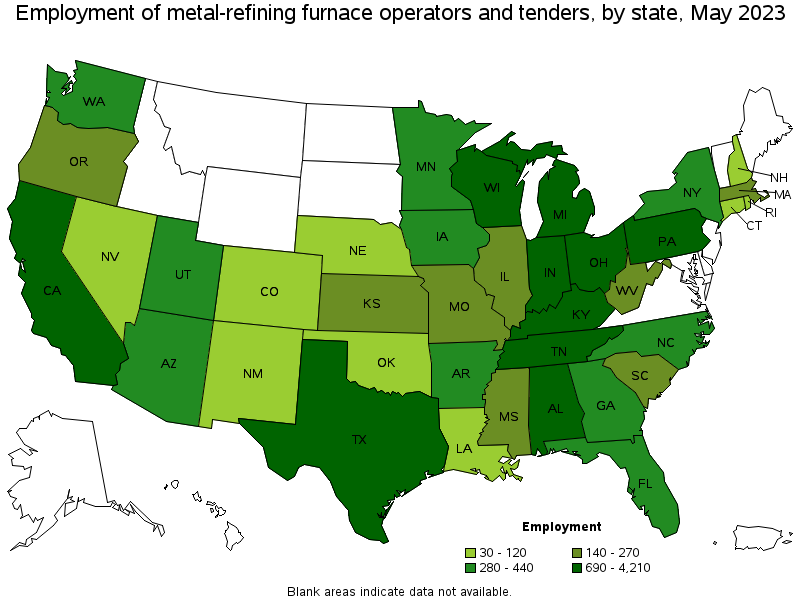
States with the highest employment level in Metal-Refining Furnace Operators and Tenders:
| State | Employment (1) | Employment per thousand jobs | Location quotient (9) | Hourly mean wage | Annual mean wage (2) |
|---|---|---|---|---|---|
| Indiana | 4,210 | 1.33 | 9.71 | $ 33.33 | $ 69,320 |
| Ohio | 2,620 | 0.48 | 3.49 | $ 24.91 | $ 51,800 |
| Pennsylvania | 1,530 | 0.26 | 1.87 | $ 25.96 | $ 53,990 |
| Michigan | 1,210 | 0.28 | 2.03 | $ 21.20 | $ 44,100 |
| Tennessee | 990 | 0.31 | 2.24 | $ 23.16 | $ 48,170 |
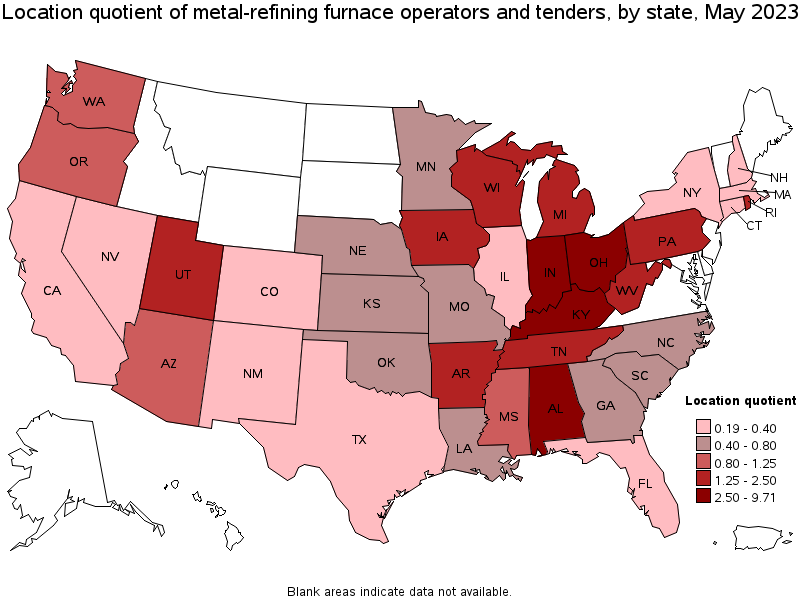
States with the highest concentration of jobs and location quotients in Metal-Refining Furnace Operators and Tenders:
| State | Employment (1) | Employment per thousand jobs | Location quotient (9) | Hourly mean wage | Annual mean wage (2) |
|---|---|---|---|---|---|
| Indiana | 4,210 | 1.33 | 9.71 | $ 33.33 | $ 69,320 |
| Ohio | 2,620 | 0.48 | 3.49 | $ 24.91 | $ 51,800 |
| Alabama | 960 | 0.47 | 3.40 | $ 21.18 | $ 44,060 |
| Kentucky | 690 | 0.35 | 2.55 | $ 25.62 | $ 53,290 |
| Tennessee | 990 | 0.31 | 2.24 | $ 23.16 | $ 48,170 |
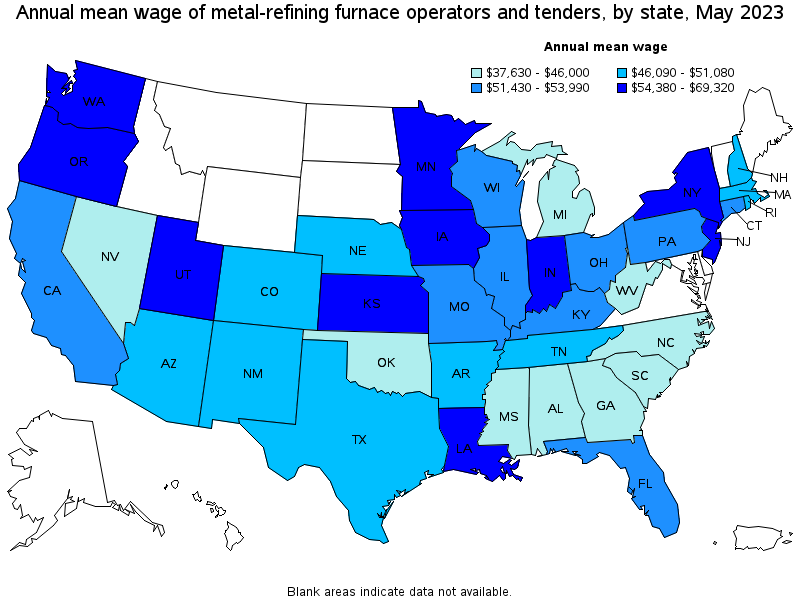
Top paying states for Metal-Refining Furnace Operators and Tenders:
| State | Employment (1) | Employment per thousand jobs | Location quotient (9) | Hourly mean wage | Annual mean wage (2) |
|---|---|---|---|---|---|
| Indiana | 4,210 | 1.33 | 9.71 | $ 33.33 | $ 69,320 |
| Utah | 430 | 0.26 | 1.86 | $ 31.85 | $ 66,250 |
| Oregon | 270 | 0.14 | 1.03 | $ 31.17 | $ 64,830 |
| New York | 360 | 0.04 | 0.28 | $ 29.08 | $ 60,490 |
| Washington | 440 | 0.13 | 0.91 | $ 27.92 | $ 58,070 |
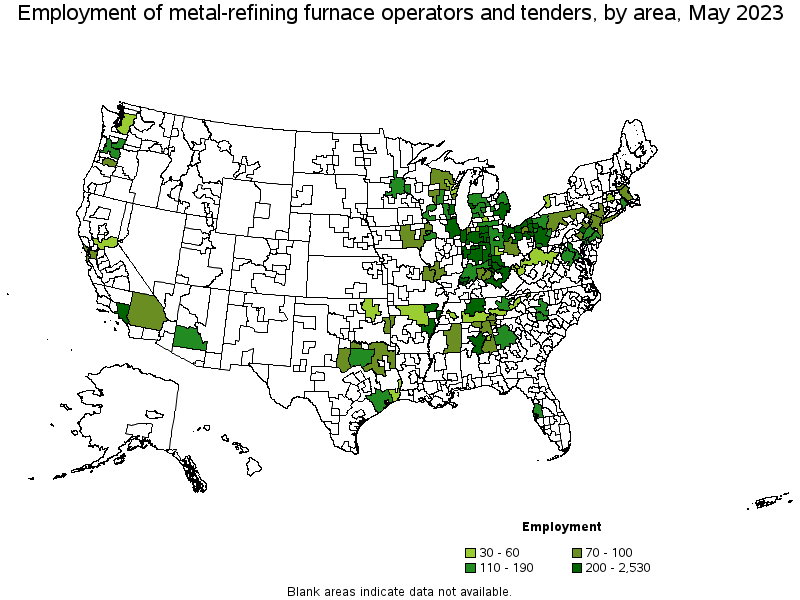
Metropolitan areas with the highest employment level in Metal-Refining Furnace Operators and Tenders:
| Metropolitan area | Employment (1) | Employment per thousand jobs | Location quotient (9) | Hourly mean wage | Annual mean wage (2) |
|---|---|---|---|---|---|
| Chicago-Naperville-Elgin, IL-IN-WI | 2,530 | 0.56 | 4.08 | $ 37.50 | $ 78,010 |
| Cincinnati, OH-KY-IN | 540 | 0.50 | 3.65 | $ 26.69 | $ 55,510 |
| Pittsburgh, PA | 540 | 0.50 | 3.67 | $ 25.14 | $ 52,290 |
| Detroit-Warren-Dearborn, MI | 500 | 0.26 | 1.93 | $ 20.34 | $ 42,310 |
| Cleveland-Elyria, OH | 440 | 0.44 | 3.23 | $ 26.71 | $ 55,560 |
| Los Angeles-Long Beach-Anaheim, CA | 400 | 0.06 | 0.47 | $ 25.04 | $ 52,070 |
| Canton-Massillon, OH | 370 | 2.32 | 16.85 | $ 25.17 | $ 52,360 |
| Reading, PA | 310 | 1.80 | 13.07 | $ 30.28 | $ 62,990 |
| Birmingham-Hoover, AL | 290 | 0.57 | 4.18 | $ 19.79 | $ 41,170 |
| Fort Wayne, IN | 290 | 1.29 | 9.40 | $ 28.13 | $ 58,510 |
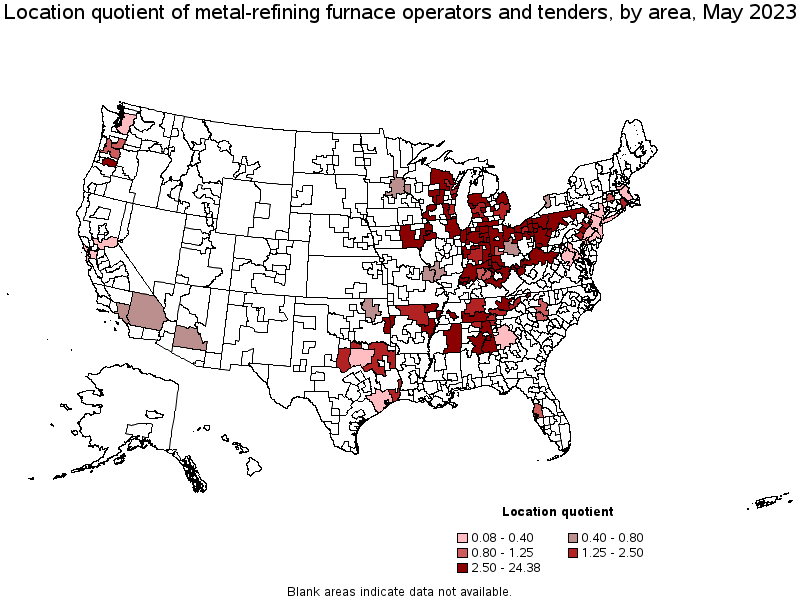
Metropolitan areas with the highest concentration of jobs and location quotients in Metal-Refining Furnace Operators and Tenders:
| Metropolitan area | Employment (1) | Employment per thousand jobs | Location quotient (9) | Hourly mean wage | Annual mean wage (2) |
|---|---|---|---|---|---|
| Muskegon, MI | 210 | 3.35 | 24.38 | $ 21.51 | $ 44,740 |
| Michigan City-La Porte, IN | 100 | 2.50 | 18.21 | $ 20.91 | $ 43,490 |
| Canton-Massillon, OH | 370 | 2.32 | 16.85 | $ 25.17 | $ 52,360 |
| Albany, OR | 100 | 2.06 | 14.96 | (8) | (8) |
| Reading, PA | 310 | 1.80 | 13.07 | $ 30.28 | $ 62,990 |
| Evansville, IN-KY | 250 | 1.64 | 11.96 | $ 28.59 | $ 59,470 |
| Fort Wayne, IN | 290 | 1.29 | 9.40 | $ 28.13 | $ 58,510 |
| Anniston-Oxford-Jacksonville, AL | 50 | 1.12 | 8.17 | $ 19.91 | $ 41,420 |
| Youngstown-Warren-Boardman, OH-PA | 210 | 1.02 | 7.41 | $ 22.75 | $ 47,330 |
| Jackson, TN | 60 | 0.83 | 6.06 | $ 23.19 | $ 48,240 |
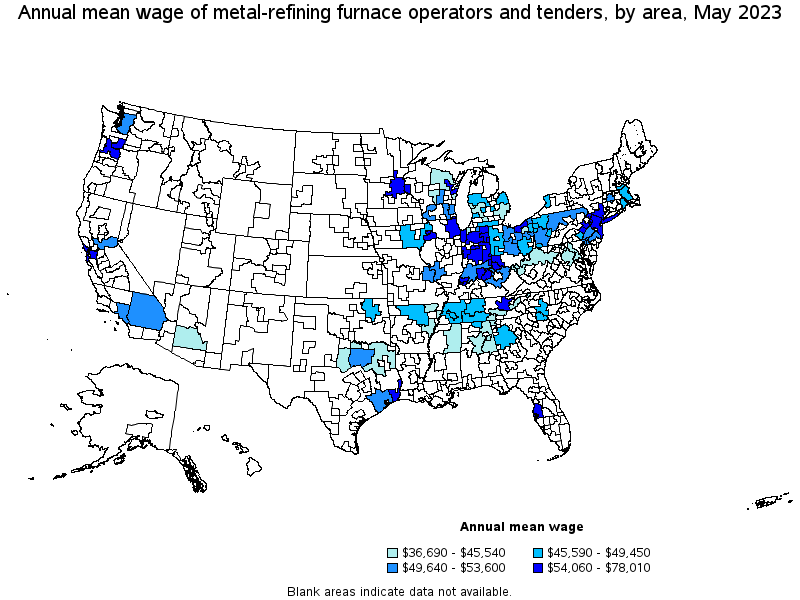
Top paying metropolitan areas for Metal-Refining Furnace Operators and Tenders:
| Metropolitan area | Employment (1) | Employment per thousand jobs | Location quotient (9) | Hourly mean wage | Annual mean wage (2) |
|---|---|---|---|---|---|
| Chicago-Naperville-Elgin, IL-IN-WI | 2,530 | 0.56 | 4.08 | $ 37.50 | $ 78,010 |
| Portland-Vancouver-Hillsboro, OR-WA | 150 | 0.13 | 0.93 | $ 30.95 | $ 64,370 |
| Louisville/Jefferson County, KY-IN | 90 | 0.13 | 0.97 | $ 30.52 | $ 63,470 |
| Reading, PA | 310 | 1.80 | 13.07 | $ 30.28 | $ 62,990 |
| Beaumont-Port Arthur, TX | 40 | 0.27 | 1.95 | $ 29.80 | $ 61,980 |
| New York-Newark-Jersey City, NY-NJ-PA | 100 | 0.01 | 0.08 | $ 29.68 | $ 61,740 |
| San Francisco-Oakland-Hayward, CA | 80 | 0.03 | 0.24 | $ 29.18 | $ 60,690 |
| Davenport-Moline-Rock Island, IA-IL | 150 | 0.83 | 6.02 | $ 29.13 | $ 60,600 |
| Minneapolis-St. Paul-Bloomington, MN-WI | 190 | 0.10 | 0.73 | $ 28.80 | $ 59,910 |
| Knoxville, TN | 170 | 0.42 | 3.08 | $ 28.79 | $ 59,880 |
Nonmetropolitan areas with the highest employment in Metal-Refining Furnace Operators and Tenders:
| Nonmetropolitan area | Employment (1) | Employment per thousand jobs | Location quotient (9) | Hourly mean wage | Annual mean wage (2) |
|---|---|---|---|---|---|
| Northern Indiana nonmetropolitan area | 330 | 1.54 | 11.17 | $ 26.60 | $ 55,330 |
| North Northeastern Ohio nonmetropolitan area (noncontiguous) | 250 | 0.78 | 5.67 | $ 25.34 | $ 52,700 |
| Central Kentucky nonmetropolitan area | 230 | 1.24 | 9.01 | $ 24.38 | $ 50,710 |
| Central Indiana nonmetropolitan area | 200 | 1.28 | 9.33 | $ 26.29 | $ 54,680 |
| East Arkansas nonmetropolitan area | 200 | 3.00 | 21.83 | $ 19.92 | $ 41,440 |
Nonmetropolitan areas with the highest concentration of jobs and location quotients in Metal-Refining Furnace Operators and Tenders:
| Nonmetropolitan area | Employment (1) | Employment per thousand jobs | Location quotient (9) | Hourly mean wage | Annual mean wage (2) |
|---|---|---|---|---|---|
| East Arkansas nonmetropolitan area | 200 | 3.00 | 21.83 | $ 19.92 | $ 41,440 |
| Northern Indiana nonmetropolitan area | 330 | 1.54 | 11.17 | $ 26.60 | $ 55,330 |
| Central Indiana nonmetropolitan area | 200 | 1.28 | 9.33 | $ 26.29 | $ 54,680 |
| Central Kentucky nonmetropolitan area | 230 | 1.24 | 9.01 | $ 24.38 | $ 50,710 |
| Western Pennsylvania nonmetropolitan area | 110 | 0.81 | 5.89 | $ 23.78 | $ 49,450 |
Top paying nonmetropolitan areas for Metal-Refining Furnace Operators and Tenders:
| Nonmetropolitan area | Employment (1) | Employment per thousand jobs | Location quotient (9) | Hourly mean wage | Annual mean wage (2) |
|---|---|---|---|---|---|
| Northern Indiana nonmetropolitan area | 330 | 1.54 | 11.17 | $ 26.60 | $ 55,330 |
| Central Indiana nonmetropolitan area | 200 | 1.28 | 9.33 | $ 26.29 | $ 54,680 |
| North Northeastern Ohio nonmetropolitan area (noncontiguous) | 250 | 0.78 | 5.67 | $ 25.34 | $ 52,700 |
| South Central Wisconsin nonmetropolitan area | 170 | 0.80 | 5.85 | $ 25.04 | $ 52,090 |
| Northern Pennsylvania nonmetropolitan area | 100 | 0.66 | 4.78 | $ 24.64 | $ 51,260 |
These estimates are calculated with data collected from employers in all industry sectors, all metropolitan and nonmetropolitan areas, and all states and the District of Columbia. The top employment and wage figures are provided above. The complete list is available in the downloadable XLS files.
The percentile wage estimate is the value of a wage below which a certain percent of workers fall. The median wage is the 50th percentile wage estimate—50 percent of workers earn less than the median and 50 percent of workers earn more than the median. More about percentile wages.
(1) Estimates for detailed occupations do not sum to the totals because the totals include occupations not shown separately. Estimates do not include self-employed workers.
(2) Annual wages have been calculated by multiplying the hourly mean wage by a "year-round, full-time" hours figure of 2,080 hours; for those occupations where there is not an hourly wage published, the annual wage has been directly calculated from the reported survey data.
(3) The relative standard error (RSE) is a measure of the reliability of a survey statistic. The smaller the relative standard error, the more precise the estimate.
(8) Estimate not released.
(9) The location quotient is the ratio of the area concentration of occupational employment to the national average concentration. A location quotient greater than one indicates the occupation has a higher share of employment than average, and a location quotient less than one indicates the occupation is less prevalent in the area than average.
Other OEWS estimates and related information:
May 2023 National Occupational Employment and Wage Estimates
May 2023 State Occupational Employment and Wage Estimates
May 2023 Metropolitan and Nonmetropolitan Area Occupational Employment and Wage Estimates
May 2023 National Industry-Specific Occupational Employment and Wage Estimates
Last Modified Date: April 3, 2024