
An official website of the United States government
An official website of the United States government
The .gov means it's official.
Federal government websites often end in .gov or .mil. Before sharing sensitive information,
make sure you're on a federal government site.
The site is secure.
The
https:// ensures that you are connecting to the official website and that any
information you provide is encrypted and transmitted securely.
Service aircraft with fuel. May de-ice aircraft, refill water and cooling agents, empty sewage tanks, service air and oxygen systems, or clean and polish exterior.
Employment estimate and mean wage estimates for Aircraft Service Attendants:
| Employment (1) | Employment RSE (3) |
Mean hourly wage |
Mean annual wage (2) |
Wage RSE (3) |
|---|---|---|---|---|
| 24,940 | 4.1 % | $ 20.25 | $ 42,110 | 0.6 % |
Percentile wage estimates for Aircraft Service Attendants:
| Percentile | 10% | 25% | 50% (Median) |
75% | 90% |
|---|---|---|---|---|---|
| Hourly Wage | $ 15.40 | $ 17.30 | $ 18.80 | $ 22.12 | $ 25.87 |
| Annual Wage (2) | $ 32,040 | $ 35,980 | $ 39,110 | $ 46,010 | $ 53,820 |
Industries with the highest published employment and wages for Aircraft Service Attendants are provided. For a list of all industries with employment in Aircraft Service Attendants, see the Create Customized Tables function.
Industries with the highest levels of employment in Aircraft Service Attendants:
| Industry | Employment (1) | Percent of industry employment | Hourly mean wage | Annual mean wage (2) |
|---|---|---|---|---|
| Support Activities for Air Transportation | 17,880 | 7.06 | $ 19.75 | $ 41,090 |
| Scheduled Air Transportation | 2,450 | 0.51 | $ 20.32 | $ 42,270 |
| Nonscheduled Air Transportation | 1,190 | 2.04 | $ 20.55 | $ 42,740 |
| Couriers and Express Delivery Services | 1,040 | 0.11 | $ 25.56 | $ 53,170 |
| Local Government, excluding Schools and Hospitals (OEWS Designation) | 730 | 0.01 | $ 19.61 | $ 40,790 |
Industries with the highest concentration of employment in Aircraft Service Attendants:
| Industry | Employment (1) | Percent of industry employment | Hourly mean wage | Annual mean wage (2) |
|---|---|---|---|---|
| Support Activities for Air Transportation | 17,880 | 7.06 | $ 19.75 | $ 41,090 |
| Nonscheduled Air Transportation | 1,190 | 2.04 | $ 20.55 | $ 42,740 |
| Scheduled Air Transportation | 2,450 | 0.51 | $ 20.32 | $ 42,270 |
| Technical and Trade Schools | 300 | 0.21 | $ 16.82 | $ 34,990 |
| Couriers and Express Delivery Services | 1,040 | 0.11 | $ 25.56 | $ 53,170 |
Top paying industries for Aircraft Service Attendants:
| Industry | Employment (1) | Percent of industry employment | Hourly mean wage | Annual mean wage (2) |
|---|---|---|---|---|
| Couriers and Express Delivery Services | 1,040 | 0.11 | $ 25.56 | $ 53,170 |
| Nonscheduled Air Transportation | 1,190 | 2.04 | $ 20.55 | $ 42,740 |
| Scheduled Air Transportation | 2,450 | 0.51 | $ 20.32 | $ 42,270 |
| Colleges, Universities, and Professional Schools | 50 | (7) | $ 20.01 | $ 41,620 |
| Support Activities for Air Transportation | 17,880 | 7.06 | $ 19.75 | $ 41,090 |
States and areas with the highest published employment, location quotients, and wages for Aircraft Service Attendants are provided. For a list of all areas with employment in Aircraft Service Attendants, see the Create Customized Tables function.
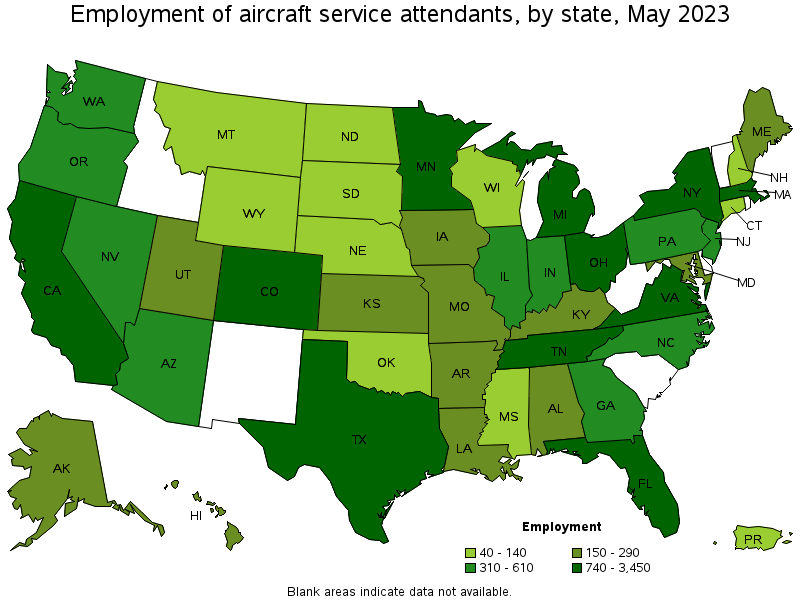
States with the highest employment level in Aircraft Service Attendants:
| State | Employment (1) | Employment per thousand jobs | Location quotient (9) | Hourly mean wage | Annual mean wage (2) |
|---|---|---|---|---|---|
| Florida | 3,450 | 0.36 | 2.20 | $ 19.10 | $ 39,720 |
| Texas | 2,410 | 0.18 | 1.08 | $ 19.26 | $ 40,050 |
| California | 2,330 | 0.13 | 0.79 | $ 21.56 | $ 44,840 |
| New York | 1,530 | 0.16 | 0.99 | $ 20.42 | $ 42,480 |
| Colorado | 1,290 | 0.46 | 2.77 | $ 19.80 | $ 41,180 |
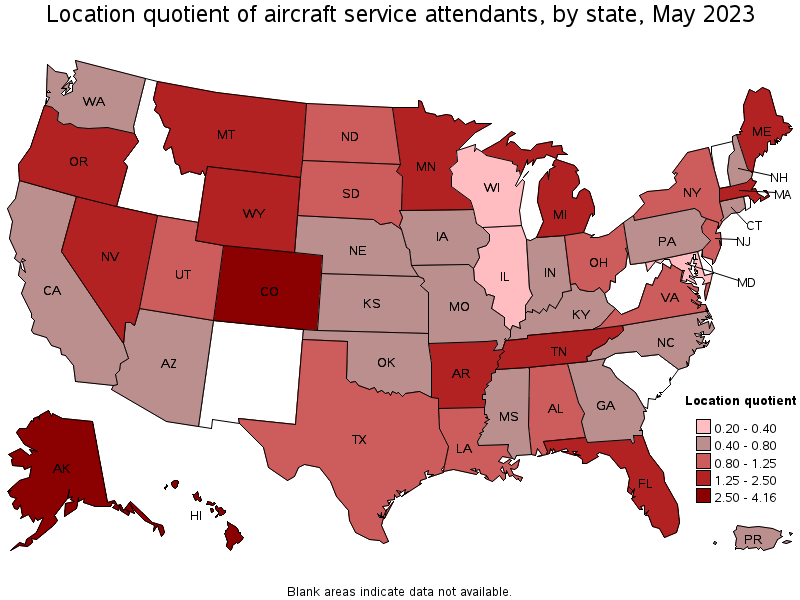
States with the highest concentration of jobs and location quotients in Aircraft Service Attendants:
| State | Employment (1) | Employment per thousand jobs | Location quotient (9) | Hourly mean wage | Annual mean wage (2) |
|---|---|---|---|---|---|
| Alaska | 210 | 0.68 | 4.16 | $ 20.27 | $ 42,160 |
| Colorado | 1,290 | 0.46 | 2.77 | $ 19.80 | $ 41,180 |
| Hawaii | 280 | 0.45 | 2.76 | $ 21.64 | $ 45,010 |
| Nevada | 530 | 0.36 | 2.20 | $ 20.36 | $ 42,350 |
| Florida | 3,450 | 0.36 | 2.20 | $ 19.10 | $ 39,720 |
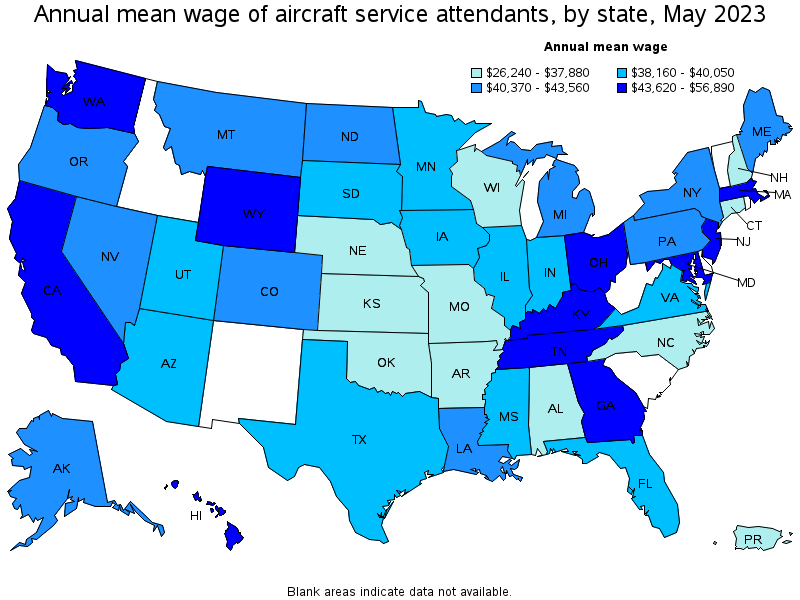
Top paying states for Aircraft Service Attendants:
| State | Employment (1) | Employment per thousand jobs | Location quotient (9) | Hourly mean wage | Annual mean wage (2) |
|---|---|---|---|---|---|
| Maryland | 150 | 0.06 | 0.35 | $ 27.35 | $ 56,890 |
| Washington | 330 | 0.09 | 0.57 | $ 25.22 | $ 52,460 |
| Tennessee | 1,050 | 0.33 | 1.99 | $ 24.91 | $ 51,810 |
| Kentucky | 150 | 0.08 | 0.48 | $ 24.31 | $ 50,570 |
| New Jersey | 610 | 0.15 | 0.88 | $ 22.97 | $ 47,780 |
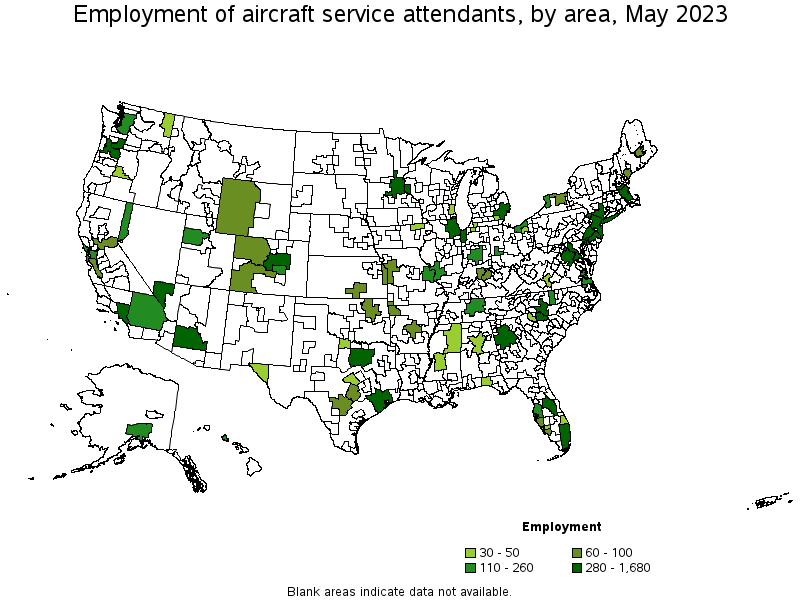
Metropolitan areas with the highest employment level in Aircraft Service Attendants:
| Metropolitan area | Employment (1) | Employment per thousand jobs | Location quotient (9) | Hourly mean wage | Annual mean wage (2) |
|---|---|---|---|---|---|
| New York-Newark-Jersey City, NY-NJ-PA | 1,680 | 0.18 | 1.08 | $ 22.01 | $ 45,770 |
| Los Angeles-Long Beach-Anaheim, CA | 1,540 | 0.25 | 1.52 | $ 21.27 | $ 44,240 |
| Miami-Fort Lauderdale-West Palm Beach, FL | 1,470 | 0.54 | 3.30 | $ 19.81 | $ 41,200 |
| Orlando-Kissimmee-Sanford, FL | 1,020 | 0.74 | 4.53 | $ 19.00 | $ 39,520 |
| Boston-Cambridge-Nashua, MA-NH | 870 | 0.32 | 1.93 | $ 20.99 | $ 43,660 |
| Denver-Aurora-Lakewood, CO | 850 | 0.53 | 3.24 | $ 20.74 | $ 43,150 |
| Houston-The Woodlands-Sugar Land, TX | 810 | 0.25 | 1.55 | $ 19.18 | $ 39,900 |
| Minneapolis-St. Paul-Bloomington, MN-WI | 780 | 0.41 | 2.49 | $ 18.91 | $ 39,330 |
| Dallas-Fort Worth-Arlington, TX | 750 | 0.19 | 1.15 | $ 19.98 | $ 41,570 |
| Detroit-Warren-Dearborn, MI | 720 | 0.38 | 2.30 | $ 19.63 | $ 40,830 |
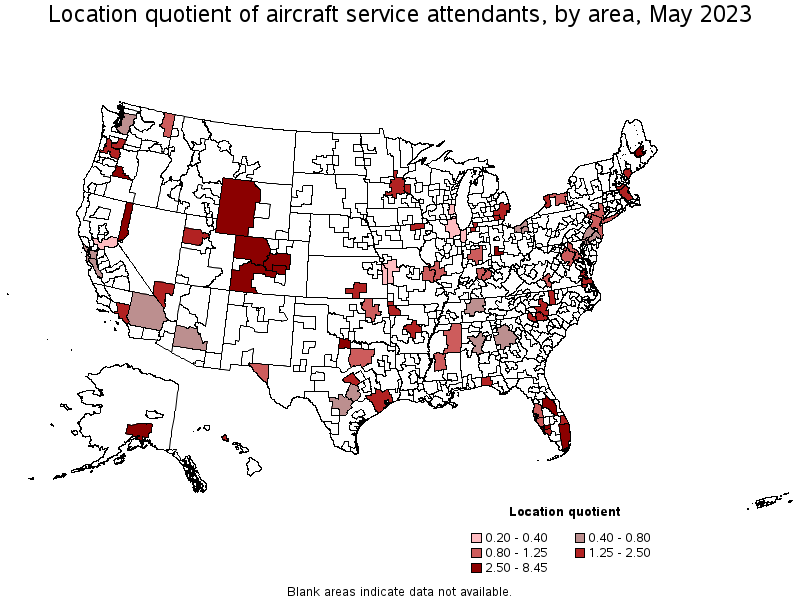
Metropolitan areas with the highest concentration of jobs and location quotients in Aircraft Service Attendants:
| Metropolitan area | Employment (1) | Employment per thousand jobs | Location quotient (9) | Hourly mean wage | Annual mean wage (2) |
|---|---|---|---|---|---|
| Bangor, ME | 90 | 1.39 | 8.45 | $ 20.69 | $ 43,040 |
| Anchorage, AK | 190 | 1.14 | 6.96 | $ 20.32 | $ 42,260 |
| Punta Gorda, FL | 40 | 0.82 | 4.99 | $ 16.55 | $ 34,420 |
| Orlando-Kissimmee-Sanford, FL | 1,020 | 0.74 | 4.53 | $ 19.00 | $ 39,520 |
| Wichita Falls, TX | 40 | 0.64 | 3.90 | $ 24.96 | $ 51,910 |
| Miami-Fort Lauderdale-West Palm Beach, FL | 1,470 | 0.54 | 3.30 | $ 19.81 | $ 41,200 |
| Denver-Aurora-Lakewood, CO | 850 | 0.53 | 3.24 | $ 20.74 | $ 43,150 |
| Bend-Redmond, OR | 40 | 0.49 | 2.99 | $ 16.98 | $ 35,310 |
| Reno, NV | 120 | 0.49 | 2.95 | $ 20.52 | $ 42,670 |
| Dayton, OH | 170 | 0.47 | 2.85 | $ 24.09 | $ 50,100 |
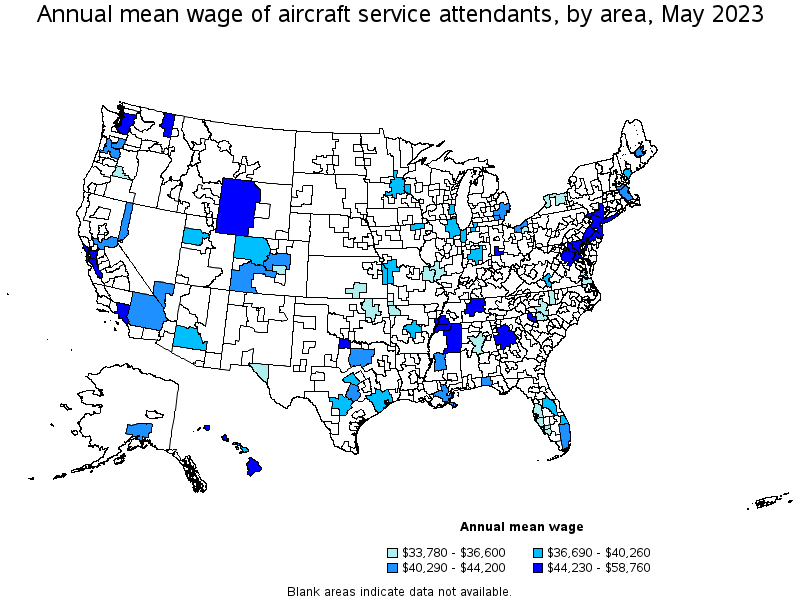
Top paying metropolitan areas for Aircraft Service Attendants:
| Metropolitan area | Employment (1) | Employment per thousand jobs | Location quotient (9) | Hourly mean wage | Annual mean wage (2) |
|---|---|---|---|---|---|
| Spokane-Spokane Valley, WA | 40 | 0.15 | 0.92 | $ 28.25 | $ 58,760 |
| Wichita Falls, TX | 40 | 0.64 | 3.90 | $ 24.96 | $ 51,910 |
| Seattle-Tacoma-Bellevue, WA | 220 | 0.11 | 0.65 | $ 24.79 | $ 51,550 |
| Nashville-Davidson--Murfreesboro--Franklin, TN | 130 | 0.12 | 0.73 | $ 24.72 | $ 51,410 |
| Memphis, TN-MS-AR | (8) | (8) | (8) | $ 24.61 | $ 51,180 |
| Dayton, OH | 170 | 0.47 | 2.85 | $ 24.09 | $ 50,100 |
| San Francisco-Oakland-Hayward, CA | 220 | 0.09 | 0.55 | $ 24.02 | $ 49,960 |
| Spartanburg, SC | 40 | 0.27 | 1.63 | $ 22.98 | $ 47,810 |
| Baltimore-Columbia-Towson, MD | (8) | (8) | (8) | $ 22.97 | $ 47,780 |
| Urban Honolulu, HI | 160 | 0.36 | 2.22 | $ 22.75 | $ 47,310 |
Nonmetropolitan areas with the highest employment in Aircraft Service Attendants:
| Nonmetropolitan area | Employment (1) | Employment per thousand jobs | Location quotient (9) | Hourly mean wage | Annual mean wage (2) |
|---|---|---|---|---|---|
| Northwest Colorado nonmetropolitan area | 100 | 0.78 | 4.75 | $ 19.21 | $ 39,950 |
| Southwest Colorado nonmetropolitan area | 90 | 0.82 | 5.02 | $ 19.88 | $ 41,340 |
| Western Wyoming nonmetropolitan area | 60 | 0.56 | 3.39 | $ 22.13 | $ 46,020 |
| Northeast Mississippi nonmetropolitan area | 30 | 0.13 | 0.81 | $ 23.39 | $ 48,640 |
Nonmetropolitan areas with the highest concentration of jobs and location quotients in Aircraft Service Attendants:
| Nonmetropolitan area | Employment (1) | Employment per thousand jobs | Location quotient (9) | Hourly mean wage | Annual mean wage (2) |
|---|---|---|---|---|---|
| Southwest Colorado nonmetropolitan area | 90 | 0.82 | 5.02 | $ 19.88 | $ 41,340 |
| Northwest Colorado nonmetropolitan area | 100 | 0.78 | 4.75 | $ 19.21 | $ 39,950 |
| Western Wyoming nonmetropolitan area | 60 | 0.56 | 3.39 | $ 22.13 | $ 46,020 |
| Northeast Mississippi nonmetropolitan area | 30 | 0.13 | 0.81 | $ 23.39 | $ 48,640 |
Top paying nonmetropolitan areas for Aircraft Service Attendants:
| Nonmetropolitan area | Employment (1) | Employment per thousand jobs | Location quotient (9) | Hourly mean wage | Annual mean wage (2) |
|---|---|---|---|---|---|
| Northeast Mississippi nonmetropolitan area | 30 | 0.13 | 0.81 | $ 23.39 | $ 48,640 |
| Western Wyoming nonmetropolitan area | 60 | 0.56 | 3.39 | $ 22.13 | $ 46,020 |
| Hawaii / Kauai nonmetropolitan area | (8) | (8) | (8) | $ 21.68 | $ 45,100 |
| Southwest Colorado nonmetropolitan area | 90 | 0.82 | 5.02 | $ 19.88 | $ 41,340 |
| Northwest Colorado nonmetropolitan area | 100 | 0.78 | 4.75 | $ 19.21 | $ 39,950 |
These estimates are calculated with data collected from employers in all industry sectors, all metropolitan and nonmetropolitan areas, and all states and the District of Columbia. The top employment and wage figures are provided above. The complete list is available in the downloadable XLS files.
The percentile wage estimate is the value of a wage below which a certain percent of workers fall. The median wage is the 50th percentile wage estimate—50 percent of workers earn less than the median and 50 percent of workers earn more than the median. More about percentile wages.
(1) Estimates for detailed occupations do not sum to the totals because the totals include occupations not shown separately. Estimates do not include self-employed workers.
(2) Annual wages have been calculated by multiplying the hourly mean wage by a "year-round, full-time" hours figure of 2,080 hours; for those occupations where there is not an hourly wage published, the annual wage has been directly calculated from the reported survey data.
(3) The relative standard error (RSE) is a measure of the reliability of a survey statistic. The smaller the relative standard error, the more precise the estimate.
(7) The value is less than .005 percent of industry employment.
(8) Estimate not released.
(9) The location quotient is the ratio of the area concentration of occupational employment to the national average concentration. A location quotient greater than one indicates the occupation has a higher share of employment than average, and a location quotient less than one indicates the occupation is less prevalent in the area than average.
Other OEWS estimates and related information:
May 2023 National Occupational Employment and Wage Estimates
May 2023 State Occupational Employment and Wage Estimates
May 2023 Metropolitan and Nonmetropolitan Area Occupational Employment and Wage Estimates
May 2023 National Industry-Specific Occupational Employment and Wage Estimates
Last Modified Date: April 3, 2024