
An official website of the United States government
An official website of the United States government
The .gov means it's official.
Federal government websites often end in .gov or .mil. Before sharing sensitive information,
make sure you're on a federal government site.
The site is secure.
The
https:// ensures that you are connecting to the official website and that any
information you provide is encrypted and transmitted securely.
Plan, direct, or coordinate operations and functionalities of facilities and buildings. May include surrounding grounds or multiple facilities of an organization�s campus. Excludes �Administrative Services Managers� (11-3012), �Property, Real Estate, and Community Association Managers� (11-9141), �First-Line Supervisors of Building and Grounds Cleaning and Maintenance Workers� (37-1010), �First-Line Supervisors of Mechanics and Repairers� (49-1011), and �Maintenance and Repair Workers, General� (49-9071).
Employment estimate and mean wage estimates for Facilities Managers:
| Employment (1) | Employment RSE (3) |
Mean hourly wage |
Mean annual wage (2) |
Wage RSE (3) |
|---|---|---|---|---|
| 131,400 | 1.2 % | $ 53.42 | $ 111,110 | 0.4 % |
Percentile wage estimates for Facilities Managers:
| Percentile | 10% | 25% | 50% (Median) |
75% | 90% |
|---|---|---|---|---|---|
| Hourly Wage | $ 29.25 | $ 37.56 | $ 49.20 | $ 64.42 | $ 81.26 |
| Annual Wage (2) | $ 60,840 | $ 78,130 | $ 102,340 | $ 133,990 | $ 169,020 |
Industries with the highest published employment and wages for Facilities Managers are provided. For a list of all industries with employment in Facilities Managers, see the Create Customized Tables function.
Industries with the highest levels of employment in Facilities Managers:
| Industry | Employment (1) | Percent of industry employment | Hourly mean wage | Annual mean wage (2) |
|---|---|---|---|---|
| Local Government, excluding Schools and Hospitals (OEWS Designation) | 9,930 | 0.18 | $ 52.54 | $ 109,280 |
| Management of Companies and Enterprises | 8,200 | 0.30 | $ 63.07 | $ 131,190 |
| Elementary and Secondary Schools | 7,620 | 0.09 | $ 47.87 | $ 99,560 |
| Real Estate | 6,910 | 0.38 | $ 50.06 | $ 104,120 |
| Colleges, Universities, and Professional Schools | 6,790 | 0.22 | $ 53.70 | $ 111,690 |
Industries with the highest concentration of employment in Facilities Managers:
| Industry | Employment (1) | Percent of industry employment | Hourly mean wage | Annual mean wage (2) |
|---|---|---|---|---|
| Facilities Support Services | 1,840 | 0.97 | $ 52.86 | $ 109,940 |
| Museums, Historical Sites, and Similar Institutions | 1,090 | 0.64 | $ 43.31 | $ 90,080 |
| RV (Recreational Vehicle) Parks and Recreational Camps | 400 | 0.62 | $ 34.44 | $ 71,630 |
| Pulp, Paper, and Paperboard Mills | 460 | 0.52 | $ 67.94 | $ 141,310 |
| Pipeline Transportation of Crude Oil | 60 | 0.50 | $ 77.82 | $ 161,860 |
Top paying industries for Facilities Managers:
| Industry | Employment (1) | Percent of industry employment | Hourly mean wage | Annual mean wage (2) |
|---|---|---|---|---|
| Oil and Gas Extraction | 160 | 0.15 | $ 90.66 | $ 188,570 |
| Media Streaming Distribution Services, Social Networks, and Other Media Networks and Content Providers | 260 | 0.11 | $ 87.85 | $ 182,720 |
| Pipeline Transportation of Natural Gas | 60 | 0.17 | $ 86.78 | $ 180,500 |
| Petroleum and Coal Products Manufacturing | 270 | 0.25 | $ 82.29 | $ 171,170 |
| Coal Mining | 140 | 0.33 | $ 81.64 | $ 169,800 |
States and areas with the highest published employment, location quotients, and wages for Facilities Managers are provided. For a list of all areas with employment in Facilities Managers, see the Create Customized Tables function.
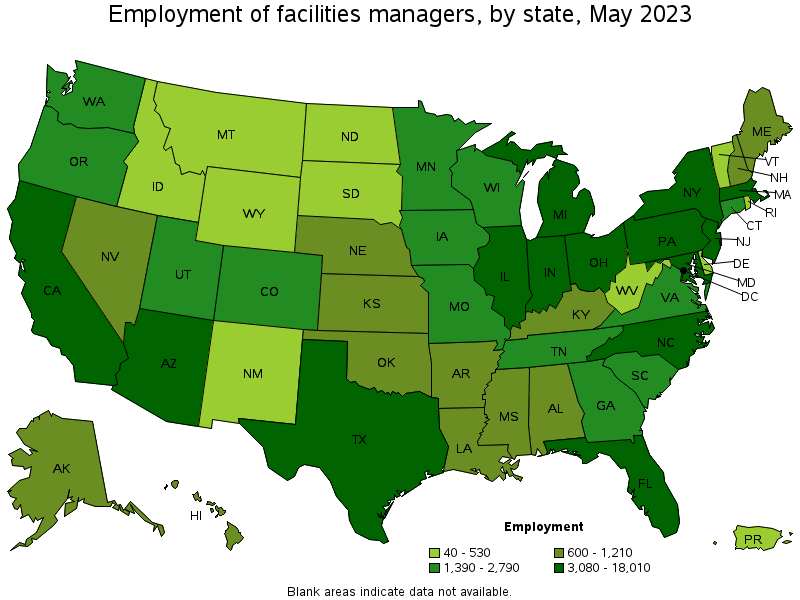
States with the highest employment level in Facilities Managers:
| State | Employment (1) | Employment per thousand jobs | Location quotient (9) | Hourly mean wage | Annual mean wage (2) |
|---|---|---|---|---|---|
| California | 18,010 | 1.00 | 1.16 | $ 58.10 | $ 120,850 |
| Texas | 10,120 | 0.75 | 0.86 | $ 52.65 | $ 109,510 |
| New York | 8,960 | 0.95 | 1.10 | $ 65.14 | $ 135,490 |
| Illinois | 7,310 | 1.22 | 1.40 | $ 51.47 | $ 107,070 |
| Florida | 7,190 | 0.75 | 0.87 | $ 49.98 | $ 103,970 |
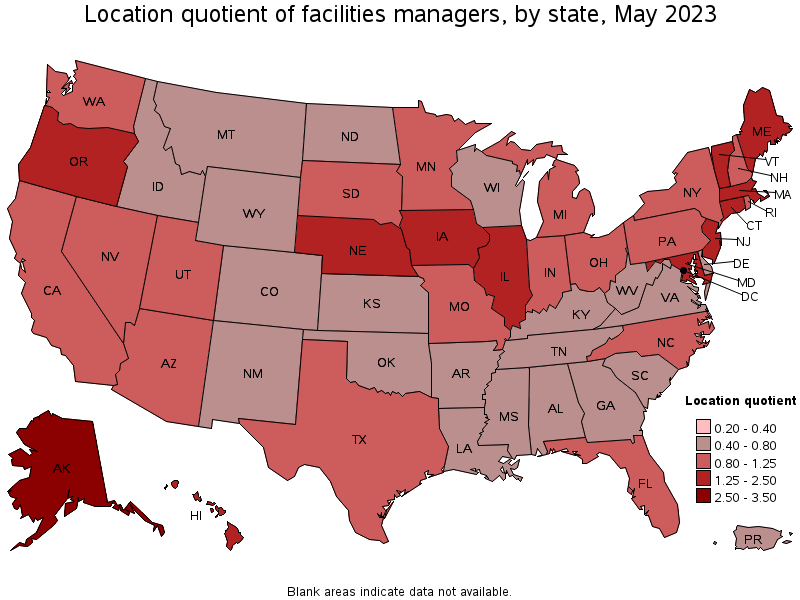
States with the highest concentration of jobs and location quotients in Facilities Managers:
| State | Employment (1) | Employment per thousand jobs | Location quotient (9) | Hourly mean wage | Annual mean wage (2) |
|---|---|---|---|---|---|
| Alaska | 790 | 2.52 | 2.91 | $ 58.33 | $ 121,320 |
| Vermont | 440 | 1.46 | 1.68 | $ 39.96 | $ 83,120 |
| Connecticut | 2,300 | 1.39 | 1.60 | $ 55.53 | $ 115,510 |
| Maryland | 3,630 | 1.36 | 1.57 | $ 48.00 | $ 99,830 |
| Massachusetts | 4,930 | 1.35 | 1.56 | $ 59.65 | $ 124,070 |
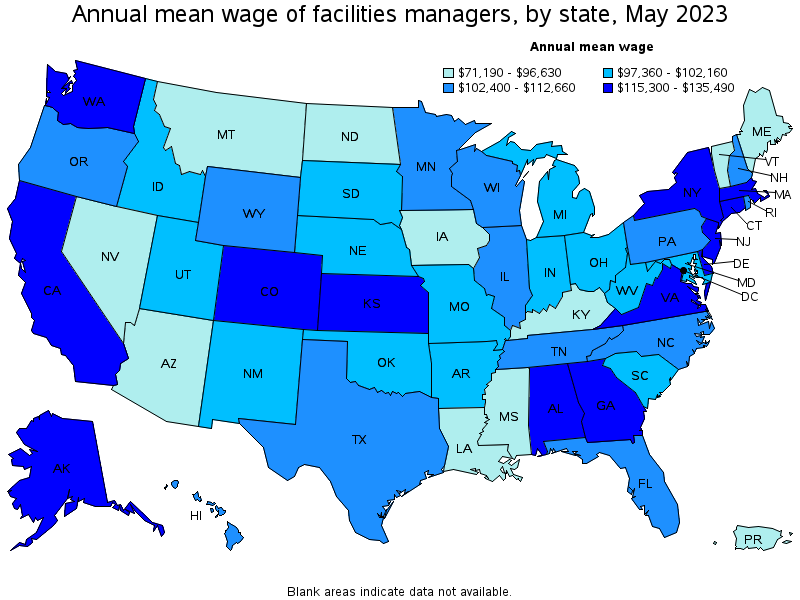
Top paying states for Facilities Managers:
| State | Employment (1) | Employment per thousand jobs | Location quotient (9) | Hourly mean wage | Annual mean wage (2) |
|---|---|---|---|---|---|
| New York | 8,960 | 0.95 | 1.10 | $ 65.14 | $ 135,490 |
| Delaware | 270 | 0.58 | 0.67 | $ 64.12 | $ 133,380 |
| New Jersey | 4,610 | 1.10 | 1.27 | $ 62.34 | $ 129,670 |
| District of Columbia | 850 | 1.20 | 1.39 | $ 61.80 | $ 128,540 |
| Massachusetts | 4,930 | 1.35 | 1.56 | $ 59.65 | $ 124,070 |
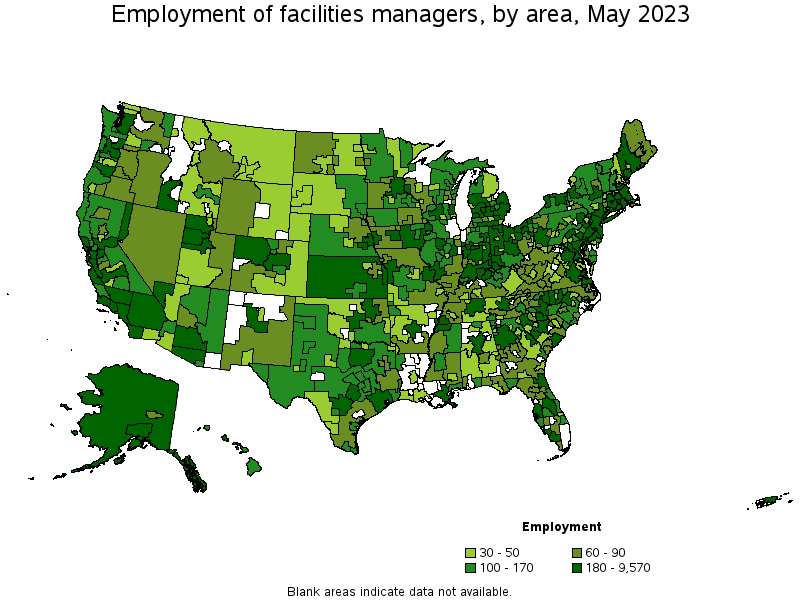
Metropolitan areas with the highest employment level in Facilities Managers:
| Metropolitan area | Employment (1) | Employment per thousand jobs | Location quotient (9) | Hourly mean wage | Annual mean wage (2) |
|---|---|---|---|---|---|
| New York-Newark-Jersey City, NY-NJ-PA | 9,570 | 1.01 | 1.16 | $ 67.36 | $ 140,110 |
| Los Angeles-Long Beach-Anaheim, CA | 5,790 | 0.94 | 1.08 | $ 57.41 | $ 119,400 |
| Boston-Cambridge-Nashua, MA-NH | 3,910 | 1.42 | 1.64 | $ 61.63 | $ 128,200 |
| Washington-Arlington-Alexandria, DC-VA-MD-WV | 3,110 | 1.01 | 1.16 | $ 55.75 | $ 115,960 |
| Dallas-Fort Worth-Arlington, TX | 3,030 | 0.76 | 0.88 | $ 55.30 | $ 115,020 |
| San Francisco-Oakland-Hayward, CA | 2,900 | 1.20 | 1.38 | $ 68.85 | $ 143,210 |
| Philadelphia-Camden-Wilmington, PA-NJ-DE-MD | 2,660 | 0.94 | 1.09 | $ 56.24 | $ 116,980 |
| Houston-The Woodlands-Sugar Land, TX | 2,390 | 0.75 | 0.87 | $ 54.72 | $ 113,820 |
| Phoenix-Mesa-Scottsdale, AZ | 2,220 | 0.97 | 1.12 | $ 47.71 | $ 99,230 |
| Detroit-Warren-Dearborn, MI | 1,890 | 0.99 | 1.15 | $ 48.06 | $ 99,970 |
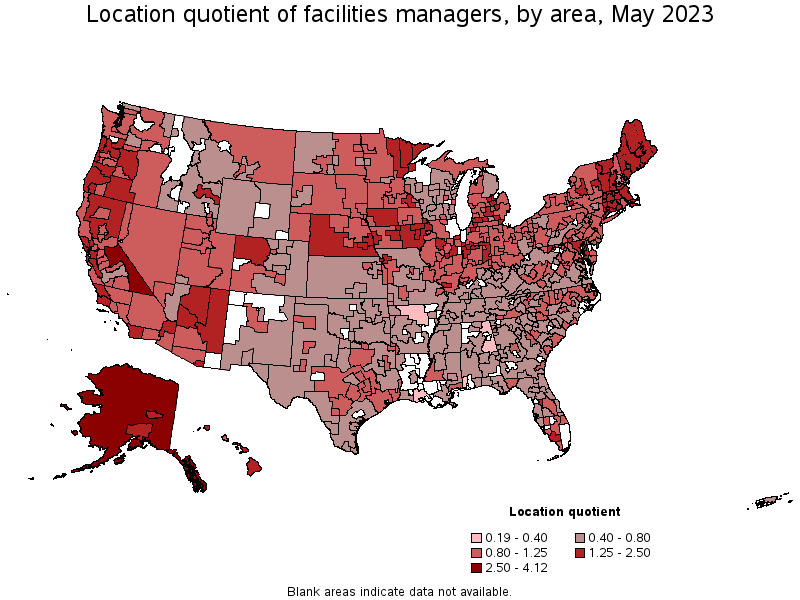
Metropolitan areas with the highest concentration of jobs and location quotients in Facilities Managers:
| Metropolitan area | Employment (1) | Employment per thousand jobs | Location quotient (9) | Hourly mean wage | Annual mean wage (2) |
|---|---|---|---|---|---|
| Lafayette-West Lafayette, IN | 210 | 2.14 | 2.47 | $ 43.88 | $ 91,280 |
| Anchorage, AK | 340 | 2.01 | 2.33 | $ 59.00 | $ 122,730 |
| Fairbanks, AK | 70 | 1.92 | 2.22 | $ 58.17 | $ 121,000 |
| Napa, CA | 140 | 1.77 | 2.05 | $ 54.55 | $ 113,470 |
| Champaign-Urbana, IL | 180 | 1.70 | 1.96 | $ 48.80 | $ 101,500 |
| Kahului-Wailuku-Lahaina, HI | 130 | 1.69 | 1.95 | $ 55.07 | $ 114,550 |
| Flagstaff, AZ | 100 | 1.59 | 1.84 | $ 40.62 | $ 84,480 |
| California-Lexington Park, MD | 70 | 1.56 | 1.80 | $ 46.75 | $ 97,230 |
| Bridgeport-Stamford-Norwalk, CT | 610 | 1.53 | 1.77 | $ 62.04 | $ 129,040 |
| Norwich-New London-Westerly, CT-RI | 190 | 1.51 | 1.75 | $ 52.15 | $ 108,470 |
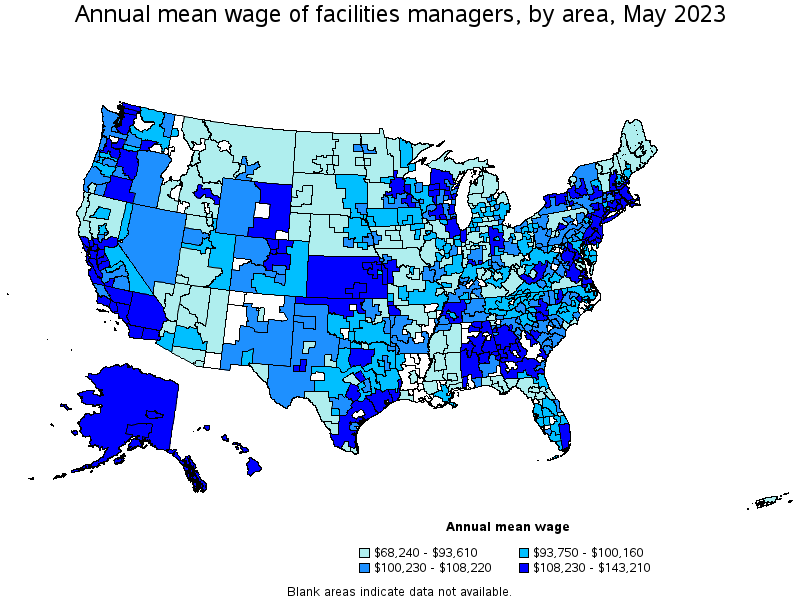
Top paying metropolitan areas for Facilities Managers:
| Metropolitan area | Employment (1) | Employment per thousand jobs | Location quotient (9) | Hourly mean wage | Annual mean wage (2) |
|---|---|---|---|---|---|
| San Francisco-Oakland-Hayward, CA | 2,900 | 1.20 | 1.38 | $ 68.85 | $ 143,210 |
| San Jose-Sunnyvale-Santa Clara, CA | 1,240 | 1.08 | 1.25 | $ 68.77 | $ 143,040 |
| Kennewick-Richland, WA | 100 | 0.84 | 0.97 | $ 68.04 | $ 141,510 |
| New York-Newark-Jersey City, NY-NJ-PA | 9,570 | 1.01 | 1.16 | $ 67.36 | $ 140,110 |
| Idaho Falls, ID | 100 | 1.32 | 1.52 | $ 64.37 | $ 133,890 |
| Trenton, NJ | 310 | 1.29 | 1.50 | $ 64.29 | $ 133,730 |
| Decatur, AL | 30 | 0.54 | 0.62 | $ 64.00 | $ 133,110 |
| Greeley, CO | 60 | 0.53 | 0.61 | $ 63.09 | $ 131,220 |
| Seattle-Tacoma-Bellevue, WA | 1,790 | 0.86 | 0.99 | $ 62.26 | $ 129,510 |
| Bridgeport-Stamford-Norwalk, CT | 610 | 1.53 | 1.77 | $ 62.04 | $ 129,040 |
Nonmetropolitan areas with the highest employment in Facilities Managers:
| Nonmetropolitan area | Employment (1) | Employment per thousand jobs | Location quotient (9) | Hourly mean wage | Annual mean wage (2) |
|---|---|---|---|---|---|
| Alaska nonmetropolitan area | 370 | 3.57 | 4.12 | $ 57.34 | $ 119,260 |
| North Northeastern Ohio nonmetropolitan area (noncontiguous) | 260 | 0.80 | 0.93 | $ 44.60 | $ 92,760 |
| Balance of Lower Peninsula of Michigan nonmetropolitan area | 250 | 0.96 | 1.11 | $ 44.73 | $ 93,040 |
| Southeast Iowa nonmetropolitan area | 240 | 1.12 | 1.29 | $ 43.90 | $ 91,320 |
| Southwest Maine nonmetropolitan area | 230 | 1.19 | 1.37 | $ 44.22 | $ 91,990 |
Nonmetropolitan areas with the highest concentration of jobs and location quotients in Facilities Managers:
| Nonmetropolitan area | Employment (1) | Employment per thousand jobs | Location quotient (9) | Hourly mean wage | Annual mean wage (2) |
|---|---|---|---|---|---|
| Alaska nonmetropolitan area | 370 | 3.57 | 4.12 | $ 57.34 | $ 119,260 |
| Eastern Sierra-Mother Lode Region of California nonmetropolitan area | 140 | 2.29 | 2.65 | $ 45.99 | $ 95,650 |
| Connecticut nonmetropolitan area | 60 | 1.88 | 2.18 | $ 47.41 | $ 98,620 |
| Northwest Colorado nonmetropolitan area | 220 | 1.78 | 2.06 | $ 48.75 | $ 101,390 |
| Northern Vermont nonmetropolitan area | 120 | 1.67 | 1.93 | $ 36.60 | $ 76,130 |
Top paying nonmetropolitan areas for Facilities Managers:
| Nonmetropolitan area | Employment (1) | Employment per thousand jobs | Location quotient (9) | Hourly mean wage | Annual mean wage (2) |
|---|---|---|---|---|---|
| Southwest Alabama nonmetropolitan area | 40 | 0.58 | 0.67 | $ 67.99 | $ 141,410 |
| South Georgia nonmetropolitan area | 90 | 0.45 | 0.52 | $ 57.66 | $ 119,930 |
| Alaska nonmetropolitan area | 370 | 3.57 | 4.12 | $ 57.34 | $ 119,260 |
| Middle Georgia nonmetropolitan area | 70 | 0.55 | 0.63 | $ 56.24 | $ 116,980 |
| Northeast Alabama nonmetropolitan area | 40 | 0.30 | 0.34 | $ 56.21 | $ 116,910 |
These estimates are calculated with data collected from employers in all industry sectors, all metropolitan and nonmetropolitan areas, and all states and the District of Columbia. The top employment and wage figures are provided above. The complete list is available in the downloadable XLS files.
The percentile wage estimate is the value of a wage below which a certain percent of workers fall. The median wage is the 50th percentile wage estimate—50 percent of workers earn less than the median and 50 percent of workers earn more than the median. More about percentile wages.
(1) Estimates for detailed occupations do not sum to the totals because the totals include occupations not shown separately. Estimates do not include self-employed workers.
(2) Annual wages have been calculated by multiplying the hourly mean wage by a "year-round, full-time" hours figure of 2,080 hours; for those occupations where there is not an hourly wage published, the annual wage has been directly calculated from the reported survey data.
(3) The relative standard error (RSE) is a measure of the reliability of a survey statistic. The smaller the relative standard error, the more precise the estimate.
(9) The location quotient is the ratio of the area concentration of occupational employment to the national average concentration. A location quotient greater than one indicates the occupation has a higher share of employment than average, and a location quotient less than one indicates the occupation is less prevalent in the area than average.
Other OEWS estimates and related information:
May 2023 National Occupational Employment and Wage Estimates
May 2023 State Occupational Employment and Wage Estimates
May 2023 Metropolitan and Nonmetropolitan Area Occupational Employment and Wage Estimates
May 2023 National Industry-Specific Occupational Employment and Wage Estimates
Last Modified Date: April 3, 2024