
An official website of the United States government
An official website of the United States government
The .gov means it's official.
Federal government websites often end in .gov or .mil. Before sharing sensitive information,
make sure you're on a federal government site.
The site is secure.
The
https:// ensures that you are connecting to the official website and that any
information you provide is encrypted and transmitted securely.
Plan and direct disaster response or crisis management activities, provide disaster preparedness training, and prepare emergency plans and procedures for natural (e.g., hurricanes, floods, earthquakes), wartime, or technological (e.g., nuclear power plant emergencies or hazardous materials spills) disasters or hostage situations.
Employment estimate and mean wage estimates for Emergency Management Directors:
| Employment (1) | Employment RSE (3) |
Mean hourly wage |
Mean annual wage (2) |
Wage RSE (3) |
|---|---|---|---|---|
| 11,910 | 2.4 % | $ 45.05 | $ 93,690 | 0.5 % |
Percentile wage estimates for Emergency Management Directors:
| Percentile | 10% | 25% | 50% (Median) |
75% | 90% |
|---|---|---|---|---|---|
| Hourly Wage | $ 24.20 | $ 30.11 | $ 40.37 | $ 53.94 | $ 72.87 |
| Annual Wage (2) | $ 50,340 | $ 62,630 | $ 83,960 | $ 112,190 | $ 151,560 |
Industries with the highest published employment and wages for Emergency Management Directors are provided. For a list of all industries with employment in Emergency Management Directors, see the Create Customized Tables function.
Industries with the highest levels of employment in Emergency Management Directors:
| Industry | Employment (1) | Percent of industry employment | Hourly mean wage | Annual mean wage (2) |
|---|---|---|---|---|
| Local Government, excluding Schools and Hospitals (OEWS Designation) | 6,430 | 0.12 | $ 40.74 | $ 84,740 |
| State Government, excluding Schools and Hospitals (OEWS Designation) | 1,810 | 0.09 | $ 36.99 | $ 76,950 |
| General Medical and Surgical Hospitals | 600 | 0.01 | $ 50.59 | $ 105,220 |
| Community Food and Housing, and Emergency and Other Relief Services | 380 | 0.18 | $ 49.33 | $ 102,610 |
| Colleges, Universities, and Professional Schools | 310 | 0.01 | $ 51.36 | $ 106,820 |
Industries with the highest concentration of employment in Emergency Management Directors:
| Industry | Employment (1) | Percent of industry employment | Hourly mean wage | Annual mean wage (2) |
|---|---|---|---|---|
| Community Food and Housing, and Emergency and Other Relief Services | 380 | 0.18 | $ 49.33 | $ 102,610 |
| Petroleum and Coal Products Manufacturing | 170 | 0.16 | $ 55.83 | $ 116,130 |
| Local Government, excluding Schools and Hospitals (OEWS Designation) | 6,430 | 0.12 | $ 40.74 | $ 84,740 |
| State Government, excluding Schools and Hospitals (OEWS Designation) | 1,810 | 0.09 | $ 36.99 | $ 76,950 |
| Electric Power Generation, Transmission and Distribution | 230 | 0.06 | $ 76.66 | $ 159,440 |
Top paying industries for Emergency Management Directors:
| Industry | Employment (1) | Percent of industry employment | Hourly mean wage | Annual mean wage (2) |
|---|---|---|---|---|
| Federal, State, and Local Government, excluding State and Local Government Schools and Hospitals and the U.S. Postal Service (OEWS Designation) | 200 | 0.01 | $ 84.66 | $ 176,080 |
| Architectural, Engineering, and Related Services | 50 | (7) | $ 82.65 | $ 171,920 |
| Electric Power Generation, Transmission and Distribution | 230 | 0.06 | $ 76.66 | $ 159,440 |
| Scientific Research and Development Services | 100 | 0.01 | $ 73.60 | $ 153,080 |
| Natural Gas Distribution | 50 | 0.04 | $ 62.22 | $ 129,410 |
States and areas with the highest published employment, location quotients, and wages for Emergency Management Directors are provided. For a list of all areas with employment in Emergency Management Directors, see the Create Customized Tables function.
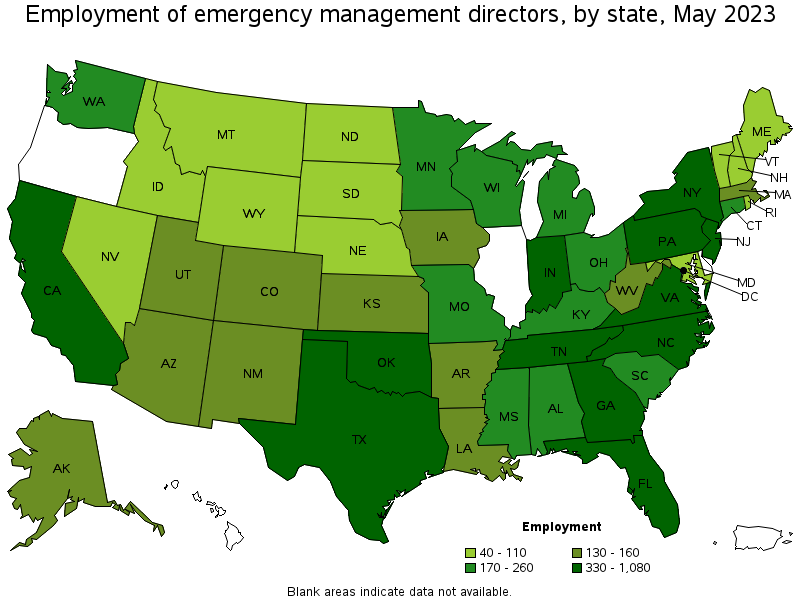
States with the highest employment level in Emergency Management Directors:
| State | Employment (1) | Employment per thousand jobs | Location quotient (9) | Hourly mean wage | Annual mean wage (2) |
|---|---|---|---|---|---|
| Texas | 1,080 | 0.08 | 1.01 | $ 47.57 | $ 98,940 |
| California | 790 | 0.04 | 0.56 | $ 63.26 | $ 131,580 |
| Florida | 570 | 0.06 | 0.76 | $ 49.79 | $ 103,570 |
| New York | 490 | 0.05 | 0.66 | $ 48.66 | $ 101,210 |
| Pennsylvania | 470 | 0.08 | 1.00 | $ 39.22 | $ 81,570 |
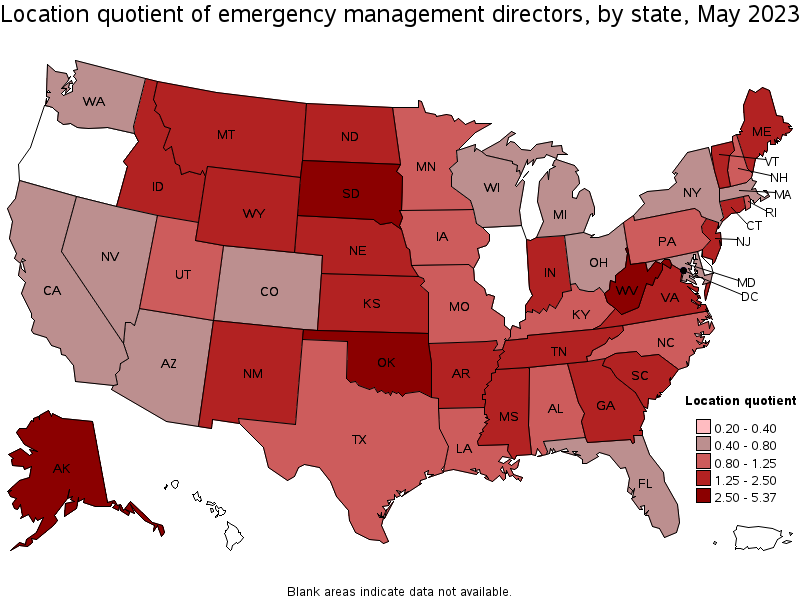
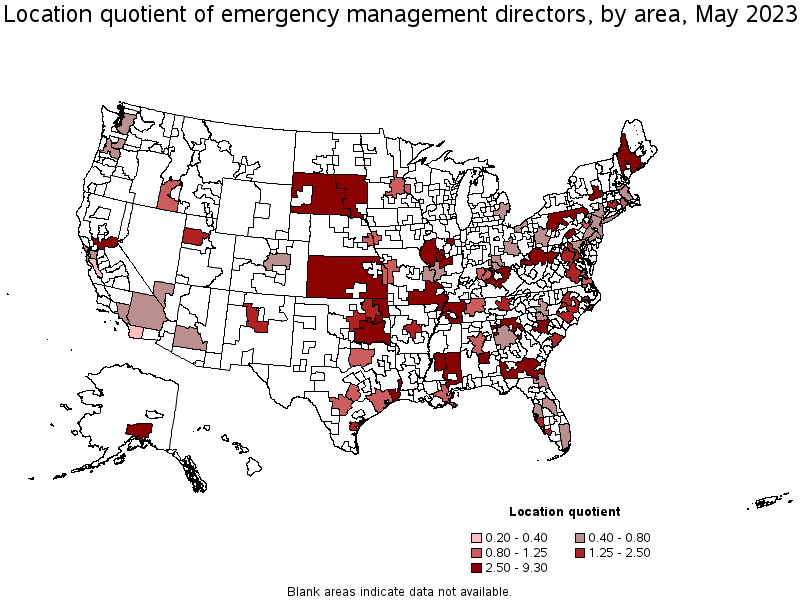
States with the highest concentration of jobs and location quotients in Emergency Management Directors:
| State | Employment (1) | Employment per thousand jobs | Location quotient (9) | Hourly mean wage | Annual mean wage (2) |
|---|---|---|---|---|---|
| Alaska | 130 | 0.42 | 5.37 | $ 54.97 | $ 114,330 |
| South Dakota | 110 | 0.25 | 3.23 | $ 31.87 | $ 66,290 |
| West Virginia | 140 | 0.20 | 2.57 | $ 32.09 | $ 66,750 |
| Oklahoma | 330 | 0.20 | 2.57 | $ 33.84 | $ 70,390 |
| District of Columbia | 140 | 0.20 | 2.50 | $ 80.62 | $ 167,680 |
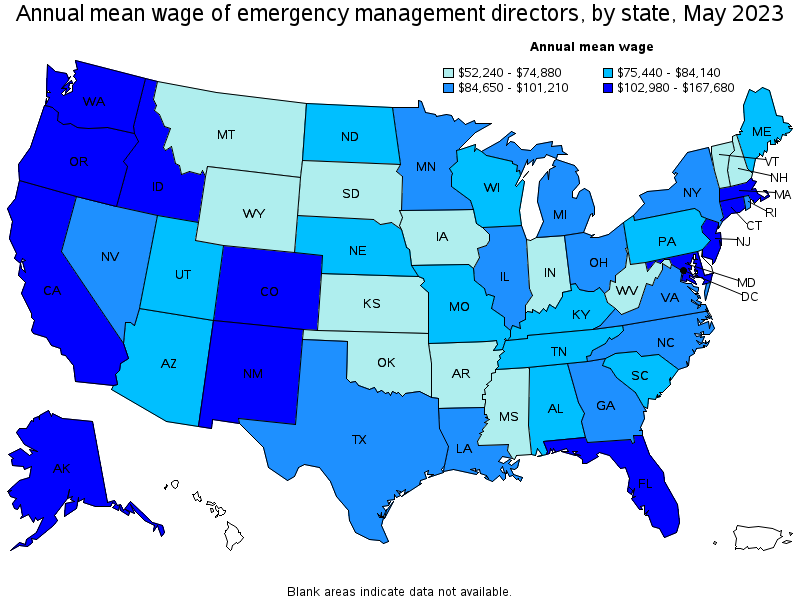
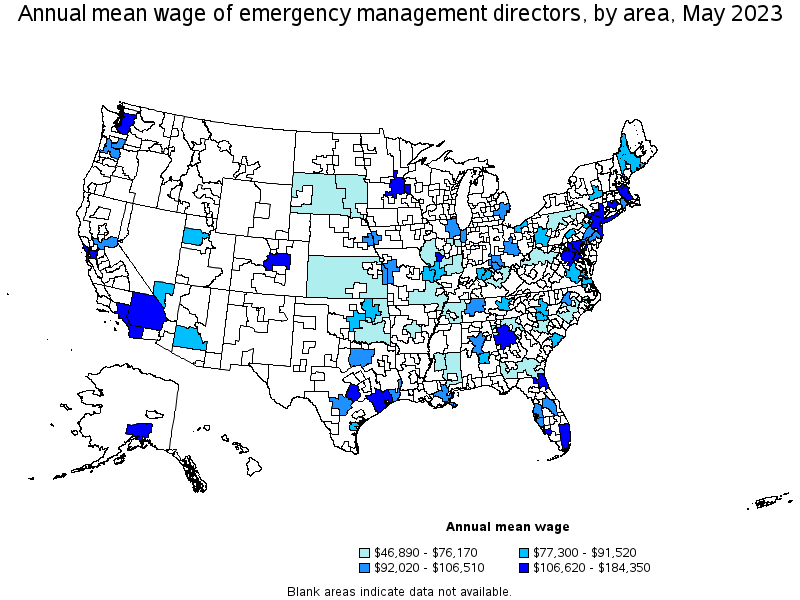
Top paying states for Emergency Management Directors:
| State | Employment (1) | Employment per thousand jobs | Location quotient (9) | Hourly mean wage | Annual mean wage (2) |
|---|---|---|---|---|---|
| District of Columbia | 140 | 0.20 | 2.50 | $ 80.62 | $ 167,680 |
| California | 790 | 0.04 | 0.56 | $ 63.26 | $ 131,580 |
| Washington | 200 | 0.06 | 0.71 | $ 60.67 | $ 126,200 |
| New Jersey | 420 | 0.10 | 1.27 | $ 56.90 | $ 118,360 |
| New Mexico | 130 | 0.15 | 1.94 | $ 56.79 | $ 118,110 |
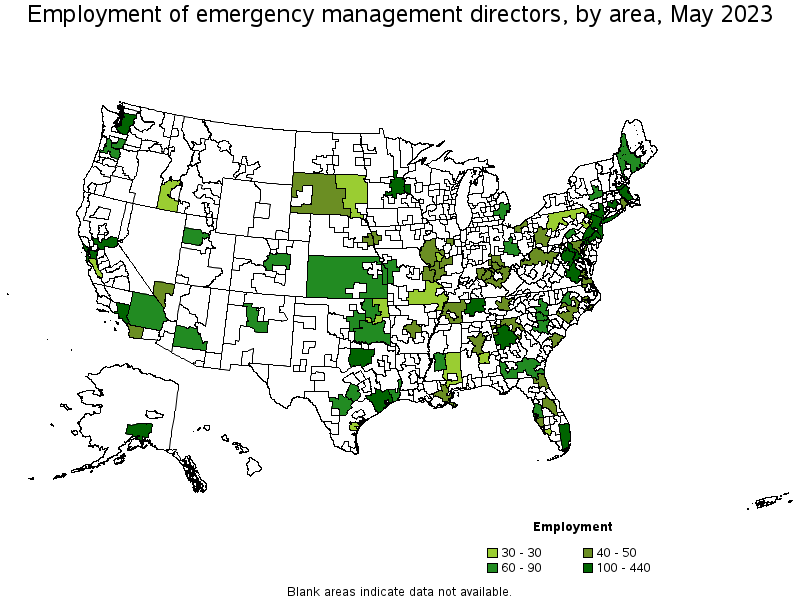
Metropolitan areas with the highest employment level in Emergency Management Directors:
| Metropolitan area | Employment (1) | Employment per thousand jobs | Location quotient (9) | Hourly mean wage | Annual mean wage (2) |
|---|---|---|---|---|---|
| New York-Newark-Jersey City, NY-NJ-PA | 440 | 0.05 | 0.59 | $ 57.17 | $ 118,920 |
| Washington-Arlington-Alexandria, DC-VA-MD-WV | 300 | 0.10 | 1.25 | $ 68.40 | $ 142,270 |
| Dallas-Fort Worth-Arlington, TX | 270 | 0.07 | 0.85 | $ 50.74 | $ 105,540 |
| Houston-The Woodlands-Sugar Land, TX | 260 | 0.08 | 1.04 | $ 52.53 | $ 109,250 |
| Sacramento--Roseville--Arden-Arcade, CA | 230 | 0.22 | 2.84 | $ 49.34 | $ 102,630 |
| Los Angeles-Long Beach-Anaheim, CA | 200 | 0.03 | 0.41 | $ 68.48 | $ 142,430 |
| Philadelphia-Camden-Wilmington, PA-NJ-DE-MD | 170 | 0.06 | 0.77 | $ 49.37 | $ 102,690 |
| Atlanta-Sandy Springs-Roswell, GA | 170 | 0.06 | 0.77 | $ 52.38 | $ 108,960 |
| Miami-Fort Lauderdale-West Palm Beach, FL | 170 | 0.06 | 0.78 | $ 58.04 | $ 120,730 |
| Minneapolis-St. Paul-Bloomington, MN-WI | 150 | 0.08 | 1.00 | $ 52.40 | $ 108,990 |
Metropolitan areas with the highest concentration of jobs and location quotients in Emergency Management Directors:
| Metropolitan area | Employment (1) | Employment per thousand jobs | Location quotient (9) | Hourly mean wage | Annual mean wage (2) |
|---|---|---|---|---|---|
| Anchorage, AK | 100 | 0.58 | 7.44 | $ 52.85 | $ 109,930 |
| Beaumont-Port Arthur, TX | 60 | 0.41 | 5.16 | $ 48.17 | $ 100,200 |
| Jackson, MS | 90 | 0.34 | 4.39 | $ 22.54 | $ 46,890 |
| Springfield, IL | 30 | 0.30 | 3.77 | $ 51.83 | $ 107,800 |
| Harrisburg-Carlisle, PA | 90 | 0.27 | 3.47 | $ 39.97 | $ 83,140 |
| Sacramento--Roseville--Arden-Arcade, CA | 230 | 0.22 | 2.84 | $ 49.34 | $ 102,630 |
| Albany-Schenectady-Troy, NY | 90 | 0.21 | 2.71 | $ 41.79 | $ 86,920 |
| Montgomery, AL | 30 | 0.21 | 2.66 | $ 37.16 | $ 77,300 |
| Columbia, SC | 80 | 0.20 | 2.60 | $ 33.19 | $ 69,040 |
| Tulsa, OK | 90 | 0.19 | 2.47 | $ 38.19 | $ 79,440 |
Top paying metropolitan areas for Emergency Management Directors:
| Metropolitan area | Employment (1) | Employment per thousand jobs | Location quotient (9) | Hourly mean wage | Annual mean wage (2) |
|---|---|---|---|---|---|
| San Francisco-Oakland-Hayward, CA | 100 | 0.04 | 0.53 | $ 88.63 | $ 184,350 |
| Los Angeles-Long Beach-Anaheim, CA | 200 | 0.03 | 0.41 | $ 68.48 | $ 142,430 |
| Washington-Arlington-Alexandria, DC-VA-MD-WV | 300 | 0.10 | 1.25 | $ 68.40 | $ 142,270 |
| Seattle-Tacoma-Bellevue, WA | 120 | 0.06 | 0.75 | $ 66.57 | $ 138,460 |
| Riverside-San Bernardino-Ontario, CA | 60 | 0.04 | 0.46 | $ 61.46 | $ 127,840 |
| San Diego-Carlsbad, CA | 40 | 0.02 | 0.29 | $ 60.48 | $ 125,790 |
| Miami-Fort Lauderdale-West Palm Beach, FL | 170 | 0.06 | 0.78 | $ 58.04 | $ 120,730 |
| Baltimore-Columbia-Towson, MD | 50 | 0.04 | 0.48 | $ 57.71 | $ 120,030 |
| Denver-Aurora-Lakewood, CO | 80 | 0.05 | 0.65 | $ 57.18 | $ 118,930 |
| New York-Newark-Jersey City, NY-NJ-PA | 440 | 0.05 | 0.59 | $ 57.17 | $ 118,920 |
Nonmetropolitan areas with the highest employment in Emergency Management Directors:
| Nonmetropolitan area | Employment (1) | Employment per thousand jobs | Location quotient (9) | Hourly mean wage | Annual mean wage (2) |
|---|---|---|---|---|---|
| Kansas nonmetropolitan area | 90 | 0.22 | 2.87 | $ 26.93 | $ 56,020 |
| Southeast Oklahoma nonmetropolitan area | 80 | 0.48 | 6.17 | $ 30.38 | $ 63,180 |
| South Georgia nonmetropolitan area | 60 | 0.33 | 4.19 | $ 32.01 | $ 66,570 |
| Southwest Maine nonmetropolitan area | 60 | 0.30 | 3.80 | $ 40.41 | $ 84,050 |
| West Tennessee nonmetropolitan area | 50 | 0.41 | 5.25 | $ 26.66 | $ 55,460 |
Nonmetropolitan areas with the highest concentration of jobs and location quotients in Emergency Management Directors:
| Nonmetropolitan area | Employment (1) | Employment per thousand jobs | Location quotient (9) | Hourly mean wage | Annual mean wage (2) |
|---|---|---|---|---|---|
| West South Dakota nonmetropolitan area | 50 | 0.73 | 9.30 | $ 32.86 | $ 68,350 |
| Southeast Oklahoma nonmetropolitan area | 80 | 0.48 | 6.17 | $ 30.38 | $ 63,180 |
| West Tennessee nonmetropolitan area | 50 | 0.41 | 5.25 | $ 26.66 | $ 55,460 |
| South Georgia nonmetropolitan area | 60 | 0.33 | 4.19 | $ 32.01 | $ 66,570 |
| Northern West Virginia nonmetropolitan area | 40 | 0.31 | 4.00 | $ 29.77 | $ 61,930 |
Top paying nonmetropolitan areas for Emergency Management Directors:
| Nonmetropolitan area | Employment (1) | Employment per thousand jobs | Location quotient (9) | Hourly mean wage | Annual mean wage (2) |
|---|---|---|---|---|---|
| Southwest Maine nonmetropolitan area | 60 | 0.30 | 3.80 | $ 40.41 | $ 84,050 |
| Southeast Missouri nonmetropolitan area | 30 | 0.21 | 2.63 | $ 36.62 | $ 76,170 |
| Southeast Coastal North Carolina nonmetropolitan area | 40 | 0.17 | 2.22 | $ 35.84 | $ 74,540 |
| North Georgia nonmetropolitan area | 50 | 0.23 | 2.99 | $ 33.69 | $ 70,080 |
| West South Dakota nonmetropolitan area | 50 | 0.73 | 9.30 | $ 32.86 | $ 68,350 |
These estimates are calculated with data collected from employers in all industry sectors, all metropolitan and nonmetropolitan areas, and all states and the District of Columbia. The top employment and wage figures are provided above. The complete list is available in the downloadable XLS files.
The percentile wage estimate is the value of a wage below which a certain percent of workers fall. The median wage is the 50th percentile wage estimate—50 percent of workers earn less than the median and 50 percent of workers earn more than the median. More about percentile wages.
(1) Estimates for detailed occupations do not sum to the totals because the totals include occupations not shown separately. Estimates do not include self-employed workers.
(2) Annual wages have been calculated by multiplying the hourly mean wage by a "year-round, full-time" hours figure of 2,080 hours; for those occupations where there is not an hourly wage published, the annual wage has been directly calculated from the reported survey data.
(3) The relative standard error (RSE) is a measure of the reliability of a survey statistic. The smaller the relative standard error, the more precise the estimate.
(7) The value is less than .005 percent of industry employment.
(9) The location quotient is the ratio of the area concentration of occupational employment to the national average concentration. A location quotient greater than one indicates the occupation has a higher share of employment than average, and a location quotient less than one indicates the occupation is less prevalent in the area than average.
Other OEWS estimates and related information:
May 2023 National Occupational Employment and Wage Estimates
May 2023 State Occupational Employment and Wage Estimates
May 2023 Metropolitan and Nonmetropolitan Area Occupational Employment and Wage Estimates
May 2023 National Industry-Specific Occupational Employment and Wage Estimates
Last Modified Date: April 3, 2024