
An official website of the United States government
An official website of the United States government
The .gov means it's official.
Federal government websites often end in .gov or .mil. Before sharing sensitive information,
make sure you're on a federal government site.
The site is secure.
The
https:// ensures that you are connecting to the official website and that any
information you provide is encrypted and transmitted securely.
Execute or adapt procedures and techniques for calibrating measurement devices, by applying knowledge of measurement science, mathematics, physics, chemistry, and electronics, sometimes under the direction of engineering staff. Determine measurement standard suitability for calibrating measurement devices. May perform preventive maintenance on equipment. May perform corrective actions to address identified calibration problems. Excludes �Medical Equipment Preparers� (31-9093) and �Timing Device Assemblers and Adjusters� (51-2061).
Employment estimate and mean wage estimates for Calibration Technologists and Technicians:
| Employment (1) | Employment RSE (3) |
Mean hourly wage |
Mean annual wage (2) |
Wage RSE (3) |
|---|---|---|---|---|
| 13,220 | 4.1 % | $ 32.39 | $ 67,360 | 1.6 % |
Percentile wage estimates for Calibration Technologists and Technicians:
| Percentile | 10% | 25% | 50% (Median) |
75% | 90% |
|---|---|---|---|---|---|
| Hourly Wage | $ 20.37 | $ 24.06 | $ 30.19 | $ 38.06 | $ 48.48 |
| Annual Wage (2) | $ 42,370 | $ 50,050 | $ 62,790 | $ 79,170 | $ 100,850 |
Industries with the highest published employment and wages for Calibration Technologists and Technicians are provided. For a list of all industries with employment in Calibration Technologists and Technicians, see the Create Customized Tables function.
Industries with the highest levels of employment in Calibration Technologists and Technicians:
| Industry | Employment (1) | Percent of industry employment | Hourly mean wage | Annual mean wage (2) |
|---|---|---|---|---|
| Architectural, Engineering, and Related Services | 3,130 | 0.19 | $ 28.19 | $ 58,630 |
| Navigational, Measuring, Electromedical, and Control Instruments Manufacturing | 1,240 | 0.29 | $ 28.79 | $ 59,890 |
| Electronic and Precision Equipment Repair and Maintenance | 990 | 0.94 | $ 31.32 | $ 65,140 |
| Aerospace Product and Parts Manufacturing | 730 | 0.14 | $ 38.07 | $ 79,180 |
| Medical Equipment and Supplies Manufacturing | 500 | 0.15 | $ 28.98 | $ 60,270 |
Industries with the highest concentration of employment in Calibration Technologists and Technicians:
| Industry | Employment (1) | Percent of industry employment | Hourly mean wage | Annual mean wage (2) |
|---|---|---|---|---|
| Electronic and Precision Equipment Repair and Maintenance | 990 | 0.94 | $ 31.32 | $ 65,140 |
| Pipeline Transportation of Crude Oil | 110 | 0.91 | $ 49.06 | $ 102,050 |
| Other Pipeline Transportation | 60 | 0.74 | $ 47.77 | $ 99,360 |
| Pipeline Transportation of Natural Gas | 180 | 0.56 | $ 48.45 | $ 100,780 |
| Navigational, Measuring, Electromedical, and Control Instruments Manufacturing | 1,240 | 0.29 | $ 28.79 | $ 59,890 |
Top paying industries for Calibration Technologists and Technicians:
| Industry | Employment (1) | Percent of industry employment | Hourly mean wage | Annual mean wage (2) |
|---|---|---|---|---|
| Petroleum and Coal Products Manufacturing | 110 | 0.10 | $ 51.15 | $ 106,390 |
| Electric Power Generation, Transmission and Distribution | 70 | 0.02 | $ 49.87 | $ 103,730 |
| Pipeline Transportation of Crude Oil | 110 | 0.91 | $ 49.06 | $ 102,050 |
| Pipeline Transportation of Natural Gas | 180 | 0.56 | $ 48.45 | $ 100,780 |
| Other Pipeline Transportation | 60 | 0.74 | $ 47.77 | $ 99,360 |
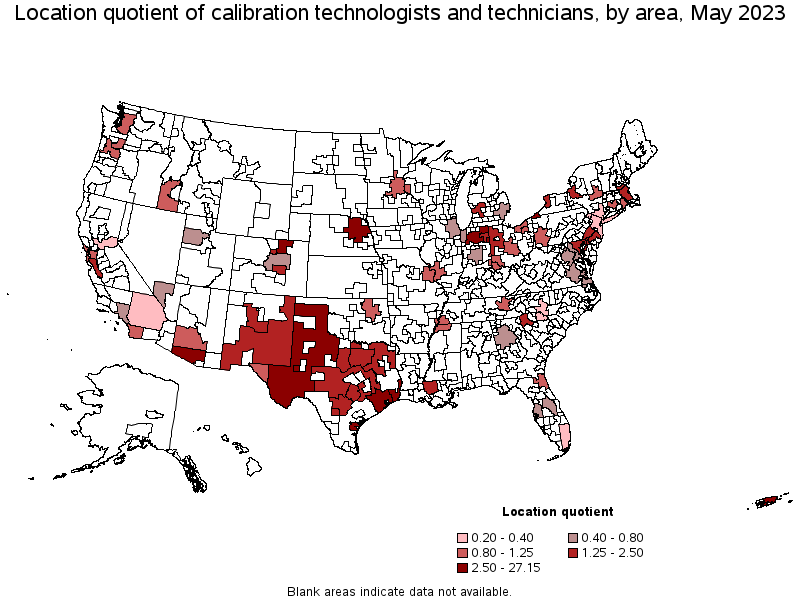
States and areas with the highest published employment, location quotients, and wages for Calibration Technologists and Technicians are provided. For a list of all areas with employment in Calibration Technologists and Technicians, see the Create Customized Tables function.
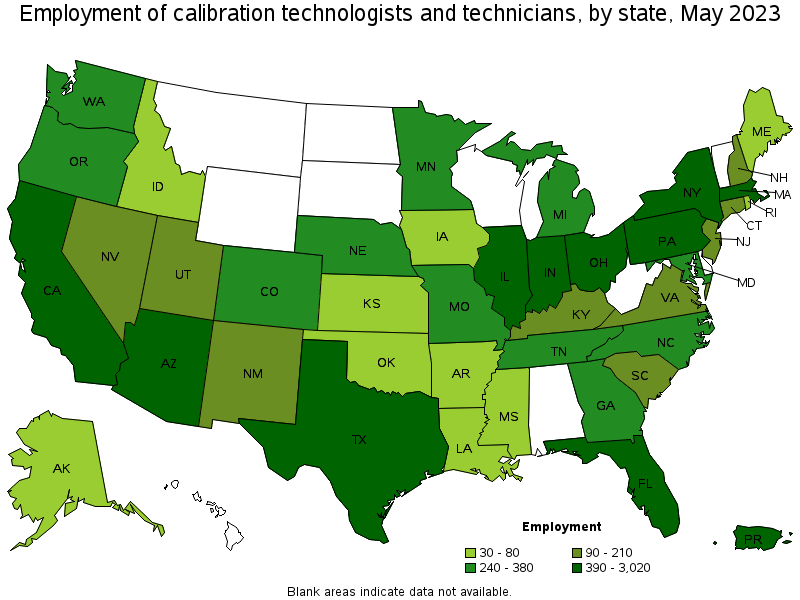
States with the highest employment level in Calibration Technologists and Technicians:
| State | Employment (1) | Employment per thousand jobs | Location quotient (9) | Hourly mean wage | Annual mean wage (2) |
|---|---|---|---|---|---|
| Texas | 3,020 | 0.22 | 2.56 | $ 33.90 | $ 70,510 |
| California | 1,120 | 0.06 | 0.72 | $ 32.09 | $ 66,740 |
| Pennsylvania | 880 | 0.15 | 1.69 | $ 27.42 | $ 57,040 |
| Ohio | 570 | 0.10 | 1.20 | $ 30.74 | $ 63,940 |
| Florida | 470 | 0.05 | 0.57 | $ 30.24 | $ 62,910 |
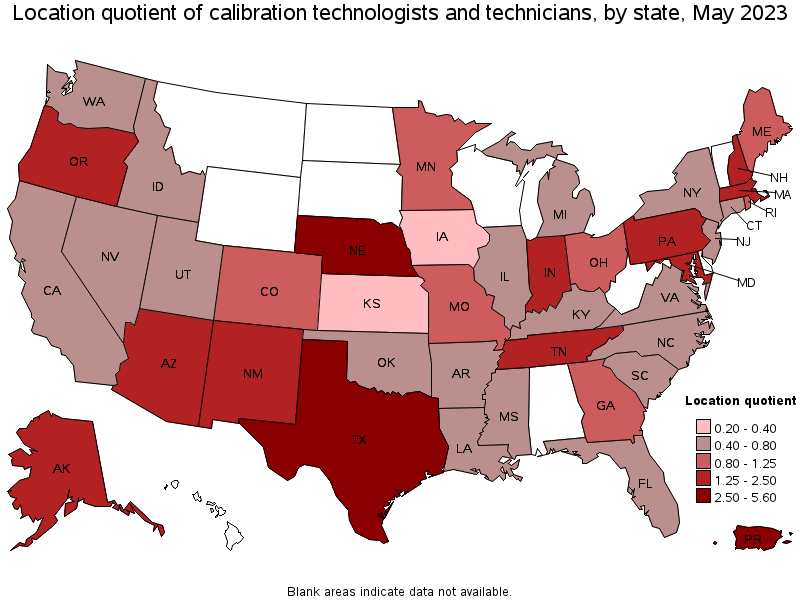
States with the highest concentration of jobs and location quotients in Calibration Technologists and Technicians:
| State | Employment (1) | Employment per thousand jobs | Location quotient (9) | Hourly mean wage | Annual mean wage (2) |
|---|---|---|---|---|---|
| Nebraska | 260 | 0.26 | 2.94 | $ 27.40 | $ 56,980 |
| Texas | 3,020 | 0.22 | 2.56 | $ 33.90 | $ 70,510 |
| New Mexico | 160 | 0.19 | 2.19 | $ 30.57 | $ 63,580 |
| New Hampshire | 100 | 0.15 | 1.78 | $ 30.30 | $ 63,030 |
| Pennsylvania | 880 | 0.15 | 1.69 | $ 27.42 | $ 57,040 |
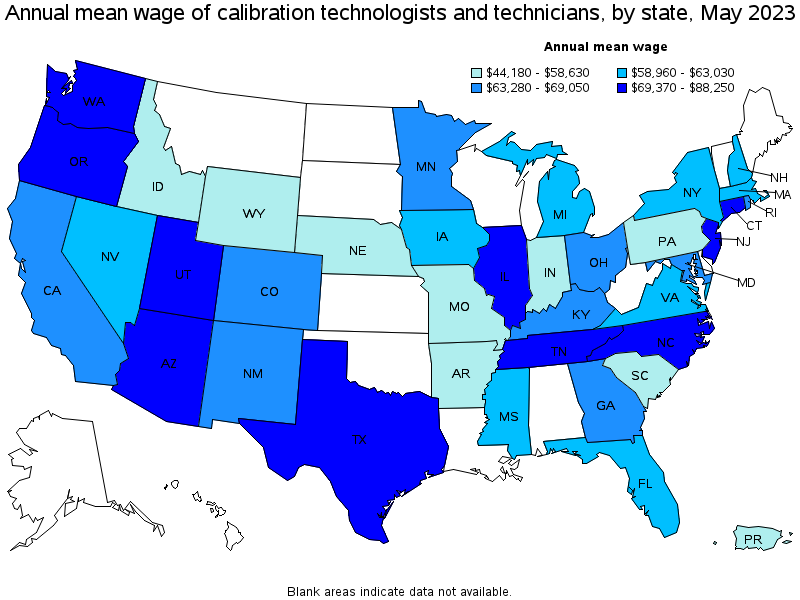
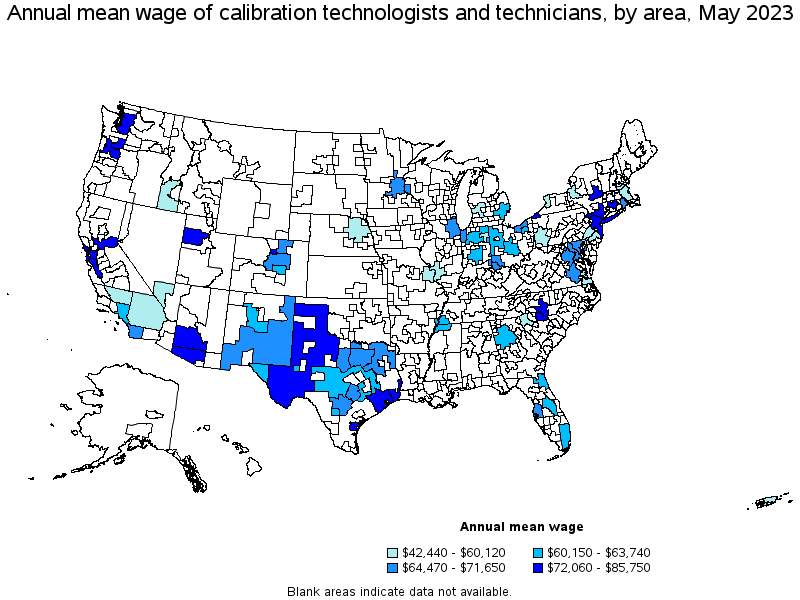
Top paying states for Calibration Technologists and Technicians:
| State | Employment (1) | Employment per thousand jobs | Location quotient (9) | Hourly mean wage | Annual mean wage (2) |
|---|---|---|---|---|---|
| New Jersey | 210 | 0.05 | 0.57 | $ 42.43 | $ 88,250 |
| Utah | 90 | 0.05 | 0.62 | $ 42.01 | $ 87,380 |
| Washington | 240 | 0.07 | 0.79 | $ 39.95 | $ 83,100 |
| Connecticut | 110 | 0.06 | 0.73 | $ 37.87 | $ 78,760 |
| Oregon | 240 | 0.12 | 1.41 | $ 37.33 | $ 77,650 |
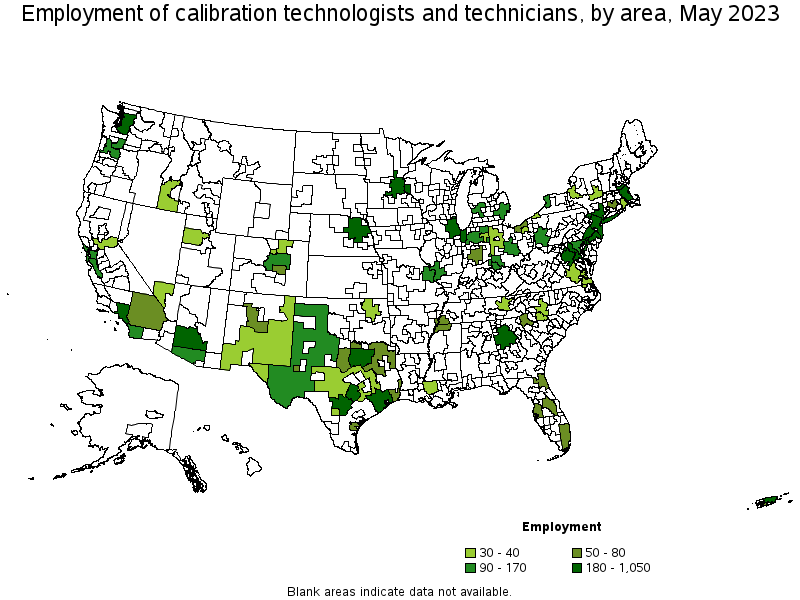
Metropolitan areas with the highest employment level in Calibration Technologists and Technicians:
| Metropolitan area | Employment (1) | Employment per thousand jobs | Location quotient (9) | Hourly mean wage | Annual mean wage (2) |
|---|---|---|---|---|---|
| Houston-The Woodlands-Sugar Land, TX | 1,050 | 0.33 | 3.80 | $ 35.97 | $ 74,810 |
| Dallas-Fort Worth-Arlington, TX | 620 | 0.16 | 1.80 | $ 30.99 | $ 64,470 |
| Boston-Cambridge-Nashua, MA-NH | 410 | 0.15 | 1.71 | $ 28.91 | $ 60,120 |
| Los Angeles-Long Beach-Anaheim, CA | 380 | 0.06 | 0.71 | $ 30.36 | $ 63,140 |
| Philadelphia-Camden-Wilmington, PA-NJ-DE-MD | 320 | 0.11 | 1.31 | $ 28.79 | $ 59,890 |
| New York-Newark-Jersey City, NY-NJ-PA | 290 | 0.03 | 0.35 | $ 39.27 | $ 81,690 |
| Chicago-Naperville-Elgin, IL-IN-WI | 240 | 0.05 | 0.62 | $ 32.37 | $ 67,340 |
| Austin-Round Rock, TX | 230 | 0.19 | 2.17 | $ 32.24 | $ 67,070 |
| San Antonio-New Braunfels, TX | 210 | 0.19 | 2.22 | $ 31.99 | $ 66,530 |
| Phoenix-Mesa-Scottsdale, AZ | 210 | 0.09 | 1.06 | $ 36.77 | $ 76,480 |
Metropolitan areas with the highest concentration of jobs and location quotients in Calibration Technologists and Technicians:
| Metropolitan area | Employment (1) | Employment per thousand jobs | Location quotient (9) | Hourly mean wage | Annual mean wage (2) |
|---|---|---|---|---|---|
| Odessa, TX | 50 | 0.70 | 8.07 | $ 29.10 | $ 60,520 |
| Beaumont-Port Arthur, TX | 60 | 0.41 | 4.74 | $ 41.11 | $ 85,520 |
| Greeley, CO | 40 | 0.35 | 3.99 | $ 32.07 | $ 66,700 |
| Erie, PA | 40 | 0.35 | 3.99 | $ 34.82 | $ 72,430 |
| Houston-The Woodlands-Sugar Land, TX | 1,050 | 0.33 | 3.80 | $ 35.97 | $ 74,810 |
| Tucson, AZ | 120 | 0.30 | 3.47 | $ 35.05 | $ 72,900 |
| Corpus Christi, TX | 50 | 0.29 | 3.35 | $ 40.89 | $ 85,040 |
| Boulder, CO | 40 | 0.21 | 2.43 | $ 36.18 | $ 75,260 |
| Buffalo-Cheektowaga-Niagara Falls, NY | 110 | 0.20 | 2.35 | $ 26.05 | $ 54,190 |
| Fort Wayne, IN | 40 | 0.20 | 2.30 | $ 25.62 | $ 53,290 |
Top paying metropolitan areas for Calibration Technologists and Technicians:
| Metropolitan area | Employment (1) | Employment per thousand jobs | Location quotient (9) | Hourly mean wage | Annual mean wage (2) |
|---|---|---|---|---|---|
| Seattle-Tacoma-Bellevue, WA | 200 | 0.10 | 1.11 | $ 41.22 | $ 85,750 |
| Beaumont-Port Arthur, TX | 60 | 0.41 | 4.74 | $ 41.11 | $ 85,520 |
| Corpus Christi, TX | 50 | 0.29 | 3.35 | $ 40.89 | $ 85,040 |
| New York-Newark-Jersey City, NY-NJ-PA | 290 | 0.03 | 0.35 | $ 39.27 | $ 81,690 |
| San Francisco-Oakland-Hayward, CA | 170 | 0.07 | 0.80 | $ 38.67 | $ 80,430 |
| Hartford-West Hartford-East Hartford, CT | 60 | 0.11 | 1.24 | $ 38.11 | $ 79,270 |
| Albany-Schenectady-Troy, NY | 30 | 0.07 | 0.82 | $ 37.31 | $ 77,600 |
| Charlotte-Concord-Gastonia, NC-SC | 30 | 0.02 | 0.28 | $ 36.77 | $ 76,490 |
| Phoenix-Mesa-Scottsdale, AZ | 210 | 0.09 | 1.06 | $ 36.77 | $ 76,480 |
| Portland-Vancouver-Hillsboro, OR-WA | 120 | 0.10 | 1.10 | $ 36.68 | $ 76,290 |
Nonmetropolitan areas with the highest employment in Calibration Technologists and Technicians:
| Nonmetropolitan area | Employment (1) | Employment per thousand jobs | Location quotient (9) | Hourly mean wage | Annual mean wage (2) |
|---|---|---|---|---|---|
| Northeast Nebraska nonmetropolitan area | 220 | 2.36 | 27.15 | $ 27.08 | $ 56,330 |
| West Texas Region of Texas nonmetropolitan area | 110 | 0.58 | 6.64 | $ 40.91 | $ 85,100 |
| Northern Indiana nonmetropolitan area | 90 | 0.43 | 4.99 | $ 30.41 | $ 63,260 |
| North Texas Region of Texas nonmetropolitan area | 50 | 0.18 | 2.04 | $ 34.45 | $ 71,650 |
| West Northwestern Ohio nonmetropolitan area | 40 | 0.18 | 2.05 | $ 29.64 | $ 61,640 |
Nonmetropolitan areas with the highest concentration of jobs and location quotients in Calibration Technologists and Technicians:
| Nonmetropolitan area | Employment (1) | Employment per thousand jobs | Location quotient (9) | Hourly mean wage | Annual mean wage (2) |
|---|---|---|---|---|---|
| Northeast Nebraska nonmetropolitan area | 220 | 2.36 | 27.15 | $ 27.08 | $ 56,330 |
| West Texas Region of Texas nonmetropolitan area | 110 | 0.58 | 6.64 | $ 40.91 | $ 85,100 |
| Northern Indiana nonmetropolitan area | 90 | 0.43 | 4.99 | $ 30.41 | $ 63,260 |
| Eastern New Mexico nonmetropolitan area | 30 | 0.22 | 2.47 | $ 33.03 | $ 68,700 |
| Hill Country Region of Texas nonmetropolitan area | 40 | 0.20 | 2.27 | $ 28.92 | $ 60,150 |
Top paying nonmetropolitan areas for Calibration Technologists and Technicians:
| Nonmetropolitan area | Employment (1) | Employment per thousand jobs | Location quotient (9) | Hourly mean wage | Annual mean wage (2) |
|---|---|---|---|---|---|
| West Texas Region of Texas nonmetropolitan area | 110 | 0.58 | 6.64 | $ 40.91 | $ 85,100 |
| North Texas Region of Texas nonmetropolitan area | 50 | 0.18 | 2.04 | $ 34.45 | $ 71,650 |
| Eastern New Mexico nonmetropolitan area | 30 | 0.22 | 2.47 | $ 33.03 | $ 68,700 |
| Northern Indiana nonmetropolitan area | 90 | 0.43 | 4.99 | $ 30.41 | $ 63,260 |
| West Northwestern Ohio nonmetropolitan area | 40 | 0.18 | 2.05 | $ 29.64 | $ 61,640 |
These estimates are calculated with data collected from employers in all industry sectors, all metropolitan and nonmetropolitan areas, and all states and the District of Columbia. The top employment and wage figures are provided above. The complete list is available in the downloadable XLS files.
The percentile wage estimate is the value of a wage below which a certain percent of workers fall. The median wage is the 50th percentile wage estimate—50 percent of workers earn less than the median and 50 percent of workers earn more than the median. More about percentile wages.
(1) Estimates for detailed occupations do not sum to the totals because the totals include occupations not shown separately. Estimates do not include self-employed workers.
(2) Annual wages have been calculated by multiplying the hourly mean wage by a "year-round, full-time" hours figure of 2,080 hours; for those occupations where there is not an hourly wage published, the annual wage has been directly calculated from the reported survey data.
(3) The relative standard error (RSE) is a measure of the reliability of a survey statistic. The smaller the relative standard error, the more precise the estimate.
(9) The location quotient is the ratio of the area concentration of occupational employment to the national average concentration. A location quotient greater than one indicates the occupation has a higher share of employment than average, and a location quotient less than one indicates the occupation is less prevalent in the area than average.
Other OEWS estimates and related information:
May 2023 National Occupational Employment and Wage Estimates
May 2023 State Occupational Employment and Wage Estimates
May 2023 Metropolitan and Nonmetropolitan Area Occupational Employment and Wage Estimates
May 2023 National Industry-Specific Occupational Employment and Wage Estimates
Last Modified Date: April 3, 2024