
An official website of the United States government
An official website of the United States government
The .gov means it's official.
Federal government websites often end in .gov or .mil. Before sharing sensitive information,
make sure you're on a federal government site.
The site is secure.
The
https:// ensures that you are connecting to the official website and that any
information you provide is encrypted and transmitted securely.
Perform laboratory and field tests to monitor the environment and investigate sources of pollution, including those that affect health, under the direction of an environmental scientist, engineer, or other specialist. May collect samples of gases, soil, water, and other materials for testing.
Employment estimate and mean wage estimates for Environmental Science and Protection Technicians, Including Health:
| Employment (1) | Employment RSE (3) |
Mean hourly wage |
Mean annual wage (2) |
Wage RSE (3) |
|---|---|---|---|---|
| 32,390 | 2.8 % | $ 27.63 | $ 57,470 | 1.1 % |
Percentile wage estimates for Environmental Science and Protection Technicians, Including Health:
| Percentile | 10% | 25% | 50% (Median) |
75% | 90% |
|---|---|---|---|---|---|
| Hourly Wage | $ 17.21 | $ 20.09 | $ 24.35 | $ 31.40 | $ 40.87 |
| Annual Wage (2) | $ 35,800 | $ 41,790 | $ 50,660 | $ 65,310 | $ 85,010 |
Industries with the highest published employment and wages for Environmental Science and Protection Technicians, Including Health are provided. For a list of all industries with employment in Environmental Science and Protection Technicians, Including Health, see the Create Customized Tables function.
Industries with the highest levels of employment in Environmental Science and Protection Technicians, Including Health:
| Industry | Employment (1) | Percent of industry employment | Hourly mean wage | Annual mean wage (2) |
|---|---|---|---|---|
| Management, Scientific, and Technical Consulting Services | 7,020 | 0.38 | $ 28.27 | $ 58,800 |
| Architectural, Engineering, and Related Services | 6,970 | 0.42 | $ 24.77 | $ 51,510 |
| Local Government, excluding Schools and Hospitals (OEWS Designation) | 6,170 | 0.11 | $ 30.03 | $ 62,460 |
| State Government, excluding Schools and Hospitals (OEWS Designation) | 2,380 | 0.11 | $ 27.10 | $ 56,360 |
| Scientific Research and Development Services | 1,620 | 0.18 | $ 24.34 | $ 50,620 |
Industries with the highest concentration of employment in Environmental Science and Protection Technicians, Including Health:
| Industry | Employment (1) | Percent of industry employment | Hourly mean wage | Annual mean wage (2) |
|---|---|---|---|---|
| Waste Treatment and Disposal | 860 | 0.85 | $ 24.66 | $ 51,300 |
| Remediation and Other Waste Management Services | 1,420 | 0.79 | $ 32.71 | $ 68,030 |
| Architectural, Engineering, and Related Services | 6,970 | 0.42 | $ 24.77 | $ 51,510 |
| Management, Scientific, and Technical Consulting Services | 7,020 | 0.38 | $ 28.27 | $ 58,800 |
| Social Advocacy Organizations | 760 | 0.30 | $ 27.61 | $ 57,420 |
Top paying industries for Environmental Science and Protection Technicians, Including Health:
| Industry | Employment (1) | Percent of industry employment | Hourly mean wage | Annual mean wage (2) |
|---|---|---|---|---|
| Electric Power Generation, Transmission and Distribution | 320 | 0.08 | $ 45.82 | $ 95,300 |
| Oil and Gas Extraction | 90 | 0.08 | $ 42.42 | $ 88,240 |
| Natural Gas Distribution | 40 | 0.03 | $ 40.06 | $ 83,320 |
| Pharmaceutical and Medicine Manufacturing | 70 | 0.02 | $ 39.57 | $ 82,310 |
| Petroleum and Coal Products Manufacturing | 40 | 0.03 | $ 38.58 | $ 80,240 |
States and areas with the highest published employment, location quotients, and wages for Environmental Science and Protection Technicians, Including Health are provided. For a list of all areas with employment in Environmental Science and Protection Technicians, Including Health, see the Create Customized Tables function.
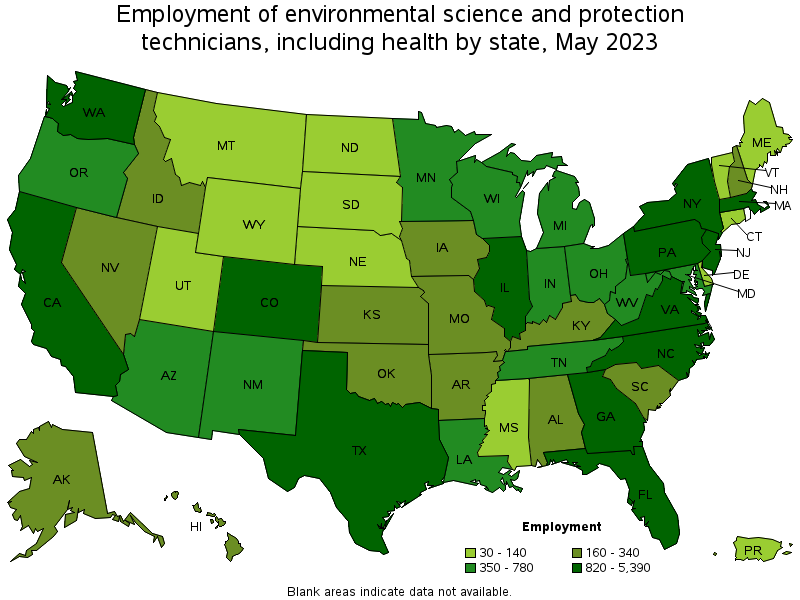
States with the highest employment level in Environmental Science and Protection Technicians, Including Health:
| State | Employment (1) | Employment per thousand jobs | Location quotient (9) | Hourly mean wage | Annual mean wage (2) |
|---|---|---|---|---|---|
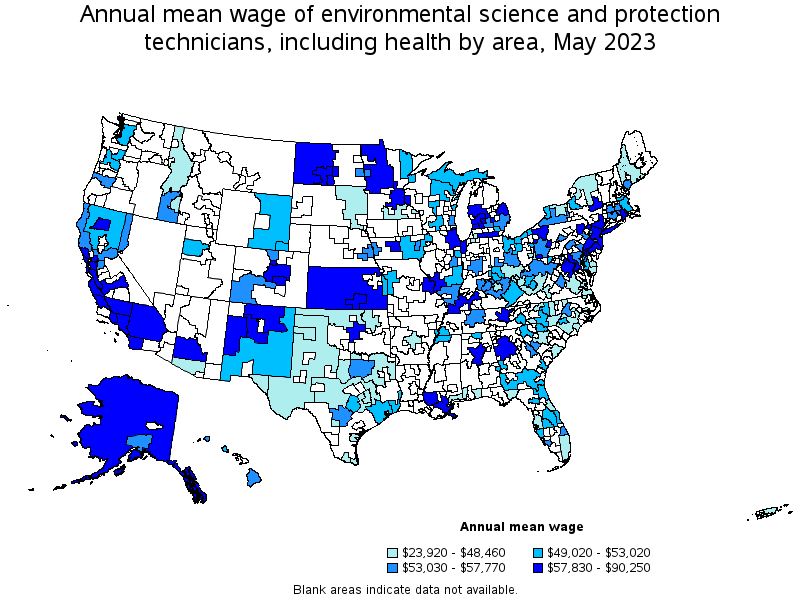
| California | 5,390 | 0.30 | 1.41 | $ 33.02 | $ 68,680 |
| Texas | 2,950 | 0.22 | 1.02 | $ 24.23 | $ 50,410 |
| Florida | 2,350 | 0.25 | 1.15 | $ 24.12 | $ 50,170 |
| New York | 1,950 | 0.21 | 0.97 | $ 27.14 | $ 56,450 |
| North Carolina | 1,150 | 0.24 | 1.12 | $ 23.62 | $ 49,120 |
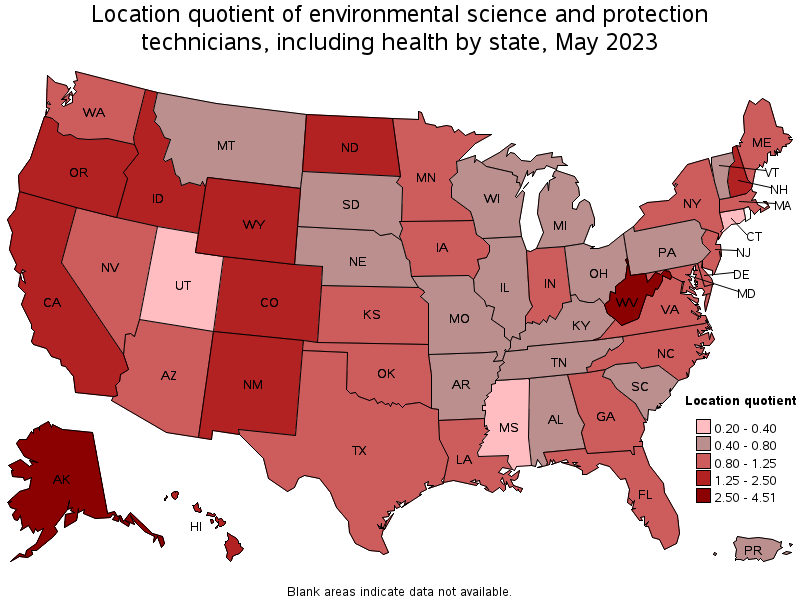
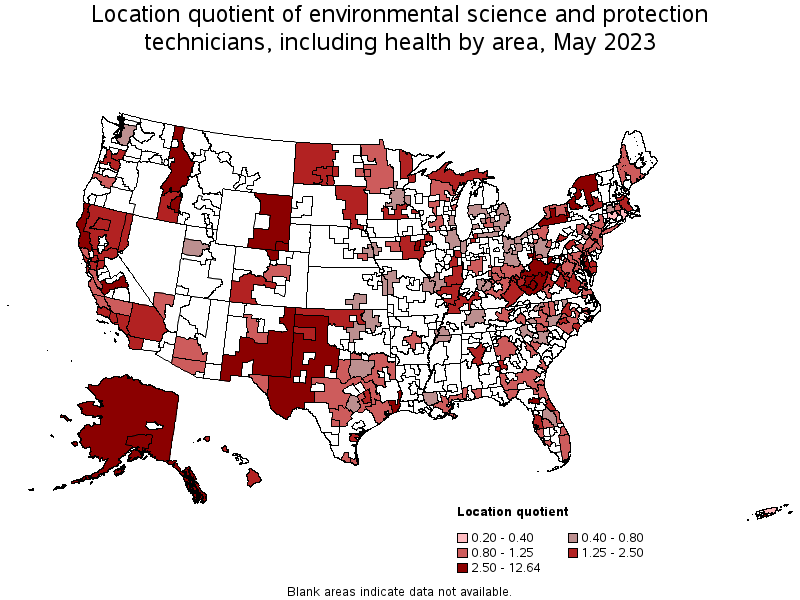
States with the highest concentration of jobs and location quotients in Environmental Science and Protection Technicians, Including Health:
| State | Employment (1) | Employment per thousand jobs | Location quotient (9) | Hourly mean wage | Annual mean wage (2) |
|---|---|---|---|---|---|
| Alaska | 300 | 0.96 | 4.51 | $ 28.63 | $ 59,540 |
| West Virginia | 530 | 0.77 | 3.59 | $ 24.29 | $ 50,530 |
| Wyoming | 140 | 0.52 | 2.42 | $ 25.50 | $ 53,040 |
| New Mexico | 350 | 0.41 | 1.93 | $ 29.97 | $ 62,330 |
| Idaho | 250 | 0.30 | 1.42 | $ 23.08 | $ 48,010 |
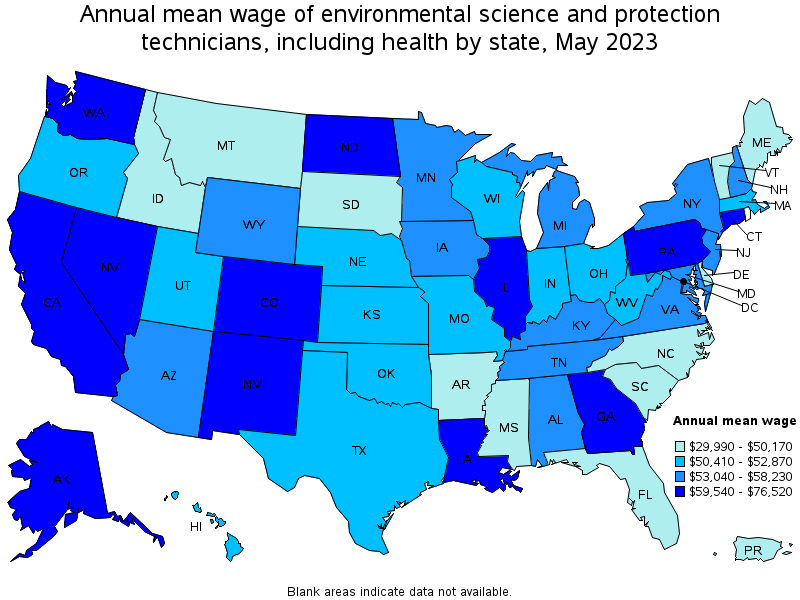
Top paying states for Environmental Science and Protection Technicians, Including Health:
| State | Employment (1) | Employment per thousand jobs | Location quotient (9) | Hourly mean wage | Annual mean wage (2) |
|---|---|---|---|---|---|
| District of Columbia | (8) | (8) | (8) | $ 36.79 | $ 76,520 |
| Washington | 930 | 0.27 | 1.24 | $ 36.21 | $ 75,320 |
| Connecticut | 100 | 0.06 | 0.28 | $ 33.87 | $ 70,460 |
| Louisiana | 370 | 0.20 | 0.93 | $ 33.06 | $ 68,770 |
| California | 5,390 | 0.30 | 1.41 | $ 33.02 | $ 68,680 |
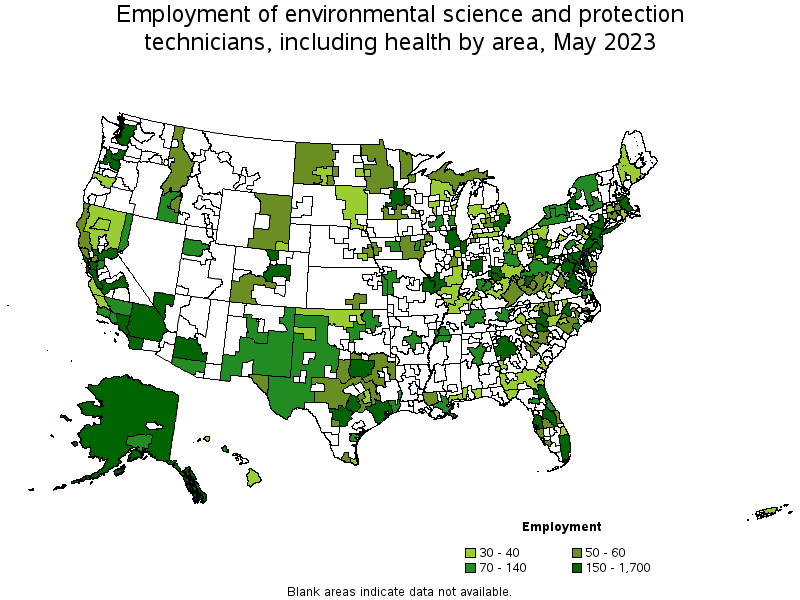
Metropolitan areas with the highest employment level in Environmental Science and Protection Technicians, Including Health:
| Metropolitan area | Employment (1) | Employment per thousand jobs | Location quotient (9) | Hourly mean wage | Annual mean wage (2) |
|---|---|---|---|---|---|
| Los Angeles-Long Beach-Anaheim, CA | 1,700 | 0.27 | 1.29 | $ 33.37 | $ 69,410 |
| New York-Newark-Jersey City, NY-NJ-PA | 1,630 | 0.17 | 0.80 | $ 27.89 | $ 58,000 |
| San Francisco-Oakland-Hayward, CA | 820 | 0.34 | 1.59 | $ 43.39 | $ 90,250 |
| Houston-The Woodlands-Sugar Land, TX | 810 | 0.25 | 1.19 | $ 24.31 | $ 50,560 |
| Boston-Cambridge-Nashua, MA-NH | 760 | 0.28 | 1.30 | $ 25.06 | $ 52,110 |
| Washington-Arlington-Alexandria, DC-VA-MD-WV | 650 | 0.21 | 0.98 | $ 32.37 | $ 67,320 |
| Tampa-St. Petersburg-Clearwater, FL | 630 | 0.45 | 2.10 | $ 21.61 | $ 44,960 |
| Chicago-Naperville-Elgin, IL-IN-WI | 630 | 0.14 | 0.66 | $ 29.31 | $ 60,960 |
| Dallas-Fort Worth-Arlington, TX | 630 | 0.16 | 0.74 | $ 25.85 | $ 53,770 |
| Atlanta-Sandy Springs-Roswell, GA | 540 | 0.19 | 0.90 | $ 30.33 | $ 63,090 |
Metropolitan areas with the highest concentration of jobs and location quotients in Environmental Science and Protection Technicians, Including Health:
| Metropolitan area | Employment (1) | Employment per thousand jobs | Location quotient (9) | Hourly mean wage | Annual mean wage (2) |
|---|---|---|---|---|---|
| Beckley, WV | 60 | 1.50 | 7.04 | $ 23.90 | $ 49,710 |
| Charleston, WV | 150 | 1.49 | 6.99 | $ 24.57 | $ 51,100 |
| Fort Collins, CO | 220 | 1.25 | 5.85 | $ 27.13 | $ 56,430 |
| Iowa City, IA | 80 | 0.87 | 4.07 | $ 27.18 | $ 56,530 |
| Wheeling, WV-OH | 50 | 0.77 | 3.61 | $ 19.77 | $ 41,130 |
| Anchorage, AK | 120 | 0.73 | 3.40 | $ 27.34 | $ 56,870 |
| Fresno, CA | 270 | 0.67 | 3.15 | $ 32.86 | $ 68,350 |
| Gainesville, FL | 90 | 0.66 | 3.11 | $ 23.81 | $ 49,530 |
| Cheyenne, WY | 30 | 0.66 | 3.10 | $ 24.64 | $ 51,250 |
| Trenton, NJ | 140 | 0.60 | 2.83 | $ 25.98 | $ 54,030 |
Top paying metropolitan areas for Environmental Science and Protection Technicians, Including Health:
| Metropolitan area | Employment (1) | Employment per thousand jobs | Location quotient (9) | Hourly mean wage | Annual mean wage (2) |
|---|---|---|---|---|---|
| San Francisco-Oakland-Hayward, CA | 820 | 0.34 | 1.59 | $ 43.39 | $ 90,250 |
| New Orleans-Metairie, LA | 120 | 0.23 | 1.09 | $ 35.62 | $ 74,080 |
| Baton Rouge, LA | 50 | 0.12 | 0.56 | $ 35.49 | $ 73,830 |
| Los Angeles-Long Beach-Anaheim, CA | 1,700 | 0.27 | 1.29 | $ 33.37 | $ 69,410 |
| Fresno, CA | 270 | 0.67 | 3.15 | $ 32.86 | $ 68,350 |
| Washington-Arlington-Alexandria, DC-VA-MD-WV | 650 | 0.21 | 0.98 | $ 32.37 | $ 67,320 |
| Albuquerque, NM | 100 | 0.25 | 1.15 | $ 32.34 | $ 67,270 |
| Salinas, CA | 30 | 0.18 | 0.84 | $ 32.14 | $ 66,840 |
| Colorado Springs, CO | (8) | (8) | (8) | $ 31.62 | $ 65,770 |
| San Jose-Sunnyvale-Santa Clara, CA | 240 | 0.21 | 0.97 | $ 31.56 | $ 65,640 |
Nonmetropolitan areas with the highest employment in Environmental Science and Protection Technicians, Including Health:
| Nonmetropolitan area | Employment (1) | Employment per thousand jobs | Location quotient (9) | Hourly mean wage | Annual mean wage (2) |
|---|---|---|---|---|---|
| Maryland nonmetropolitan area | 160 | 2.70 | 12.64 | $ 24.37 | $ 50,680 |
| Alaska nonmetropolitan area | 150 | 1.48 | 6.93 | $ 29.38 | $ 61,110 |
| West Texas Region of Texas nonmetropolitan area | 130 | 0.65 | 3.07 | $ 23.04 | $ 47,930 |
| Capital/Northern New York nonmetropolitan area | 130 | 0.92 | 4.32 | $ 19.92 | $ 41,430 |
| Northern West Virginia nonmetropolitan area | 120 | 0.86 | 4.02 | $ 26.22 | $ 54,540 |
Nonmetropolitan areas with the highest concentration of jobs and location quotients in Environmental Science and Protection Technicians, Including Health:
| Nonmetropolitan area | Employment (1) | Employment per thousand jobs | Location quotient (9) | Hourly mean wage | Annual mean wage (2) |
|---|---|---|---|---|---|
| Maryland nonmetropolitan area | 160 | 2.70 | 12.64 | $ 24.37 | $ 50,680 |
| Alaska nonmetropolitan area | 150 | 1.48 | 6.93 | $ 29.38 | $ 61,110 |
| Capital/Northern New York nonmetropolitan area | 130 | 0.92 | 4.32 | $ 19.92 | $ 41,430 |
| Northern West Virginia nonmetropolitan area | 120 | 0.86 | 4.02 | $ 26.22 | $ 54,540 |
| Southern West Virginia nonmetropolitan area | 50 | 0.75 | 3.52 | $ 21.58 | $ 44,890 |
Top paying nonmetropolitan areas for Environmental Science and Protection Technicians, Including Health:
| Nonmetropolitan area | Employment (1) | Employment per thousand jobs | Location quotient (9) | Hourly mean wage | Annual mean wage (2) |
|---|---|---|---|---|---|
| Balance of Lower Peninsula of Michigan nonmetropolitan area | 40 | 0.14 | 0.63 | $ 35.21 | $ 73,230 |
| Northern New Mexico nonmetropolitan area | (8) | (8) | (8) | $ 33.52 | $ 69,720 |
| West North Dakota nonmetropolitan area | 50 | 0.42 | 1.95 | $ 31.00 | $ 64,480 |
| Alaska nonmetropolitan area | 150 | 1.48 | 6.93 | $ 29.38 | $ 61,110 |
| Kansas nonmetropolitan area | (8) | (8) | (8) | $ 29.09 | $ 60,510 |
These estimates are calculated with data collected from employers in all industry sectors, all metropolitan and nonmetropolitan areas, and all states and the District of Columbia. The top employment and wage figures are provided above. The complete list is available in the downloadable XLS files.
The percentile wage estimate is the value of a wage below which a certain percent of workers fall. The median wage is the 50th percentile wage estimate—50 percent of workers earn less than the median and 50 percent of workers earn more than the median. More about percentile wages.
(1) Estimates for detailed occupations do not sum to the totals because the totals include occupations not shown separately. Estimates do not include self-employed workers.
(2) Annual wages have been calculated by multiplying the hourly mean wage by a "year-round, full-time" hours figure of 2,080 hours; for those occupations where there is not an hourly wage published, the annual wage has been directly calculated from the reported survey data.
(3) The relative standard error (RSE) is a measure of the reliability of a survey statistic. The smaller the relative standard error, the more precise the estimate.
(8) Estimate not released.
(9) The location quotient is the ratio of the area concentration of occupational employment to the national average concentration. A location quotient greater than one indicates the occupation has a higher share of employment than average, and a location quotient less than one indicates the occupation is less prevalent in the area than average.
Other OEWS estimates and related information:
May 2023 National Occupational Employment and Wage Estimates
May 2023 State Occupational Employment and Wage Estimates
May 2023 Metropolitan and Nonmetropolitan Area Occupational Employment and Wage Estimates
May 2023 National Industry-Specific Occupational Employment and Wage Estimates
Last Modified Date: April 3, 2024