
An official website of the United States government
An official website of the United States government
The .gov means it's official.
Federal government websites often end in .gov or .mil. Before sharing sensitive information,
make sure you're on a federal government site.
The site is secure.
The
https:// ensures that you are connecting to the official website and that any
information you provide is encrypted and transmitted securely.
Coordinate or design programs and conduct outreach to promote the religious education or activities of a denominational group. May provide counseling, guidance, and leadership relative to marital, health, financial, and religious problems.
Employment estimate and mean wage estimates for Directors, Religious Activities and Education:
| Employment (1) | Employment RSE (3) |
Mean hourly wage |
Mean annual wage (2) |
Wage RSE (3) |
|---|---|---|---|---|
| 23,270 | 4.1 % | $ 29.68 | $ 61,740 | 2.2 % |
Percentile wage estimates for Directors, Religious Activities and Education:
| Percentile | 10% | 25% | 50% (Median) |
75% | 90% |
|---|---|---|---|---|---|
| Hourly Wage | $ 15.40 | $ 18.82 | $ 24.11 | $ 33.94 | $ 50.21 |
| Annual Wage (2) | $ 32,030 | $ 39,150 | $ 50,140 | $ 70,600 | $ 104,430 |
Industries with the highest published employment and wages for Directors, Religious Activities and Education are provided. For a list of all industries with employment in Directors, Religious Activities and Education, see the Create Customized Tables function.
Industries with the highest levels of employment in Directors, Religious Activities and Education:
| Industry | Employment (1) | Percent of industry employment | Hourly mean wage | Annual mean wage (2) |
|---|---|---|---|---|
| Religious Organizations | 19,000 | 9.73 | $ 28.89 | $ 60,090 |
| Colleges, Universities, and Professional Schools | 1,220 | 0.04 | $ 33.36 | $ 69,380 |
| Elementary and Secondary Schools | 1,050 | 0.01 | $ 26.08 | $ 54,240 |
| General Medical and Surgical Hospitals | 250 | 0.00 | $ 46.53 | $ 96,790 |
| Child Care Services | 220 | 0.02 | (8) | (8) |
Industries with the highest concentration of employment in Directors, Religious Activities and Education:
| Industry | Employment (1) | Percent of industry employment | Hourly mean wage | Annual mean wage (2) |
|---|---|---|---|---|
| Religious Organizations | 19,000 | 9.73 | $ 28.89 | $ 60,090 |
| Grantmaking and Giving Services | 70 | 0.05 | $ 27.74 | $ 57,690 |
| Civic and Social Organizations | 180 | 0.05 | $ 23.64 | $ 49,180 |
| Colleges, Universities, and Professional Schools | 1,220 | 0.04 | $ 33.36 | $ 69,380 |
| Community Food and Housing, and Emergency and Other Relief Services | 60 | 0.03 | $ 26.91 | $ 55,970 |
Top paying industries for Directors, Religious Activities and Education:
| Industry | Employment (1) | Percent of industry employment | Hourly mean wage | Annual mean wage (2) |
|---|---|---|---|---|
| Federal, State, and Local Government, excluding State and Local Government Schools and Hospitals and the U.S. Postal Service (OEWS Designation) | 120 | 0.01 | $ 54.47 | $ 113,290 |
| General Medical and Surgical Hospitals | 250 | (7) | $ 46.53 | $ 96,790 |
| Management of Companies and Enterprises | 210 | 0.01 | $ 41.41 | $ 86,130 |
| Colleges, Universities, and Professional Schools | 1,220 | 0.04 | $ 33.36 | $ 69,380 |
| Religious Organizations | 19,000 | 9.73 | $ 28.89 | $ 60,090 |
States and areas with the highest published employment, location quotients, and wages for Directors, Religious Activities and Education are provided. For a list of all areas with employment in Directors, Religious Activities and Education, see the Create Customized Tables function.
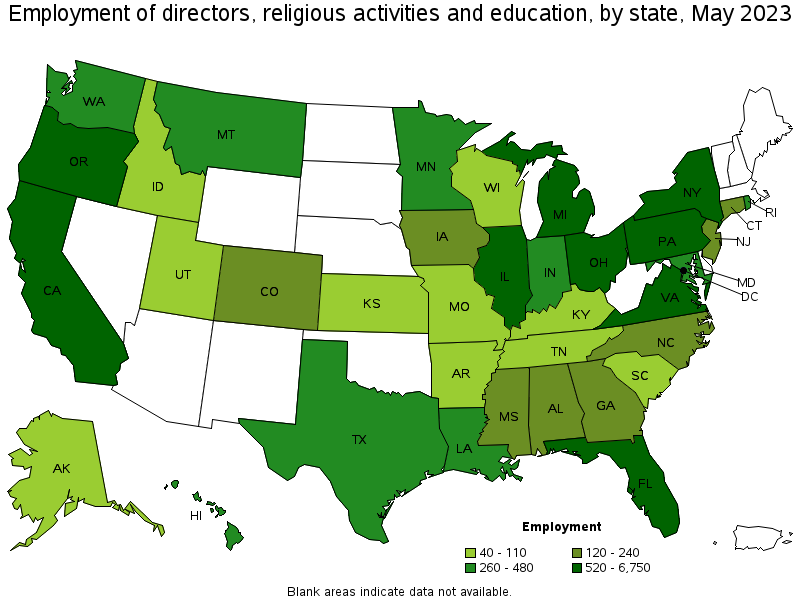
States with the highest employment level in Directors, Religious Activities and Education:
| State | Employment (1) | Employment per thousand jobs | Location quotient (9) | Hourly mean wage | Annual mean wage (2) |
|---|---|---|---|---|---|
| New York | 6,750 | 0.72 | 4.69 | $ 31.75 | $ 66,030 |
| California | 3,930 | 0.22 | 1.43 | $ 36.95 | $ 76,850 |
| Oregon | 1,770 | 0.91 | 5.95 | $ 23.54 | $ 48,970 |
| Florida | 980 | 0.10 | 0.67 | $ 27.04 | $ 56,230 |
| Pennsylvania | 930 | 0.16 | 1.02 | $ 24.85 | $ 51,690 |
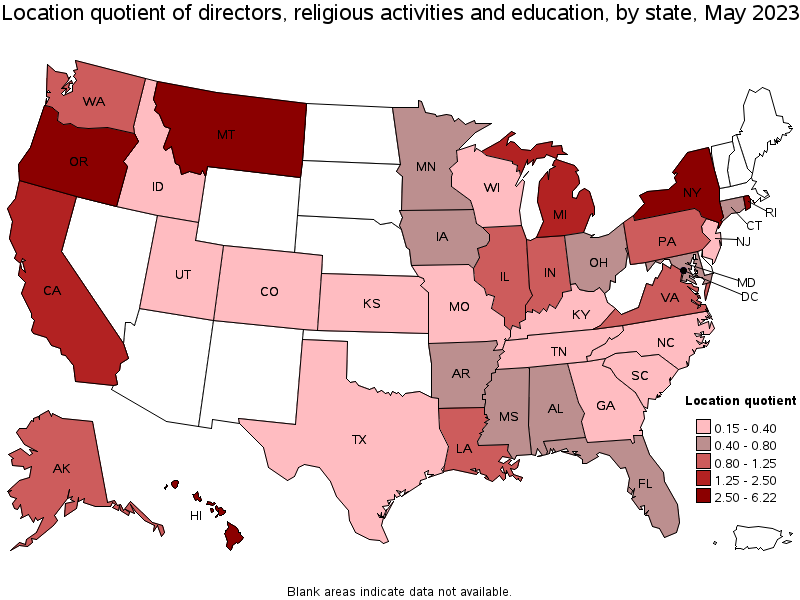
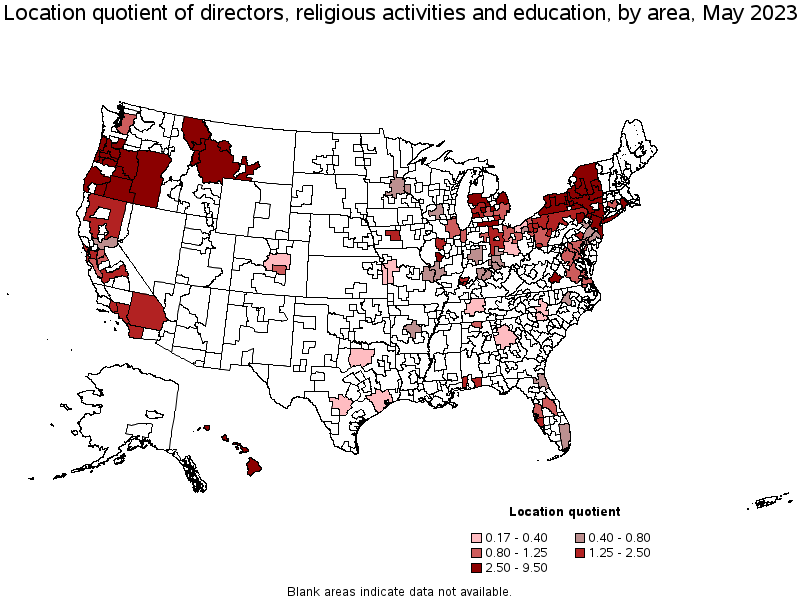
States with the highest concentration of jobs and location quotients in Directors, Religious Activities and Education:
| State | Employment (1) | Employment per thousand jobs | Location quotient (9) | Hourly mean wage | Annual mean wage (2) |
|---|---|---|---|---|---|
| Montana | 480 | 0.95 | 6.22 | $ 17.89 | $ 37,200 |
| Oregon | 1,770 | 0.91 | 5.95 | $ 23.54 | $ 48,970 |
| Hawaii | 480 | 0.77 | 5.05 | $ 27.14 | $ 56,460 |
| New York | 6,750 | 0.72 | 4.69 | $ 31.75 | $ 66,030 |
| Rhode Island | 280 | 0.57 | 3.69 | $ 19.09 | $ 39,710 |
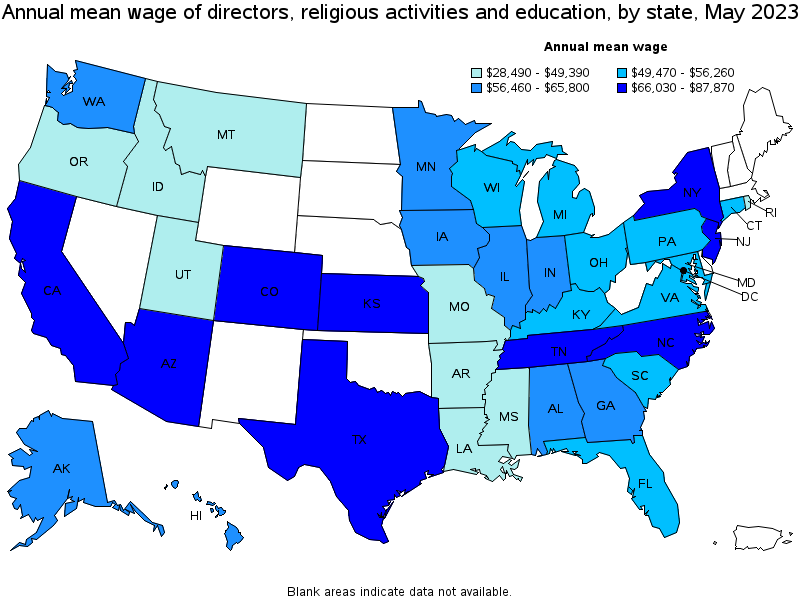
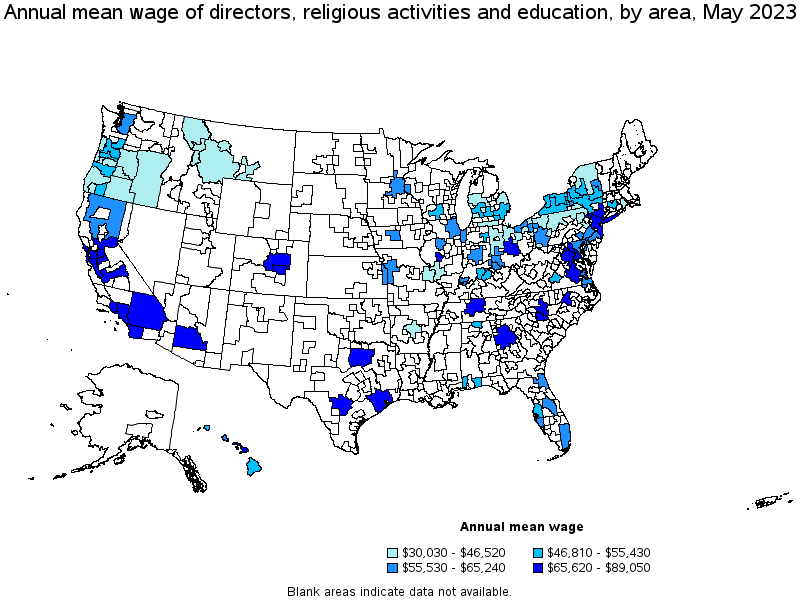
Top paying states for Directors, Religious Activities and Education:
| State | Employment (1) | Employment per thousand jobs | Location quotient (9) | Hourly mean wage | Annual mean wage (2) |
|---|---|---|---|---|---|
| District of Columbia | 160 | 0.22 | 1.46 | $ 42.24 | $ 87,870 |
| California | 3,930 | 0.22 | 1.43 | $ 36.95 | $ 76,850 |
| Arizona | (8) | (8) | (8) | $ 36.28 | $ 75,470 |
| Tennessee | 110 | 0.03 | 0.21 | $ 35.86 | $ 74,600 |
| Colorado | 120 | 0.04 | 0.28 | $ 35.50 | $ 73,840 |
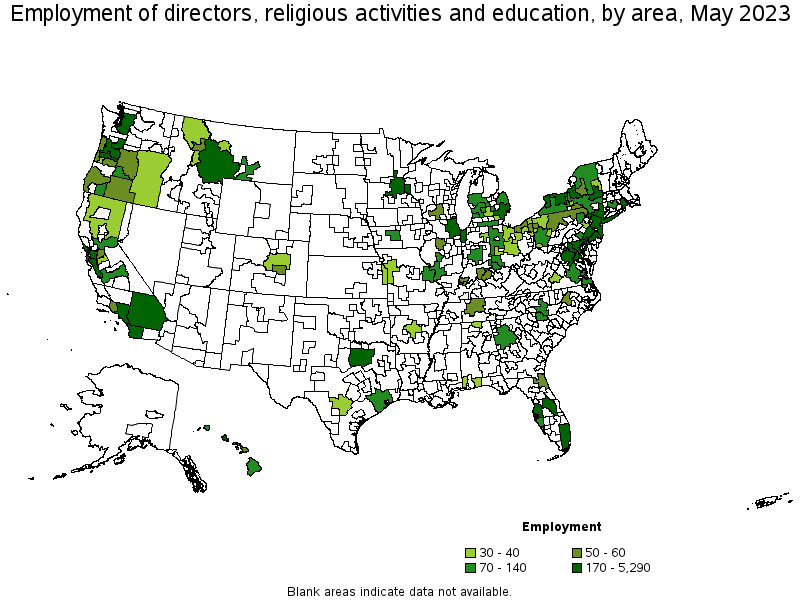
Metropolitan areas with the highest employment level in Directors, Religious Activities and Education:
| Metropolitan area | Employment (1) | Employment per thousand jobs | Location quotient (9) | Hourly mean wage | Annual mean wage (2) |
|---|---|---|---|---|---|
| New York-Newark-Jersey City, NY-NJ-PA | 5,290 | 0.56 | 3.64 | $ 33.73 | $ 70,160 |
| Los Angeles-Long Beach-Anaheim, CA | 1,870 | 0.30 | 1.97 | $ 37.28 | $ 77,530 |
| Portland-Vancouver-Hillsboro, OR-WA | 950 | 0.79 | 5.14 | $ 24.99 | $ 51,970 |
| Chicago-Naperville-Elgin, IL-IN-WI | 650 | 0.14 | 0.94 | $ 28.22 | $ 58,700 |
| San Francisco-Oakland-Hayward, CA | 490 | 0.20 | 1.33 | $ 41.87 | $ 87,090 |
| Washington-Arlington-Alexandria, DC-VA-MD-WV | 420 | 0.14 | 0.88 | $ 31.62 | $ 65,770 |
| Seattle-Tacoma-Bellevue, WA | 390 | 0.19 | 1.23 | $ 27.85 | $ 57,930 |
| Buffalo-Cheektowaga-Niagara Falls, NY | 380 | 0.72 | 4.68 | $ 25.41 | $ 52,850 |
| Riverside-San Bernardino-Ontario, CA | 350 | 0.21 | 1.36 | $ 33.11 | $ 68,870 |
| Detroit-Warren-Dearborn, MI | 330 | 0.17 | 1.14 | $ 26.65 | $ 55,430 |
Metropolitan areas with the highest concentration of jobs and location quotients in Directors, Religious Activities and Education:
| Metropolitan area | Employment (1) | Employment per thousand jobs | Location quotient (9) | Hourly mean wage | Annual mean wage (2) |
|---|---|---|---|---|---|
| Bend-Redmond, OR | 130 | 1.46 | 9.50 | $ 22.08 | $ 45,920 |
| Billings, MT | 130 | 1.42 | 9.29 | $ 18.35 | $ 38,160 |
| Salem, OR | 220 | 1.23 | 8.02 | $ 22.67 | $ 47,160 |
| Medford, OR | 100 | 1.18 | 7.69 | $ 23.28 | $ 48,430 |
| Corvallis, OR | 40 | 1.03 | 6.73 | $ 19.09 | $ 39,700 |
| Albany, OR | 50 | 1.03 | 6.70 | $ 20.00 | $ 41,600 |
| Great Falls, MT | 30 | 0.87 | 5.69 | $ 18.58 | $ 38,640 |
| Glens Falls, NY | 40 | 0.86 | 5.63 | $ 28.35 | $ 58,960 |
| Missoula, MT | 50 | 0.83 | 5.39 | $ 18.94 | $ 39,390 |
| Ithaca, NY | 40 | 0.79 | 5.18 | $ 27.90 | $ 58,030 |
Top paying metropolitan areas for Directors, Religious Activities and Education:
| Metropolitan area | Employment (1) | Employment per thousand jobs | Location quotient (9) | Hourly mean wage | Annual mean wage (2) |
|---|---|---|---|---|---|
| Springfield, IL | 80 | 0.77 | 5.02 | $ 42.81 | $ 89,050 |
| Nashville-Davidson--Murfreesboro--Franklin, TN | 50 | 0.04 | 0.28 | $ 42.50 | $ 88,400 |
| San Francisco-Oakland-Hayward, CA | 490 | 0.20 | 1.33 | $ 41.87 | $ 87,090 |
| San Jose-Sunnyvale-Santa Clara, CA | 210 | 0.19 | 1.21 | $ 39.83 | $ 82,840 |
| Los Angeles-Long Beach-Anaheim, CA | 1,870 | 0.30 | 1.97 | $ 37.28 | $ 77,530 |
| Phoenix-Mesa-Scottsdale, AZ | (8) | (8) | (8) | $ 36.02 | $ 74,910 |
| San Diego-Carlsbad, CA | 320 | 0.21 | 1.36 | $ 35.83 | $ 74,520 |
| Charlotte-Concord-Gastonia, NC-SC | 70 | 0.05 | 0.33 | $ 35.57 | $ 73,990 |
| Colorado Springs, CO | 50 | 0.17 | 1.13 | $ 35.32 | $ 73,460 |
| Sacramento--Roseville--Arden-Arcade, CA | 110 | 0.11 | 0.71 | $ 35.23 | $ 73,270 |
Nonmetropolitan areas with the highest employment in Directors, Religious Activities and Education:
| Nonmetropolitan area | Employment (1) | Employment per thousand jobs | Location quotient (9) | Hourly mean wage | Annual mean wage (2) |
|---|---|---|---|---|---|
| Southwest Montana nonmetropolitan area | 200 | 1.30 | 8.46 | $ 16.55 | $ 34,420 |
| Balance of Lower Peninsula of Michigan nonmetropolitan area | 140 | 0.52 | 3.39 | $ 19.77 | $ 41,130 |
| Southwest New York nonmetropolitan area | 110 | 0.63 | 4.13 | $ 22.50 | $ 46,810 |
| Hawaii / Kauai nonmetropolitan area | 100 | 1.03 | 6.69 | $ 24.52 | $ 51,010 |
| West Northwestern Ohio nonmetropolitan area | 80 | 0.32 | 2.08 | $ 21.15 | $ 43,990 |
Nonmetropolitan areas with the highest concentration of jobs and location quotients in Directors, Religious Activities and Education:
| Nonmetropolitan area | Employment (1) | Employment per thousand jobs | Location quotient (9) | Hourly mean wage | Annual mean wage (2) |
|---|---|---|---|---|---|
| Southwest Montana nonmetropolitan area | 200 | 1.30 | 8.46 | $ 16.55 | $ 34,420 |
| Hawaii / Kauai nonmetropolitan area | 100 | 1.03 | 6.69 | $ 24.52 | $ 51,010 |
| Central Oregon nonmetropolitan area | 60 | 0.95 | 6.22 | $ 20.05 | $ 41,710 |
| Southwest New York nonmetropolitan area | 110 | 0.63 | 4.13 | $ 22.50 | $ 46,810 |
| Balance of Lower Peninsula of Michigan nonmetropolitan area | 140 | 0.52 | 3.39 | $ 19.77 | $ 41,130 |
Top paying nonmetropolitan areas for Directors, Religious Activities and Education:
| Nonmetropolitan area | Employment (1) | Employment per thousand jobs | Location quotient (9) | Hourly mean wage | Annual mean wage (2) |
|---|---|---|---|---|---|
| North Valley-Northern Mountains Region of California nonmetropolitan area | 30 | 0.32 | 2.07 | $ 28.71 | $ 59,730 |
| Hawaii / Kauai nonmetropolitan area | 100 | 1.03 | 6.69 | $ 24.52 | $ 51,010 |
| Central East New York nonmetropolitan area | 70 | 0.46 | 3.02 | $ 24.42 | $ 50,790 |
| Southwest New York nonmetropolitan area | 110 | 0.63 | 4.13 | $ 22.50 | $ 46,810 |
| Coast Oregon nonmetropolitan area | 60 | 0.52 | 3.37 | $ 22.21 | $ 46,200 |
These estimates are calculated with data collected from employers in all industry sectors, all metropolitan and nonmetropolitan areas, and all states and the District of Columbia. The top employment and wage figures are provided above. The complete list is available in the downloadable XLS files.
The percentile wage estimate is the value of a wage below which a certain percent of workers fall. The median wage is the 50th percentile wage estimate—50 percent of workers earn less than the median and 50 percent of workers earn more than the median. More about percentile wages.
(1) Estimates for detailed occupations do not sum to the totals because the totals include occupations not shown separately. Estimates do not include self-employed workers.
(2) Annual wages have been calculated by multiplying the hourly mean wage by a "year-round, full-time" hours figure of 2,080 hours; for those occupations where there is not an hourly wage published, the annual wage has been directly calculated from the reported survey data.
(3) The relative standard error (RSE) is a measure of the reliability of a survey statistic. The smaller the relative standard error, the more precise the estimate.
(7) The value is less than .005 percent of industry employment.
(8) Estimate not released.
(9) The location quotient is the ratio of the area concentration of occupational employment to the national average concentration. A location quotient greater than one indicates the occupation has a higher share of employment than average, and a location quotient less than one indicates the occupation is less prevalent in the area than average.
Other OEWS estimates and related information:
May 2023 National Occupational Employment and Wage Estimates
May 2023 State Occupational Employment and Wage Estimates
May 2023 Metropolitan and Nonmetropolitan Area Occupational Employment and Wage Estimates
May 2023 National Industry-Specific Occupational Employment and Wage Estimates
Last Modified Date: April 3, 2024