
An official website of the United States government
An official website of the United States government
The .gov means it's official.
Federal government websites often end in .gov or .mil. Before sharing sensitive information,
make sure you're on a federal government site.
The site is secure.
The
https:// ensures that you are connecting to the official website and that any
information you provide is encrypted and transmitted securely.
Play parts in stage, television, radio, video, or film productions, or other settings for entertainment, information, or instruction. Interpret serious or comic role by speech, gesture, and body movement to entertain or inform audience. May dance and sing.
Employment estimate and mean wage estimates for Actors:
| Employment (1) | Employment RSE (3) |
Mean hourly wage |
Mean annual wage (2) |
Wage RSE (3) |
|---|---|---|---|---|
| 62,560 | 11.2 % | $ 41.01 | (4) | 6.4 % |
Percentile wage estimates for Actors:
| Percentile | 10% | 25% | 50% (Median) |
75% | 90% |
|---|---|---|---|---|---|
| Hourly Wage | $ 13.00 | $ 15.98 | $ 20.50 | $ 36.54 | $ 100.01 |
Industries with the highest published employment and wages for Actors are provided. For a list of all industries with employment in Actors, see the Create Customized Tables function.
Industries with the highest levels of employment in Actors:
| Industry | Employment (1) | Percent of industry employment | Hourly mean wage | Annual mean wage (2) |
|---|---|---|---|---|
| Accounting, Tax Preparation, Bookkeeping, and Payroll Services | 17,060 | 1.55 | $ 36.78 | (4) |
| Motion Picture and Video Industries | 15,530 | 3.85 | $ 41.26 | (4) |
| Performing Arts Companies | 6,660 | 4.93 | $ 42.07 | (4) |
| Amusement Parks and Arcades | 6,540 | 2.88 | $ 19.52 | (4) |
| Colleges, Universities, and Professional Schools | 1,980 | 0.06 | $ 23.37 | (4) |
Industries with the highest concentration of employment in Actors:
| Industry | Employment (1) | Percent of industry employment | Hourly mean wage | Annual mean wage (2) |
|---|---|---|---|---|
| Performing Arts Companies | 6,660 | 4.93 | $ 42.07 | (4) |
| Motion Picture and Video Industries | 15,530 | 3.85 | $ 41.26 | (4) |
| Amusement Parks and Arcades | 6,540 | 2.88 | $ 19.52 | (4) |
| Accounting, Tax Preparation, Bookkeeping, and Payroll Services | 17,060 | 1.55 | $ 36.78 | (4) |
| Museums, Historical Sites, and Similar Institutions | 600 | 0.35 | $ 15.86 | (4) |
Top paying industries for Actors:
| Industry | Employment (1) | Percent of industry employment | Hourly mean wage | Annual mean wage (2) |
|---|---|---|---|---|
| Employment Services | (8) | (8) | $ 75.49 | (4) |
| Independent Artists, Writers, and Performers | (8) | (8) | $ 58.17 | (4) |
| Performing Arts Companies | 6,660 | 4.93 | $ 42.07 | (4) |
| Motion Picture and Video Industries | 15,530 | 3.85 | $ 41.26 | (4) |
| Advertising, Public Relations, and Related Services | 270 | 0.05 | $ 40.21 | (4) |
States and areas with the highest published employment, location quotients, and wages for Actors are provided. For a list of all areas with employment in Actors, see the Create Customized Tables function.
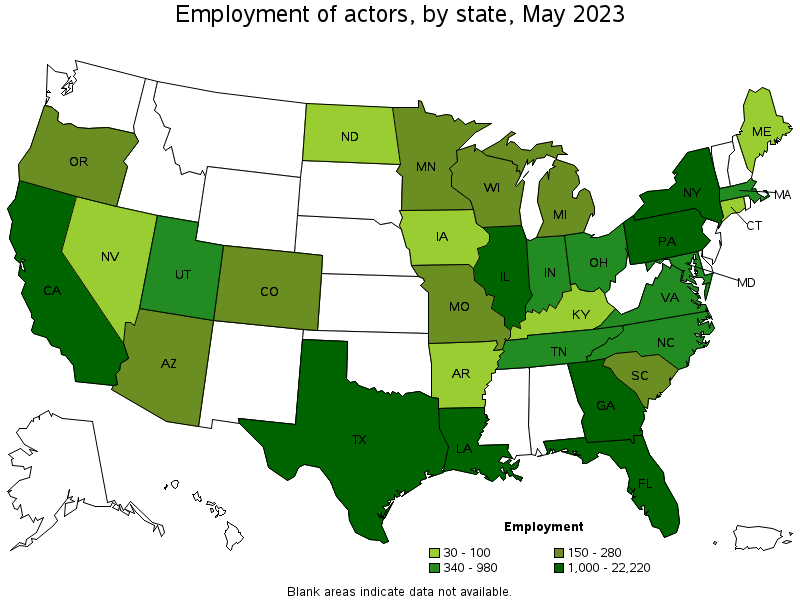
States with the highest employment level in Actors:
| State | Employment (1) | Employment per thousand jobs | Location quotient (9) | Hourly mean wage | Annual mean wage (2) |
|---|---|---|---|---|---|
| California | 22,220 | 1.24 | 3.01 | $ 45.76 | (4) |
| Florida | 8,550 | 0.89 | 2.17 | (8) | (8) |
| Illinois | 6,460 | 1.07 | 2.61 | $ 29.39 | (4) |
| New York | 6,120 | 0.65 | 1.58 | $ 58.91 | (4) |
| Georgia | 5,380 | 1.13 | 2.75 | $ 49.68 | (4) |
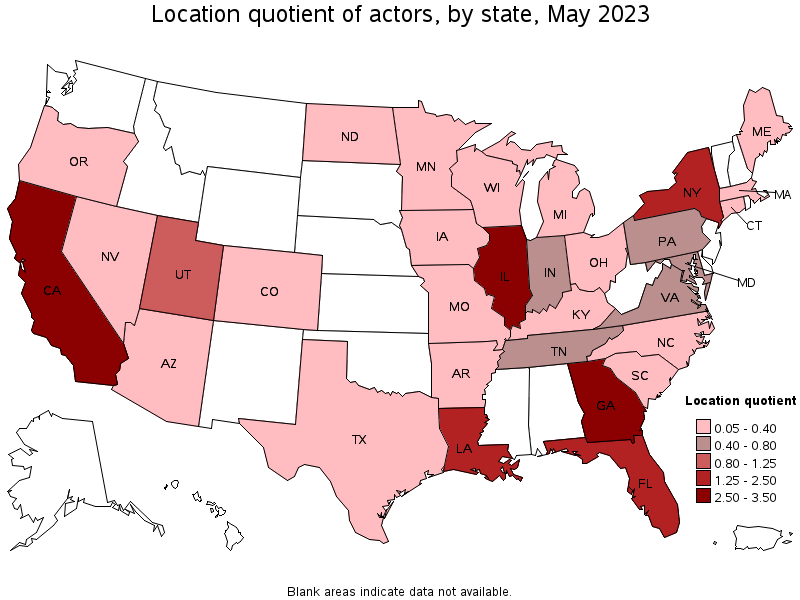
States with the highest concentration of jobs and location quotients in Actors:
| State | Employment (1) | Employment per thousand jobs | Location quotient (9) | Hourly mean wage | Annual mean wage (2) |
|---|---|---|---|---|---|
| California | 22,220 | 1.24 | 3.01 | $ 45.76 | (4) |
| Georgia | 5,380 | 1.13 | 2.75 | $ 49.68 | (4) |
| Illinois | 6,460 | 1.07 | 2.61 | $ 29.39 | (4) |
| Florida | 8,550 | 0.89 | 2.17 | (8) | (8) |
| New York | 6,120 | 0.65 | 1.58 | $ 58.91 | (4) |

Top paying states for Actors:
| State | Employment (1) | Employment per thousand jobs | Location quotient (9) | Hourly mean wage | Annual mean wage (2) |
|---|---|---|---|---|---|
| New York | 6,120 | 0.65 | 1.58 | $ 58.91 | (4) |
| Georgia | 5,380 | 1.13 | 2.75 | $ 49.68 | (4) |
| California | 22,220 | 1.24 | 3.01 | $ 45.76 | (4) |
| Minnesota | 280 | 0.10 | 0.24 | $ 38.90 | (4) |
| Pennsylvania | 1,230 | 0.21 | 0.50 | $ 32.24 | (4) |
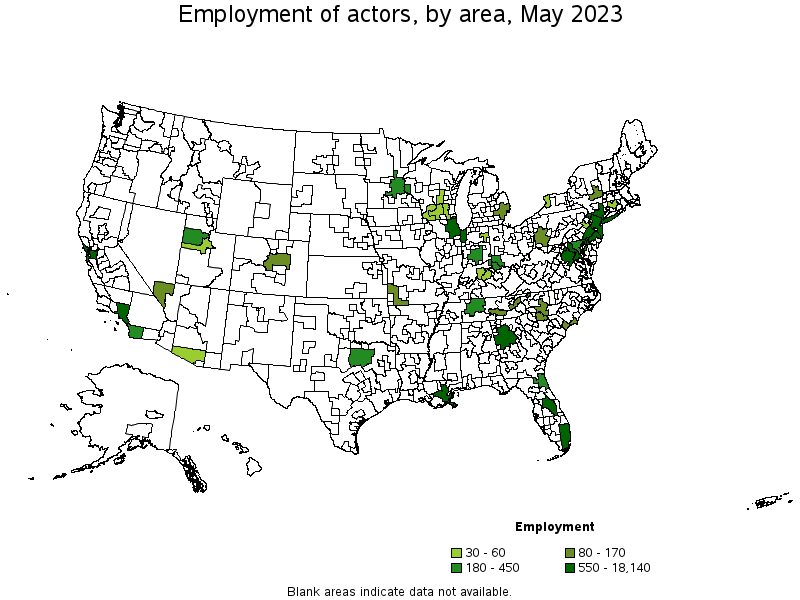
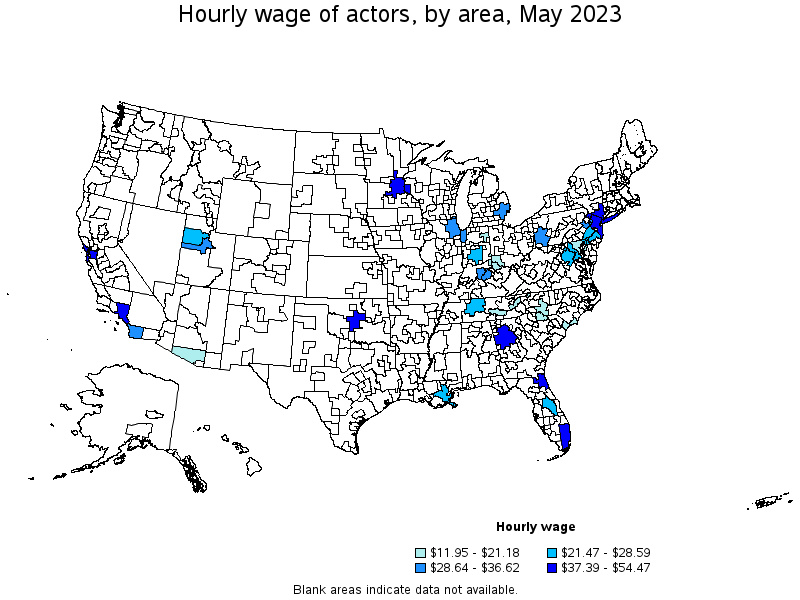
Metropolitan areas with the highest employment level in Actors:
| Metropolitan area | Employment (1) | Employment per thousand jobs | Location quotient (9) | Hourly mean wage | Annual mean wage (2) |
|---|---|---|---|---|---|
| Los Angeles-Long Beach-Anaheim, CA | 18,140 | 2.93 | 7.12 | $ 48.63 | (4) |
| New York-Newark-Jersey City, NY-NJ-PA | 6,220 | 0.65 | 1.59 | $ 54.47 | (4) |
| Orlando-Kissimmee-Sanford, FL | 6,110 | 4.47 | 10.85 | $ 21.87 | (4) |
| Chicago-Naperville-Elgin, IL-IN-WI | 3,800 | 0.84 | 2.05 | $ 33.61 | (4) |
| Atlanta-Sandy Springs-Roswell, GA | 3,400 | 1.21 | 2.93 | $ 53.41 | (4) |
| Washington-Arlington-Alexandria, DC-VA-MD-WV | 1,040 | 0.34 | 0.81 | $ 28.59 | (4) |
| New Orleans-Metairie, LA | 850 | 1.64 | 3.99 | $ 24.35 | (4) |
| Philadelphia-Camden-Wilmington, PA-NJ-DE-MD | 740 | 0.26 | 0.63 | $ 24.55 | (4) |
| Miami-Fort Lauderdale-West Palm Beach, FL | 630 | 0.23 | 0.57 | $ 50.15 | (4) |
| San Francisco-Oakland-Hayward, CA | 550 | 0.23 | 0.55 | $ 47.27 | (4) |
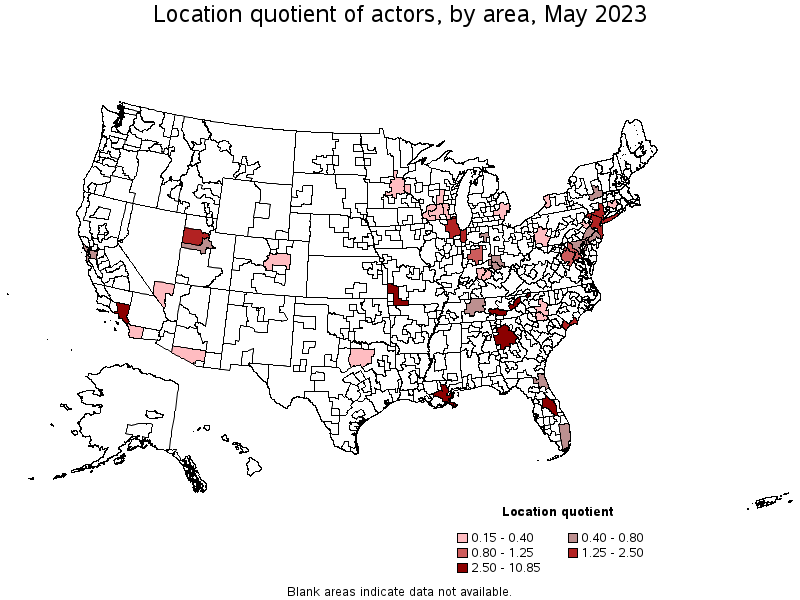
Metropolitan areas with the highest concentration of jobs and location quotients in Actors:
| Metropolitan area | Employment (1) | Employment per thousand jobs | Location quotient (9) | Hourly mean wage | Annual mean wage (2) |
|---|---|---|---|---|---|
| Orlando-Kissimmee-Sanford, FL | 6,110 | 4.47 | 10.85 | $ 21.87 | (4) |
| Los Angeles-Long Beach-Anaheim, CA | 18,140 | 2.93 | 7.12 | $ 48.63 | (4) |
| New Orleans-Metairie, LA | 850 | 1.64 | 3.99 | $ 24.35 | (4) |
| Atlanta-Sandy Springs-Roswell, GA | 3,400 | 1.21 | 2.93 | $ 53.41 | (4) |
| Chicago-Naperville-Elgin, IL-IN-WI | 3,800 | 0.84 | 2.05 | $ 33.61 | (4) |
| Myrtle Beach-Conway-North Myrtle Beach, SC-NC | 130 | 0.73 | 1.77 | $ 20.70 | (4) |
| New York-Newark-Jersey City, NY-NJ-PA | 6,220 | 0.65 | 1.59 | $ 54.47 | (4) |
| Salt Lake City, UT | 420 | 0.53 | 1.28 | $ 21.71 | (4) |
| Indianapolis-Carmel-Anderson, IN | 450 | 0.42 | 1.01 | $ 21.47 | (4) |
| Washington-Arlington-Alexandria, DC-VA-MD-WV | 1,040 | 0.34 | 0.81 | $ 28.59 | (4) |
Top paying metropolitan areas for Actors:
| Metropolitan area | Employment (1) | Employment per thousand jobs | Location quotient (9) | Hourly mean wage | Annual mean wage (2) |
|---|---|---|---|---|---|
| New York-Newark-Jersey City, NY-NJ-PA | 6,220 | 0.65 | 1.59 | $ 54.47 | (4) |
| Atlanta-Sandy Springs-Roswell, GA | 3,400 | 1.21 | 2.93 | $ 53.41 | (4) |
| Miami-Fort Lauderdale-West Palm Beach, FL | 630 | 0.23 | 0.57 | $ 50.15 | (4) |
| Jacksonville, FL | 180 | 0.24 | 0.59 | $ 49.51 | (4) |
| Los Angeles-Long Beach-Anaheim, CA | 18,140 | 2.93 | 7.12 | $ 48.63 | (4) |
| San Francisco-Oakland-Hayward, CA | 550 | 0.23 | 0.55 | $ 47.27 | (4) |
| Minneapolis-St. Paul-Bloomington, MN-WI | 270 | 0.14 | 0.34 | $ 39.60 | (4) |
| Oklahoma City, OK | (8) | (8) | (8) | $ 37.39 | (4) |
| San Diego-Carlsbad, CA | 210 | 0.13 | 0.33 | $ 36.62 | (4) |
| Chicago-Naperville-Elgin, IL-IN-WI | 3,800 | 0.84 | 2.05 | $ 33.61 | (4) |
Nonmetropolitan areas with the highest employment in Actors:
| Nonmetropolitan area | Employment (1) | Employment per thousand jobs | Location quotient (9) | Hourly mean wage | Annual mean wage (2) |
|---|---|---|---|---|---|
| East Tennessee nonmetropolitan area | 160 | 1.18 | 2.86 | $ 18.97 | (4) |
| Southwest Missouri nonmetropolitan area | 110 | 1.48 | 3.60 | (8) | (8) |
| South Central Wisconsin nonmetropolitan area | 30 | 0.16 | 0.38 | (8) | (8) |
Nonmetropolitan areas with the highest concentration of jobs and location quotients in Actors:
| Nonmetropolitan area | Employment (1) | Employment per thousand jobs | Location quotient (9) | Hourly mean wage | Annual mean wage (2) |
|---|---|---|---|---|---|
| Southwest Missouri nonmetropolitan area | 110 | 1.48 | 3.60 | (8) | (8) |
| East Tennessee nonmetropolitan area | 160 | 1.18 | 2.86 | $ 18.97 | (4) |
| South Central Wisconsin nonmetropolitan area | 30 | 0.16 | 0.38 | (8) | (8) |
Top paying nonmetropolitan areas for Actors:
| Nonmetropolitan area | Employment (1) | Employment per thousand jobs | Location quotient (9) | Hourly mean wage | Annual mean wage (2) |
|---|---|---|---|---|---|
| East Tennessee nonmetropolitan area | 160 | 1.18 | 2.86 | $ 18.97 | (4) |
These estimates are calculated with data collected from employers in all industry sectors, all metropolitan and nonmetropolitan areas, and all states and the District of Columbia. The top employment and wage figures are provided above. The complete list is available in the downloadable XLS files.
The percentile wage estimate is the value of a wage below which a certain percent of workers fall. The median wage is the 50th percentile wage estimate—50 percent of workers earn less than the median and 50 percent of workers earn more than the median. More about percentile wages.
(1) Estimates for detailed occupations do not sum to the totals because the totals include occupations not shown separately. Estimates do not include self-employed workers.
(2) Annual wages have been calculated by multiplying the hourly mean wage by a "year-round, full-time" hours figure of 2,080 hours; for those occupations where there is not an hourly wage published, the annual wage has been directly calculated from the reported survey data.
(3) The relative standard error (RSE) is a measure of the reliability of a survey statistic. The smaller the relative standard error, the more precise the estimate.
(4) Wages for some occupations that do not generally work year-round, full time, are reported either as hourly wages or annual salaries depending on how they are typically paid.
(8) Estimate not released.
(9) The location quotient is the ratio of the area concentration of occupational employment to the national average concentration. A location quotient greater than one indicates the occupation has a higher share of employment than average, and a location quotient less than one indicates the occupation is less prevalent in the area than average.
Other OEWS estimates and related information:
May 2023 National Occupational Employment and Wage Estimates
May 2023 State Occupational Employment and Wage Estimates
May 2023 Metropolitan and Nonmetropolitan Area Occupational Employment and Wage Estimates
May 2023 National Industry-Specific Occupational Employment and Wage Estimates
Last Modified Date: April 3, 2024