
An official website of the United States government
An official website of the United States government
The .gov means it's official.
Federal government websites often end in .gov or .mil. Before sharing sensitive information,
make sure you're on a federal government site.
The site is secure.
The
https:// ensures that you are connecting to the official website and that any
information you provide is encrypted and transmitted securely.
All healthcare support workers not listed separately.
Employment estimate and mean wage estimates for Healthcare Support Workers, All Other:
| Employment (1) | Employment RSE (3) |
Mean hourly wage |
Mean annual wage (2) |
Wage RSE (3) |
|---|---|---|---|---|
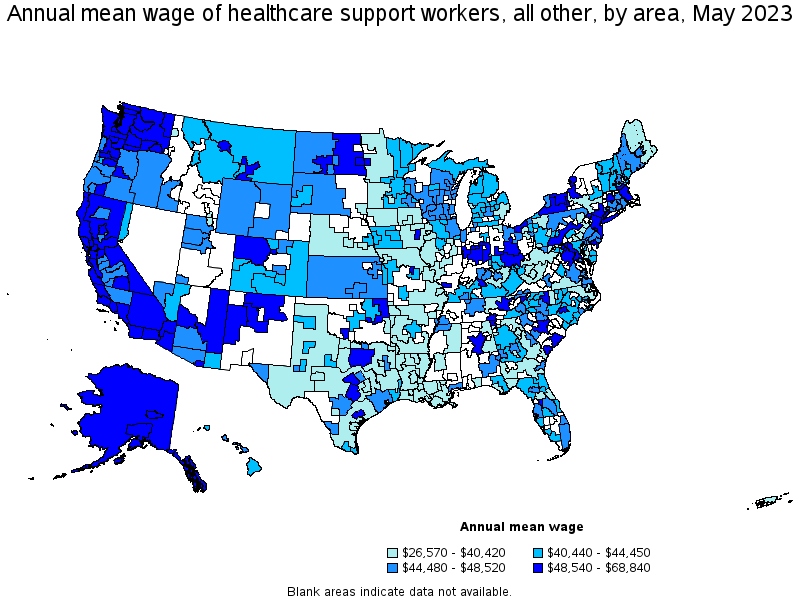
| 102,230 | 1.1 % | $ 22.60 | $ 47,010 | 0.5 % |
Percentile wage estimates for Healthcare Support Workers, All Other:
| Percentile | 10% | 25% | 50% (Median) |
75% | 90% |
|---|---|---|---|---|---|
| Hourly Wage | $ 15.21 | $ 17.57 | $ 21.39 | $ 26.27 | $ 31.37 |
| Annual Wage (2) | $ 31,630 | $ 36,540 | $ 44,490 | $ 54,630 | $ 65,250 |
Industries with the highest published employment and wages for Healthcare Support Workers, All Other are provided. For a list of all industries with employment in Healthcare Support Workers, All Other, see the Create Customized Tables function.
Industries with the highest levels of employment in Healthcare Support Workers, All Other:
| Industry | Employment (1) | Percent of industry employment | Hourly mean wage | Annual mean wage (2) |
|---|---|---|---|---|
| General Medical and Surgical Hospitals | 22,890 | 0.40 | $ 21.29 | $ 44,270 |
| Federal, State, and Local Government, excluding State and Local Government Schools and Hospitals and the U.S. Postal Service (OEWS Designation) | 14,980 | 0.70 | $ 26.36 | $ 54,830 |
| Elementary and Secondary Schools | 10,360 | 0.12 | $ 23.94 | $ 49,800 |
| Offices of Physicians | 6,690 | 0.24 | $ 20.94 | $ 43,550 |
| Offices of Other Health Practitioners | 6,350 | 0.56 | $ 24.23 | $ 50,390 |
Industries with the highest concentration of employment in Healthcare Support Workers, All Other:
| Industry | Employment (1) | Percent of industry employment | Hourly mean wage | Annual mean wage (2) |
|---|---|---|---|---|
| Other Ambulatory Health Care Services | 5,000 | 1.45 | $ 18.87 | $ 39,250 |
| Medical and Diagnostic Laboratories | 3,610 | 1.13 | $ 20.79 | $ 43,250 |
| Federal, State, and Local Government, excluding State and Local Government Schools and Hospitals and the U.S. Postal Service (OEWS Designation) | 14,980 | 0.70 | $ 26.36 | $ 54,830 |
| Psychiatric and Substance Abuse Hospitals | 1,390 | 0.59 | $ 21.45 | $ 44,620 |
| Offices of Other Health Practitioners | 6,350 | 0.56 | $ 24.23 | $ 50,390 |
Top paying industries for Healthcare Support Workers, All Other:
| Industry | Employment (1) | Percent of industry employment | Hourly mean wage | Annual mean wage (2) |
|---|---|---|---|---|
| Insurance Carriers | 170 | 0.01 | $ 34.39 | $ 71,530 |
| Junior Colleges | 150 | 0.02 | $ 33.91 | $ 70,540 |
| Medical Equipment and Supplies Manufacturing | 320 | 0.10 | $ 31.08 | $ 64,640 |
| Educational Support Services | 220 | 0.09 | $ 26.56 | $ 55,230 |
| Federal, State, and Local Government, excluding State and Local Government Schools and Hospitals and the U.S. Postal Service (OEWS Designation) | 14,980 | 0.70 | $ 26.36 | $ 54,830 |
States and areas with the highest published employment, location quotients, and wages for Healthcare Support Workers, All Other are provided. For a list of all areas with employment in Healthcare Support Workers, All Other, see the Create Customized Tables function.
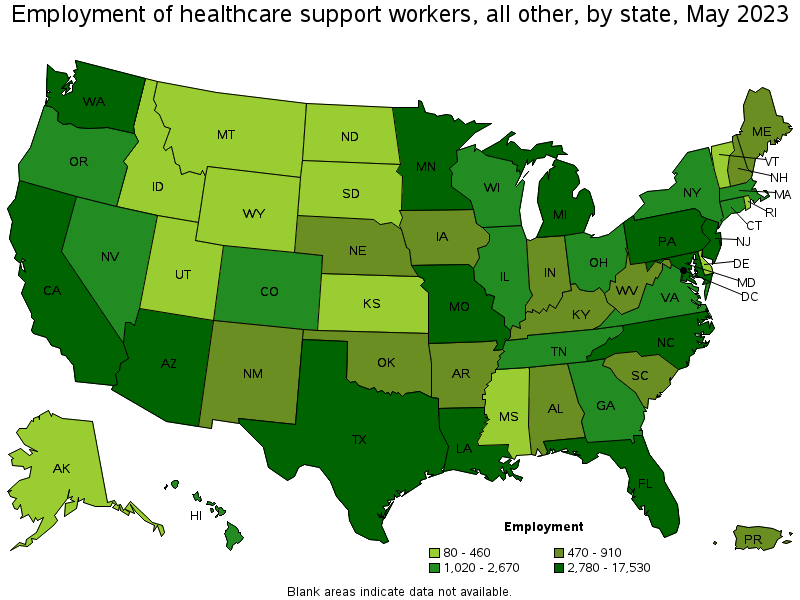
States with the highest employment level in Healthcare Support Workers, All Other:
| State | Employment (1) | Employment per thousand jobs | Location quotient (9) | Hourly mean wage | Annual mean wage (2) |
|---|---|---|---|---|---|
| California | 17,530 | 0.98 | 1.45 | $ 26.54 | $ 55,190 |
| Texas | 10,190 | 0.75 | 1.12 | $ 22.14 | $ 46,050 |
| Florida | 5,570 | 0.58 | 0.86 | $ 21.26 | $ 44,220 |
| Louisiana | 4,310 | 2.33 | 3.46 | $ 16.34 | $ 33,980 |
| Minnesota | 3,900 | 1.35 | 2.01 | $ 20.92 | $ 43,520 |
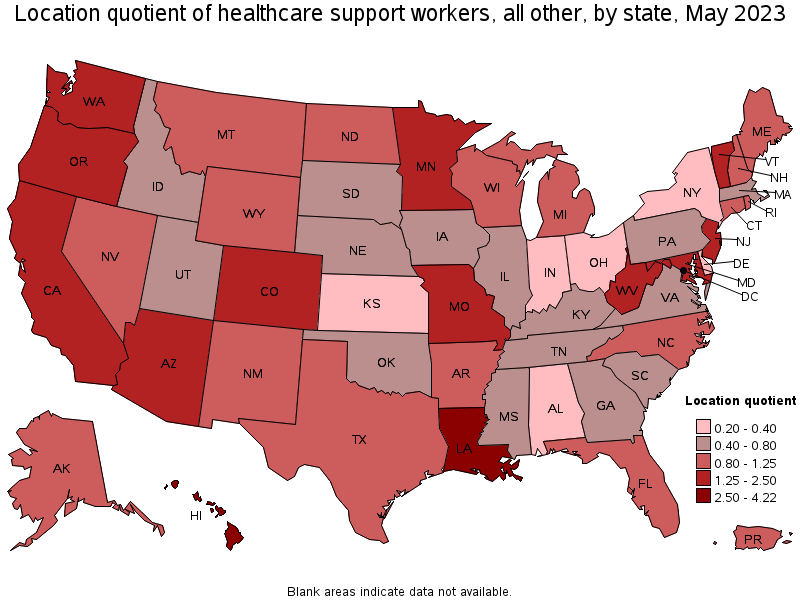
States with the highest concentration of jobs and location quotients in Healthcare Support Workers, All Other:
| State | Employment (1) | Employment per thousand jobs | Location quotient (9) | Hourly mean wage | Annual mean wage (2) |
|---|---|---|---|---|---|
| Hawaii | 1,750 | 2.84 | 4.22 | $ 22.24 | $ 46,260 |
| Louisiana | 4,310 | 2.33 | 3.46 | $ 16.34 | $ 33,980 |
| Maryland | 3,780 | 1.41 | 2.10 | $ 22.19 | $ 46,150 |
| Minnesota | 3,900 | 1.35 | 2.01 | $ 20.92 | $ 43,520 |
| Vermont | 360 | 1.21 | 1.80 | $ 21.02 | $ 43,710 |
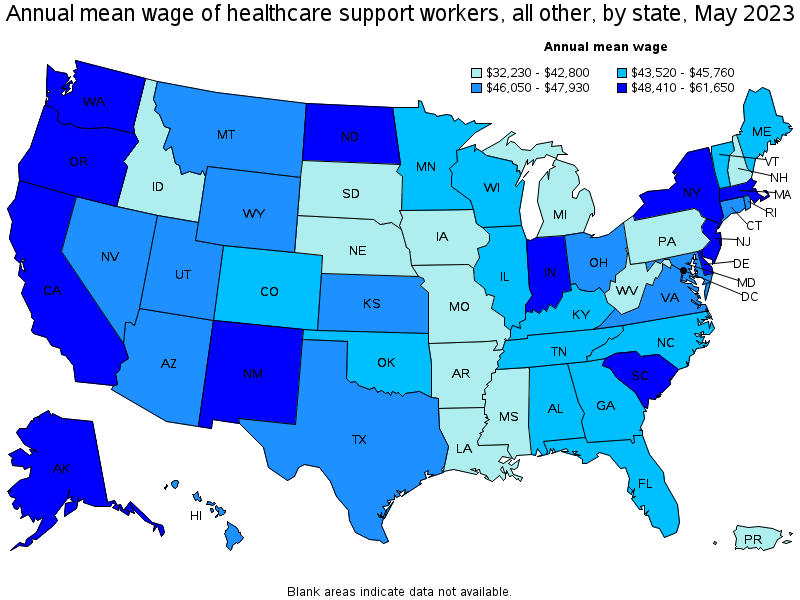
Top paying states for Healthcare Support Workers, All Other:
| State | Employment (1) | Employment per thousand jobs | Location quotient (9) | Hourly mean wage | Annual mean wage (2) |
|---|---|---|---|---|---|
| District of Columbia | 240 | 0.34 | 0.51 | $ 29.64 | $ 61,650 |
| Alaska | 180 | 0.57 | 0.84 | $ 29.42 | $ 61,200 |
| Washington | 3,360 | 0.96 | 1.43 | $ 27.12 | $ 56,420 |
| California | 17,530 | 0.98 | 1.45 | $ 26.54 | $ 55,190 |
| Delaware | 80 | 0.18 | 0.27 | $ 26.16 | $ 54,410 |
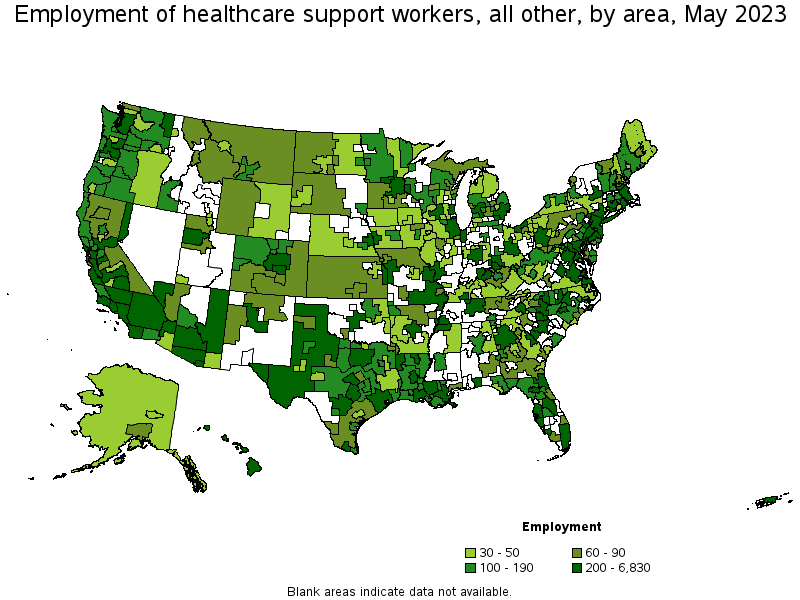
Metropolitan areas with the highest employment level in Healthcare Support Workers, All Other:
| Metropolitan area | Employment (1) | Employment per thousand jobs | Location quotient (9) | Hourly mean wage | Annual mean wage (2) |
|---|---|---|---|---|---|
| Los Angeles-Long Beach-Anaheim, CA | 6,830 | 1.10 | 1.64 | $ 26.44 | $ 55,000 |
| New York-Newark-Jersey City, NY-NJ-PA | 4,220 | 0.44 | 0.66 | $ 24.36 | $ 50,660 |
| Dallas-Fort Worth-Arlington, TX | 2,750 | 0.69 | 1.03 | $ 23.34 | $ 48,540 |
| Phoenix-Mesa-Scottsdale, AZ | 2,460 | 1.07 | 1.60 | $ 22.85 | $ 47,530 |
| Houston-The Woodlands-Sugar Land, TX | 2,410 | 0.76 | 1.13 | $ 22.56 | $ 46,920 |
| Minneapolis-St. Paul-Bloomington, MN-WI | 2,230 | 1.17 | 1.74 | $ 21.33 | $ 44,360 |
| Baltimore-Columbia-Towson, MD | 2,010 | 1.54 | 2.28 | $ 20.42 | $ 42,480 |
| Washington-Arlington-Alexandria, DC-VA-MD-WV | 1,870 | 0.60 | 0.90 | $ 25.94 | $ 53,950 |
| Riverside-San Bernardino-Ontario, CA | 1,860 | 1.12 | 1.66 | $ 25.80 | $ 53,660 |
| Chicago-Naperville-Elgin, IL-IN-WI | 1,800 | 0.40 | 0.59 | $ 22.85 | $ 47,520 |
Metropolitan areas with the highest concentration of jobs and location quotients in Healthcare Support Workers, All Other:
| Metropolitan area | Employment (1) | Employment per thousand jobs | Location quotient (9) | Hourly mean wage | Annual mean wage (2) |
|---|---|---|---|---|---|
| Shreveport-Bossier City, LA | 800 | 4.70 | 6.97 | $ 17.49 | $ 36,370 |
| Kahului-Wailuku-Lahaina, HI | 350 | 4.58 | 6.80 | $ 22.69 | $ 47,200 |
| Hammond, LA | 160 | 3.52 | 5.23 | $ 15.82 | $ 32,910 |
| Alexandria, LA | 200 | 3.46 | 5.14 | $ 16.12 | $ 33,520 |
| Fayetteville, NC | 420 | 3.22 | 4.79 | $ 24.62 | $ 51,210 |
| Cumberland, MD-WV | 120 | 3.21 | 4.77 | $ 17.55 | $ 36,510 |
| Monroe, LA | 210 | 2.79 | 4.14 | $ 15.39 | $ 32,010 |
| Urban Honolulu, HI | 1,180 | 2.68 | 3.98 | $ 22.38 | $ 46,540 |
| Beckley, WV | 110 | 2.58 | 3.83 | $ 17.51 | $ 36,410 |
| Baton Rouge, LA | 970 | 2.51 | 3.73 | $ 16.08 | $ 33,450 |
Top paying metropolitan areas for Healthcare Support Workers, All Other:
| Metropolitan area | Employment (1) | Employment per thousand jobs | Location quotient (9) | Hourly mean wage | Annual mean wage (2) |
|---|---|---|---|---|---|
| San Francisco-Oakland-Hayward, CA | 1,460 | 0.60 | 0.89 | $ 33.10 | $ 68,840 |
| Napa, CA | 100 | 1.26 | 1.88 | $ 32.24 | $ 67,060 |
| Fairbanks, AK | 40 | 1.06 | 1.57 | $ 30.17 | $ 62,740 |
| San Luis Obispo-Paso Robles-Arroyo Grande, CA | 110 | 0.93 | 1.39 | $ 29.18 | $ 60,690 |
| Wenatchee, WA | 50 | 1.00 | 1.49 | $ 29.08 | $ 60,480 |
| Seattle-Tacoma-Bellevue, WA | 1,760 | 0.85 | 1.26 | $ 28.56 | $ 59,390 |
| Hilton Head Island-Bluffton-Beaufort, SC | 50 | 0.67 | 1.00 | $ 28.35 | $ 58,970 |
| Albany, OR | 40 | 0.79 | 1.17 | $ 27.91 | $ 58,040 |
| Bend-Redmond, OR | 110 | 1.22 | 1.81 | $ 27.86 | $ 57,940 |
| Knoxville, TN | 80 | 0.19 | 0.29 | $ 27.71 | $ 57,630 |
Nonmetropolitan areas with the highest employment in Healthcare Support Workers, All Other:
| Nonmetropolitan area | Employment (1) | Employment per thousand jobs | Location quotient (9) | Hourly mean wage | Annual mean wage (2) |
|---|---|---|---|---|---|
| Southeast Missouri nonmetropolitan area | 460 | 2.82 | 4.19 | $ 17.15 | $ 35,670 |
| Arizona nonmetropolitan area | 290 | 3.13 | 4.66 | $ 23.53 | $ 48,950 |
| West Texas Region of Texas nonmetropolitan area | 270 | 1.38 | 2.05 | $ 15.12 | $ 31,450 |
| Hawaii / Kauai nonmetropolitan area | 230 | 2.25 | 3.34 | $ 20.87 | $ 43,400 |
| North Texas Region of Texas nonmetropolitan area | 180 | 0.66 | 0.98 | $ 17.79 | $ 37,000 |
Nonmetropolitan areas with the highest concentration of jobs and location quotients in Healthcare Support Workers, All Other:
| Nonmetropolitan area | Employment (1) | Employment per thousand jobs | Location quotient (9) | Hourly mean wage | Annual mean wage (2) |
|---|---|---|---|---|---|
| Arizona nonmetropolitan area | 290 | 3.13 | 4.66 | $ 23.53 | $ 48,950 |
| Southeast Missouri nonmetropolitan area | 460 | 2.82 | 4.19 | $ 17.15 | $ 35,670 |
| Hawaii / Kauai nonmetropolitan area | 230 | 2.25 | 3.34 | $ 20.87 | $ 43,400 |
| Northeast Louisiana nonmetropolitan area | 140 | 2.18 | 3.24 | $ 14.42 | $ 29,980 |
| Central Louisiana nonmetropolitan area | 150 | 1.91 | 2.84 | $ 16.27 | $ 33,840 |
Top paying nonmetropolitan areas for Healthcare Support Workers, All Other:
| Nonmetropolitan area | Employment (1) | Employment per thousand jobs | Location quotient (9) | Hourly mean wage | Annual mean wage (2) |
|---|---|---|---|---|---|
| Alaska nonmetropolitan area | 50 | 0.49 | 0.73 | $ 32.09 | $ 66,740 |
| Eastern Sierra-Mother Lode Region of California nonmetropolitan area | 70 | 1.13 | 1.67 | $ 25.81 | $ 53,690 |
| East North Dakota nonmetropolitan area | 30 | 0.50 | 0.75 | $ 25.33 | $ 52,680 |
| Central Indiana nonmetropolitan area | 30 | 0.20 | 0.29 | $ 25.27 | $ 52,570 |
| Eastern Washington nonmetropolitan area | 110 | 1.06 | 1.57 | $ 25.23 | $ 52,480 |
These estimates are calculated with data collected from employers in all industry sectors, all metropolitan and nonmetropolitan areas, and all states and the District of Columbia. The top employment and wage figures are provided above. The complete list is available in the downloadable XLS files.
The percentile wage estimate is the value of a wage below which a certain percent of workers fall. The median wage is the 50th percentile wage estimate—50 percent of workers earn less than the median and 50 percent of workers earn more than the median. More about percentile wages.
(1) Estimates for detailed occupations do not sum to the totals because the totals include occupations not shown separately. Estimates do not include self-employed workers.
(2) Annual wages have been calculated by multiplying the hourly mean wage by a "year-round, full-time" hours figure of 2,080 hours; for those occupations where there is not an hourly wage published, the annual wage has been directly calculated from the reported survey data.
(3) The relative standard error (RSE) is a measure of the reliability of a survey statistic. The smaller the relative standard error, the more precise the estimate.
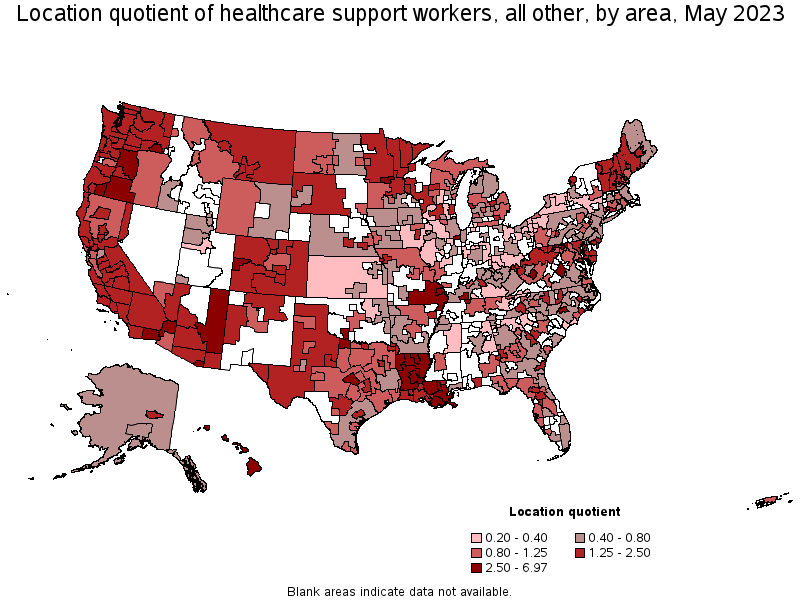
(9) The location quotient is the ratio of the area concentration of occupational employment to the national average concentration. A location quotient greater than one indicates the occupation has a higher share of employment than average, and a location quotient less than one indicates the occupation is less prevalent in the area than average.
Other OEWS estimates and related information:
May 2023 National Occupational Employment and Wage Estimates
May 2023 State Occupational Employment and Wage Estimates
May 2023 Metropolitan and Nonmetropolitan Area Occupational Employment and Wage Estimates
May 2023 National Industry-Specific Occupational Employment and Wage Estimates
Last Modified Date: April 3, 2024