
An official website of the United States government
An official website of the United States government
The .gov means it's official.
Federal government websites often end in .gov or .mil. Before sharing sensitive information,
make sure you're on a federal government site.
The site is secure.
The
https:// ensures that you are connecting to the official website and that any
information you provide is encrypted and transmitted securely.
Using sophisticated climbing and rigging techniques, cut away dead or excess branches from trees or shrubs to maintain right-of-way for roads, sidewalks, or utilities, or to improve appearance, health, and value of tree. Prune or treat trees or shrubs using handsaws, hand pruners, clippers, and power pruners. Works off the ground in the tree canopy and may use truck-mounted lifts. Excludes workers who primarily perform duties of �Landscaping and Groundskeeping Workers� (37-3011) and �Pesticide Handlers, Sprayers, and Applicators, Vegetation� (37-3012).
Employment estimate and mean wage estimates for Tree Trimmers and Pruners:
| Employment (1) | Employment RSE (3) |
Mean hourly wage |
Mean annual wage (2) |
Wage RSE (3) |
|---|---|---|---|---|
| 50,270 | 4.1 % | $ 25.41 | $ 52,850 | 1.5 % |
Percentile wage estimates for Tree Trimmers and Pruners:
| Percentile | 10% | 25% | 50% (Median) |
75% | 90% |
|---|---|---|---|---|---|
| Hourly Wage | $ 16.56 | $ 19.58 | $ 23.59 | $ 29.06 | $ 36.47 |
| Annual Wage (2) | $ 34,450 | $ 40,720 | $ 49,070 | $ 60,450 | $ 75,870 |
Industries with the highest published employment and wages for Tree Trimmers and Pruners are provided. For a list of all industries with employment in Tree Trimmers and Pruners, see the Create Customized Tables function.
Industries with the highest levels of employment in Tree Trimmers and Pruners:
| Industry | Employment (1) | Percent of industry employment | Hourly mean wage | Annual mean wage (2) |
|---|---|---|---|---|
| Services to Buildings and Dwellings | 44,520 | 1.98 | $ 25.13 | $ 52,270 |
| Local Government, excluding Schools and Hospitals (OEWS Designation) | 2,340 | 0.04 | $ 29.59 | $ 61,550 |
| Electric Power Generation, Transmission and Distribution | 1,000 | 0.25 | $ 28.83 | $ 59,960 |
| Other Specialty Trade Contractors | 420 | 0.05 | $ 23.41 | $ 48,690 |
| Utility System Construction | 330 | 0.06 | $ 29.08 | $ 60,480 |
Industries with the highest concentration of employment in Tree Trimmers and Pruners:
| Industry | Employment (1) | Percent of industry employment | Hourly mean wage | Annual mean wage (2) |
|---|---|---|---|---|
| Services to Buildings and Dwellings | 44,520 | 1.98 | $ 25.13 | $ 52,270 |
| Electric Power Generation, Transmission and Distribution | 1,000 | 0.25 | $ 28.83 | $ 59,960 |
| Utility System Construction | 330 | 0.06 | $ 29.08 | $ 60,480 |
| Other Specialty Trade Contractors | 420 | 0.05 | $ 23.41 | $ 48,690 |
| Local Government, excluding Schools and Hospitals (OEWS Designation) | 2,340 | 0.04 | $ 29.59 | $ 61,550 |
Top paying industries for Tree Trimmers and Pruners:
| Industry | Employment (1) | Percent of industry employment | Hourly mean wage | Annual mean wage (2) |
|---|---|---|---|---|
| Facilities Support Services | 50 | 0.03 | $ 35.50 | $ 73,830 |
| Federal, State, and Local Government, excluding State and Local Government Schools and Hospitals and the U.S. Postal Service (OEWS Designation) | 50 | (7) | $ 33.71 | $ 70,120 |
| Museums, Historical Sites, and Similar Institutions | 30 | 0.02 | $ 31.83 | $ 66,210 |
| State Government, excluding Schools and Hospitals (OEWS Designation) | 150 | 0.01 | $ 29.77 | $ 61,920 |
| Local Government, excluding Schools and Hospitals (OEWS Designation) | 2,340 | 0.04 | $ 29.59 | $ 61,550 |
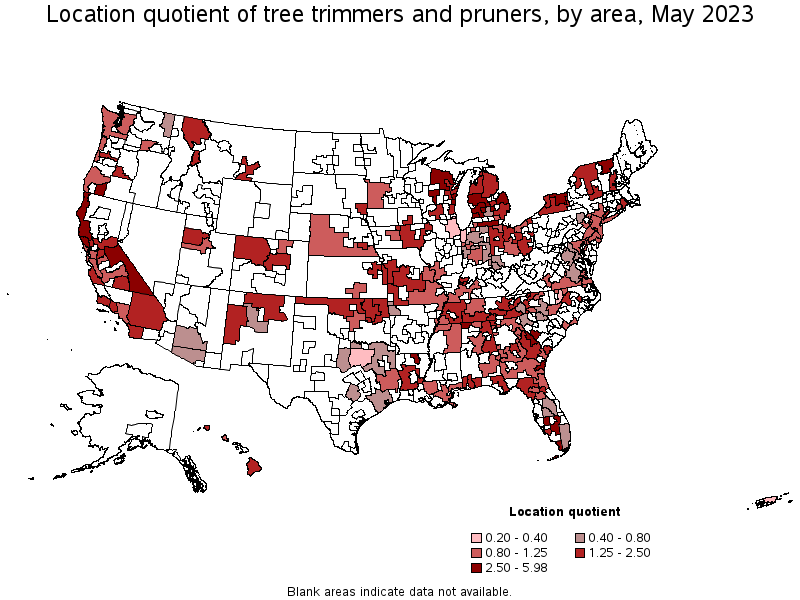
States and areas with the highest published employment, location quotients, and wages for Tree Trimmers and Pruners are provided. For a list of all areas with employment in Tree Trimmers and Pruners, see the Create Customized Tables function.
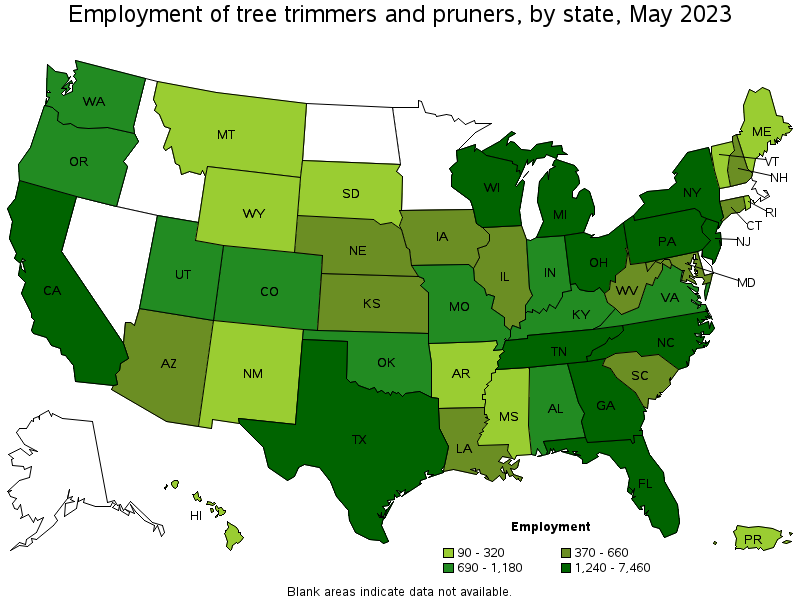
States with the highest employment level in Tree Trimmers and Pruners:
| State | Employment (1) | Employment per thousand jobs | Location quotient (9) | Hourly mean wage | Annual mean wage (2) |
|---|---|---|---|---|---|
| California | 7,460 | 0.42 | 1.26 | $ 31.45 | $ 65,420 |
| Michigan | 3,160 | 0.73 | 2.20 | $ 24.98 | $ 51,960 |
| New York | 2,980 | 0.32 | 0.96 | $ 28.92 | $ 60,160 |
| Florida | 2,910 | 0.30 | 0.92 | $ 19.95 | $ 41,490 |
| New Jersey | 2,150 | 0.51 | 1.54 | $ 23.86 | $ 49,630 |
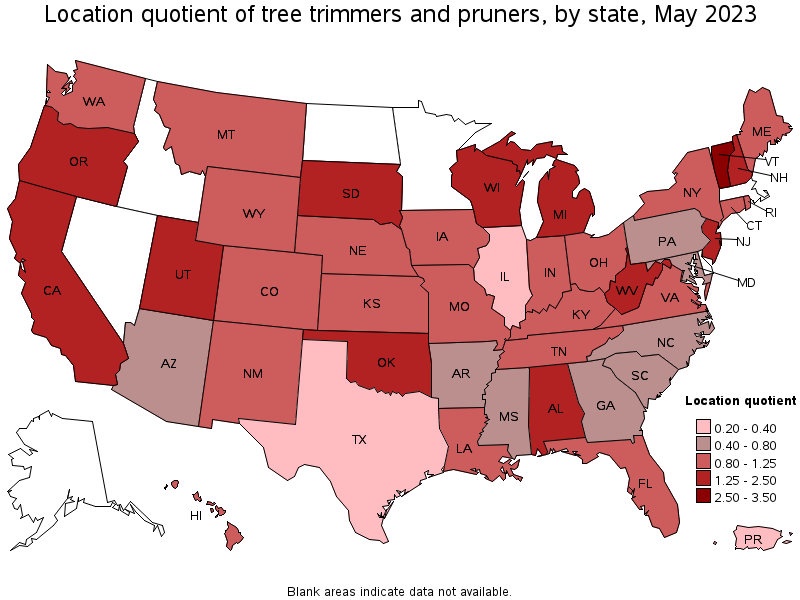
States with the highest concentration of jobs and location quotients in Tree Trimmers and Pruners:
| State | Employment (1) | Employment per thousand jobs | Location quotient (9) | Hourly mean wage | Annual mean wage (2) |
|---|---|---|---|---|---|
| Vermont | 320 | 1.05 | 3.17 | $ 25.98 | $ 54,040 |
| Michigan | 3,160 | 0.73 | 2.20 | $ 24.98 | $ 51,960 |
| West Virginia | 490 | 0.71 | 2.15 | $ 19.14 | $ 39,820 |
| New Hampshire | 370 | 0.54 | 1.64 | $ 25.70 | $ 53,460 |
| Alabama | 1,090 | 0.53 | 1.60 | $ 20.89 | $ 43,460 |
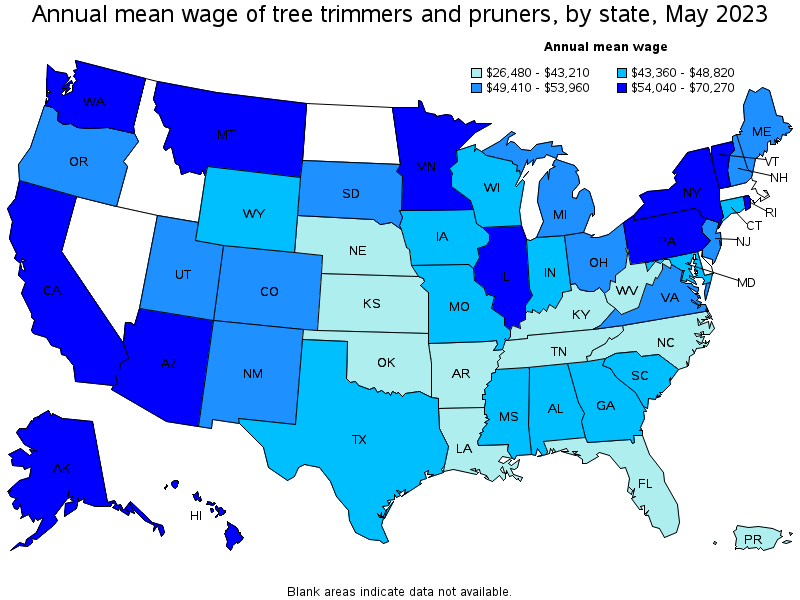
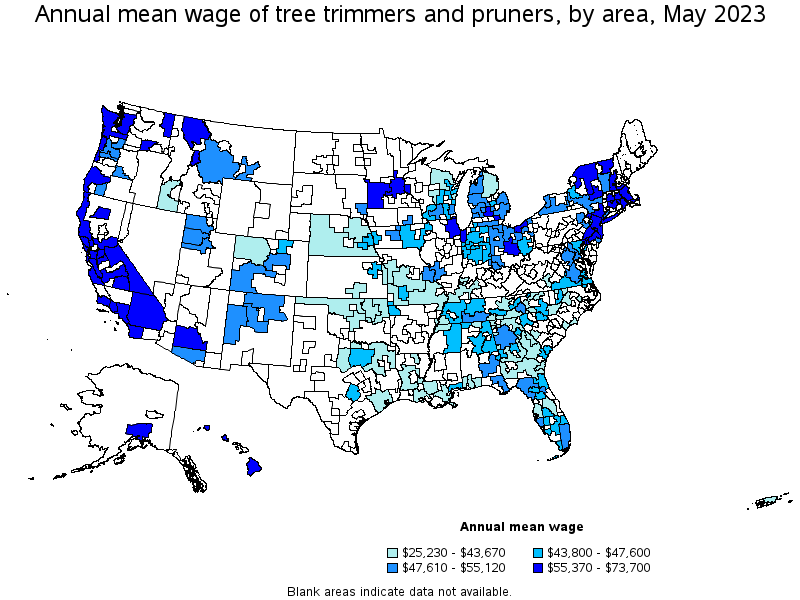
Top paying states for Tree Trimmers and Pruners:
| State | Employment (1) | Employment per thousand jobs | Location quotient (9) | Hourly mean wage | Annual mean wage (2) |
|---|---|---|---|---|---|
| Alaska | (8) | (8) | (8) | $ 33.79 | $ 70,270 |
| Washington | 930 | 0.27 | 0.81 | $ 31.93 | $ 66,410 |
| California | 7,460 | 0.42 | 1.26 | $ 31.45 | $ 65,420 |
| Illinois | 430 | 0.07 | 0.22 | $ 29.49 | $ 61,330 |
| New York | 2,980 | 0.32 | 0.96 | $ 28.92 | $ 60,160 |
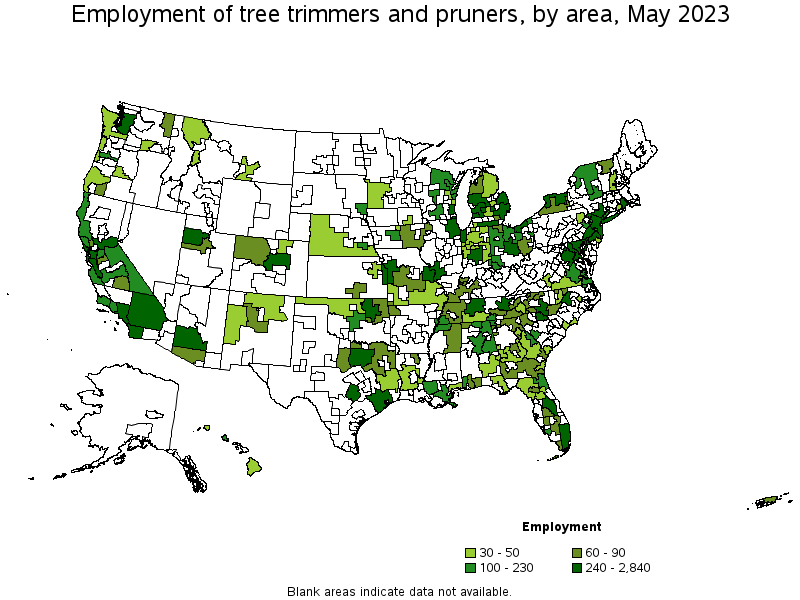
Metropolitan areas with the highest employment level in Tree Trimmers and Pruners:
| Metropolitan area | Employment (1) | Employment per thousand jobs | Location quotient (9) | Hourly mean wage | Annual mean wage (2) |
|---|---|---|---|---|---|
| New York-Newark-Jersey City, NY-NJ-PA | 2,840 | 0.30 | 0.90 | $ 26.68 | $ 55,500 |
| Los Angeles-Long Beach-Anaheim, CA | 1,670 | 0.27 | 0.82 | $ 31.23 | $ 64,960 |
| Detroit-Warren-Dearborn, MI | 1,120 | 0.59 | 1.79 | $ 24.92 | $ 51,830 |
| Philadelphia-Camden-Wilmington, PA-NJ-DE-MD | 1,110 | 0.39 | 1.19 | $ 27.32 | $ 56,830 |
| San Francisco-Oakland-Hayward, CA | 920 | 0.38 | 1.14 | $ 34.10 | $ 70,930 |
| San Diego-Carlsbad, CA | 900 | 0.59 | 1.78 | $ 30.94 | $ 64,340 |
| Riverside-San Bernardino-Ontario, CA | 800 | 0.48 | 1.45 | $ 31.84 | $ 66,230 |
| Sacramento--Roseville--Arden-Arcade, CA | 780 | 0.74 | 2.23 | $ 31.32 | $ 65,140 |
| Denver-Aurora-Lakewood, CO | 700 | 0.44 | 1.33 | $ 25.26 | $ 52,550 |
| Seattle-Tacoma-Bellevue, WA | 670 | 0.32 | 0.97 | $ 33.15 | $ 68,940 |
Metropolitan areas with the highest concentration of jobs and location quotients in Tree Trimmers and Pruners:
| Metropolitan area | Employment (1) | Employment per thousand jobs | Location quotient (9) | Hourly mean wage | Annual mean wage (2) |
|---|---|---|---|---|---|
| Florence-Muscle Shoals, AL | 70 | 1.25 | 3.78 | $ 21.22 | $ 44,130 |
| Rochester, NY | 540 | 1.10 | 3.32 | (8) | (8) |
| Medford, OR | 90 | 1.01 | 3.05 | $ 22.89 | $ 47,610 |
| Brunswick, GA | 40 | 0.91 | 2.76 | $ 20.66 | $ 42,980 |
| Monroe, LA | 70 | 0.88 | 2.66 | $ 19.13 | $ 39,800 |
| Sheboygan, WI | 50 | 0.88 | 2.65 | $ 21.97 | $ 45,710 |
| Santa Rosa, CA | 180 | 0.86 | 2.61 | $ 29.24 | $ 60,820 |
| Grand Rapids-Wyoming, MI | 450 | 0.84 | 2.54 | $ 24.77 | $ 51,530 |
| Augusta-Richmond County, GA-SC | 190 | 0.84 | 2.53 | $ 20.61 | $ 42,860 |
| Daphne-Fairhope-Foley, AL | 70 | 0.81 | 2.45 | $ 19.70 | $ 40,970 |
Top paying metropolitan areas for Tree Trimmers and Pruners:
| Metropolitan area | Employment (1) | Employment per thousand jobs | Location quotient (9) | Hourly mean wage | Annual mean wage (2) |
|---|---|---|---|---|---|
| San Jose-Sunnyvale-Santa Clara, CA | 400 | 0.35 | 1.06 | $ 35.43 | $ 73,700 |
| Boston-Cambridge-Nashua, MA-NH | (8) | (8) | (8) | $ 34.87 | $ 72,530 |
| San Francisco-Oakland-Hayward, CA | 920 | 0.38 | 1.14 | $ 34.10 | $ 70,930 |
| Anchorage, AK | (8) | (8) | (8) | $ 34.07 | $ 70,870 |
| Seattle-Tacoma-Bellevue, WA | 670 | 0.32 | 0.97 | $ 33.15 | $ 68,940 |
| Barnstable Town, MA | (8) | (8) | (8) | $ 33.13 | $ 68,900 |
| Albany-Schenectady-Troy, NY | 190 | 0.44 | 1.32 | $ 33.11 | $ 68,860 |
| Providence-Warwick, RI-MA | 240 | 0.43 | 1.29 | $ 32.04 | $ 66,650 |
| Riverside-San Bernardino-Ontario, CA | 800 | 0.48 | 1.45 | $ 31.84 | $ 66,230 |
| Sacramento--Roseville--Arden-Arcade, CA | 780 | 0.74 | 2.23 | $ 31.32 | $ 65,140 |
Nonmetropolitan areas with the highest employment in Tree Trimmers and Pruners:
| Nonmetropolitan area | Employment (1) | Employment per thousand jobs | Location quotient (9) | Hourly mean wage | Annual mean wage (2) |
|---|---|---|---|---|---|
| Balance of Lower Peninsula of Michigan nonmetropolitan area | 350 | 1.31 | 3.97 | $ 25.34 | $ 52,710 |
| North Northeastern Ohio nonmetropolitan area (noncontiguous) | 180 | 0.55 | 1.65 | $ 23.56 | $ 49,000 |
| Northeastern Wisconsin nonmetropolitan area | 180 | 0.91 | 2.75 | $ 20.44 | $ 42,520 |
| Eastern Sierra-Mother Lode Region of California nonmetropolitan area | 120 | 1.98 | 5.98 | $ 33.66 | $ 70,010 |
| West Northwestern Ohio nonmetropolitan area | 120 | 0.47 | 1.41 | $ 23.27 | $ 48,400 |
Nonmetropolitan areas with the highest concentration of jobs and location quotients in Tree Trimmers and Pruners:
| Nonmetropolitan area | Employment (1) | Employment per thousand jobs | Location quotient (9) | Hourly mean wage | Annual mean wage (2) |
|---|---|---|---|---|---|
| Eastern Sierra-Mother Lode Region of California nonmetropolitan area | 120 | 1.98 | 5.98 | $ 33.66 | $ 70,010 |
| Balance of Lower Peninsula of Michigan nonmetropolitan area | 350 | 1.31 | 3.97 | $ 25.34 | $ 52,710 |
| North Coast Region of California nonmetropolitan area | 100 | 0.98 | 2.97 | $ 30.76 | $ 63,970 |
| Northern Vermont nonmetropolitan area | 70 | 0.96 | 2.90 | $ 29.91 | $ 62,210 |
| Northeastern Wisconsin nonmetropolitan area | 180 | 0.91 | 2.75 | $ 20.44 | $ 42,520 |
Top paying nonmetropolitan areas for Tree Trimmers and Pruners:
| Nonmetropolitan area | Employment (1) | Employment per thousand jobs | Location quotient (9) | Hourly mean wage | Annual mean wage (2) |
|---|---|---|---|---|---|
| Eastern Sierra-Mother Lode Region of California nonmetropolitan area | 120 | 1.98 | 5.98 | $ 33.66 | $ 70,010 |
| North Coast Region of California nonmetropolitan area | 100 | 0.98 | 2.97 | $ 30.76 | $ 63,970 |
| Northern Vermont nonmetropolitan area | 70 | 0.96 | 2.90 | $ 29.91 | $ 62,210 |
| Coast Oregon nonmetropolitan area | 40 | 0.35 | 1.07 | $ 29.44 | $ 61,240 |
| West Montana nonmetropolitan area | 40 | 0.51 | 1.54 | $ 29.14 | $ 60,610 |
These estimates are calculated with data collected from employers in all industry sectors, all metropolitan and nonmetropolitan areas, and all states and the District of Columbia. The top employment and wage figures are provided above. The complete list is available in the downloadable XLS files.
The percentile wage estimate is the value of a wage below which a certain percent of workers fall. The median wage is the 50th percentile wage estimate—50 percent of workers earn less than the median and 50 percent of workers earn more than the median. More about percentile wages.
(1) Estimates for detailed occupations do not sum to the totals because the totals include occupations not shown separately. Estimates do not include self-employed workers.
(2) Annual wages have been calculated by multiplying the hourly mean wage by a "year-round, full-time" hours figure of 2,080 hours; for those occupations where there is not an hourly wage published, the annual wage has been directly calculated from the reported survey data.
(3) The relative standard error (RSE) is a measure of the reliability of a survey statistic. The smaller the relative standard error, the more precise the estimate.
(7) The value is less than .005 percent of industry employment.
(8) Estimate not released.
(9) The location quotient is the ratio of the area concentration of occupational employment to the national average concentration. A location quotient greater than one indicates the occupation has a higher share of employment than average, and a location quotient less than one indicates the occupation is less prevalent in the area than average.
Other OEWS estimates and related information:
May 2023 National Occupational Employment and Wage Estimates
May 2023 State Occupational Employment and Wage Estimates
May 2023 Metropolitan and Nonmetropolitan Area Occupational Employment and Wage Estimates
May 2023 National Industry-Specific Occupational Employment and Wage Estimates
Last Modified Date: April 3, 2024