
An official website of the United States government
An official website of the United States government
The .gov means it's official.
Federal government websites often end in .gov or .mil. Before sharing sensitive information,
make sure you're on a federal government site.
The site is secure.
The
https:// ensures that you are connecting to the official website and that any
information you provide is encrypted and transmitted securely.
All grounds maintenance workers not listed separately.
Employment estimate and mean wage estimates for Grounds Maintenance Workers, All Other:
| Employment (1) | Employment RSE (3) |
Mean hourly wage |
Mean annual wage (2) |
Wage RSE (3) |
|---|---|---|---|---|
| 11,980 | 7.4 % | $ 22.37 | $ 46,540 | 1.4 % |
Percentile wage estimates for Grounds Maintenance Workers, All Other:
| Percentile | 10% | 25% | 50% (Median) |
75% | 90% |
|---|---|---|---|---|---|
| Hourly Wage | $ 14.14 | $ 16.86 | $ 20.82 | $ 25.86 | $ 36.03 |
| Annual Wage (2) | $ 29,410 | $ 35,080 | $ 43,310 | $ 53,800 | $ 74,940 |
Industries with the highest published employment and wages for Grounds Maintenance Workers, All Other are provided. For a list of all industries with employment in Grounds Maintenance Workers, All Other, see the Create Customized Tables function.
Industries with the highest levels of employment in Grounds Maintenance Workers, All Other:
| Industry | Employment (1) | Percent of industry employment | Hourly mean wage | Annual mean wage (2) |
|---|---|---|---|---|
| Services to Buildings and Dwellings | 3,930 | 0.18 | $ 22.46 | $ 46,710 |
| Postal Service (Federal Government) | 1,150 | 0.18 | $ 36.29 | $ 75,480 |
| Local Government, excluding Schools and Hospitals (OEWS Designation) | 1,040 | 0.02 | $ 19.68 | $ 40,920 |
| Other Amusement and Recreation Industries | 900 | 0.07 | $ 18.11 | $ 37,670 |
| Federal, State, and Local Government, excluding State and Local Government Schools and Hospitals and the U.S. Postal Service (OEWS Designation) | 590 | 0.03 | $ 25.26 | $ 52,550 |
Industries with the highest concentration of employment in Grounds Maintenance Workers, All Other:
| Industry | Employment (1) | Percent of industry employment | Hourly mean wage | Annual mean wage (2) |
|---|---|---|---|---|
| RV (Recreational Vehicle) Parks and Recreational Camps | 200 | 0.31 | $ 16.36 | $ 34,020 |
| Postal Service (Federal Government) | 1,150 | 0.18 | $ 36.29 | $ 75,480 |
| Services to Buildings and Dwellings | 3,930 | 0.18 | $ 22.46 | $ 46,710 |
| Death Care Services | 140 | 0.10 | $ 19.81 | $ 41,210 |
| Other Amusement and Recreation Industries | 900 | 0.07 | $ 18.11 | $ 37,670 |
Top paying industries for Grounds Maintenance Workers, All Other:
| Industry | Employment (1) | Percent of industry employment | Hourly mean wage | Annual mean wage (2) |
|---|---|---|---|---|
| Postal Service (Federal Government) | 1,150 | 0.18 | $ 36.29 | $ 75,480 |
| Elementary and Secondary Schools | 200 | (7) | $ 26.37 | $ 54,850 |
| Federal, State, and Local Government, excluding State and Local Government Schools and Hospitals and the U.S. Postal Service (OEWS Designation) | 590 | 0.03 | $ 25.26 | $ 52,550 |
| Social Advocacy Organizations | 170 | 0.07 | $ 22.99 | $ 47,810 |
| Automotive Repair and Maintenance | 210 | 0.02 | $ 22.71 | $ 47,230 |
States and areas with the highest published employment, location quotients, and wages for Grounds Maintenance Workers, All Other are provided. For a list of all areas with employment in Grounds Maintenance Workers, All Other, see the Create Customized Tables function.
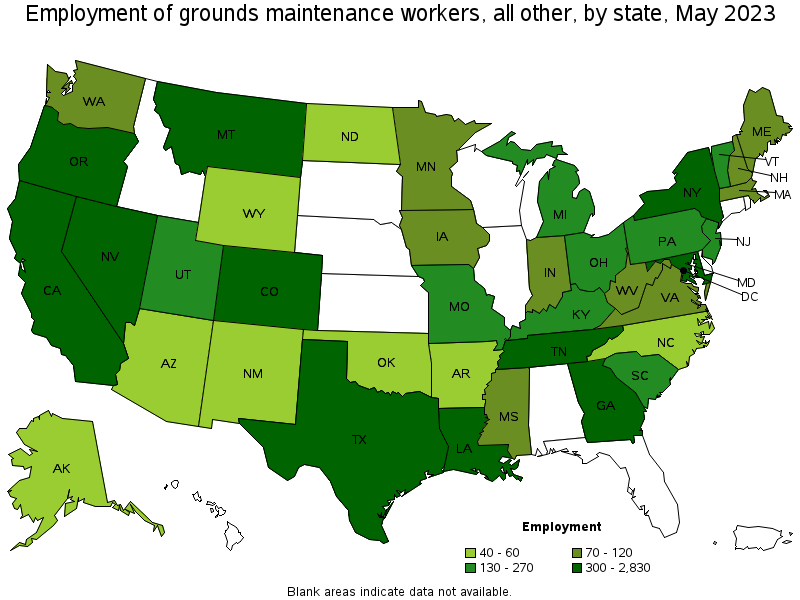
States with the highest employment level in Grounds Maintenance Workers, All Other:
| State | Employment (1) | Employment per thousand jobs | Location quotient (9) | Hourly mean wage | Annual mean wage (2) |
|---|---|---|---|---|---|
| California | 2,830 | 0.16 | 2.00 | $ 24.54 | $ 51,040 |
| Georgia | 730 | 0.15 | 1.95 | $ 18.81 | $ 39,110 |
| Colorado | 600 | 0.21 | 2.68 | $ 22.35 | $ 46,490 |
| Louisiana | 510 | 0.27 | 3.47 | $ 18.49 | $ 38,460 |
| New York | 480 | 0.05 | 0.64 | $ 23.27 | $ 48,400 |
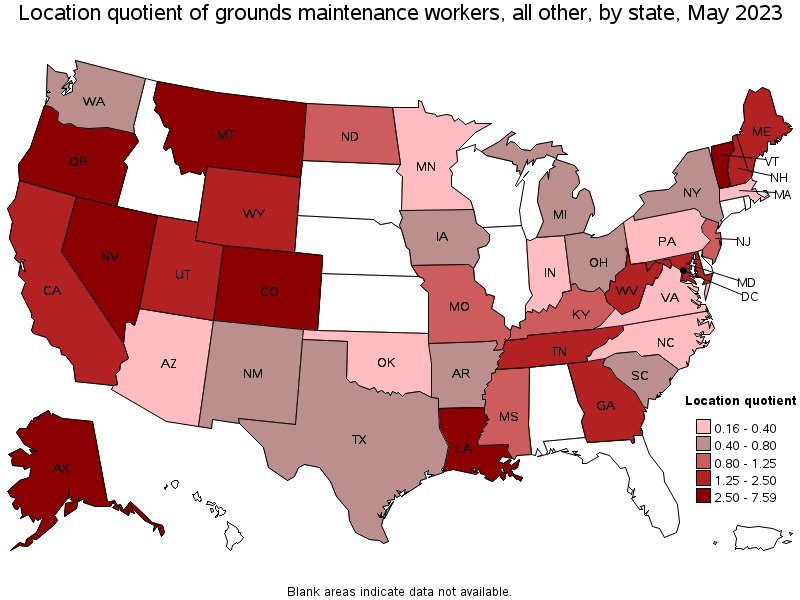
States with the highest concentration of jobs and location quotients in Grounds Maintenance Workers, All Other:
| State | Employment (1) | Employment per thousand jobs | Location quotient (9) | Hourly mean wage | Annual mean wage (2) |
|---|---|---|---|---|---|
| Montana | 300 | 0.60 | 7.59 | $ 22.61 | $ 47,040 |
| Vermont | 170 | 0.58 | 7.37 | $ 19.59 | $ 40,750 |
| Louisiana | 510 | 0.27 | 3.47 | $ 18.49 | $ 38,460 |
| Colorado | 600 | 0.21 | 2.68 | $ 22.35 | $ 46,490 |
| Nevada | 310 | 0.21 | 2.68 | $ 21.34 | $ 44,390 |
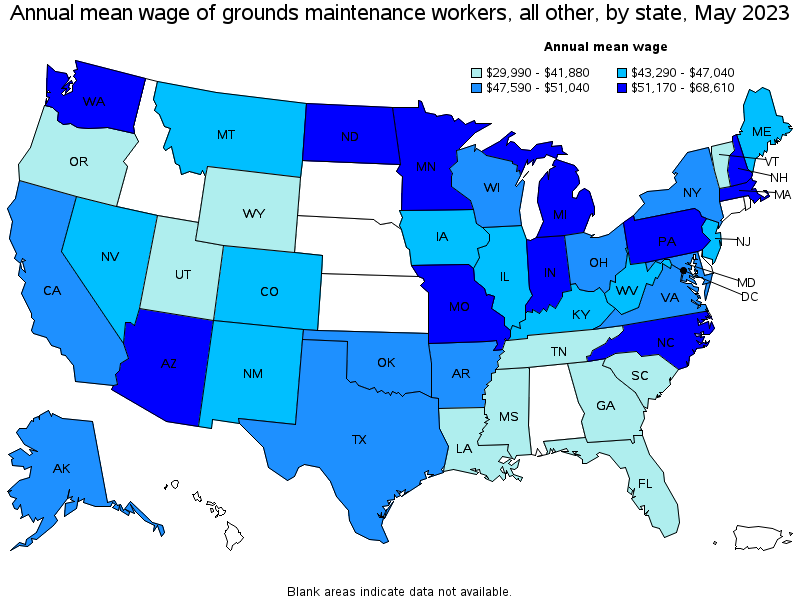
Top paying states for Grounds Maintenance Workers, All Other:
| State | Employment (1) | Employment per thousand jobs | Location quotient (9) | Hourly mean wage | Annual mean wage (2) |
|---|---|---|---|---|---|
| Washington | 120 | 0.03 | 0.42 | $ 32.99 | $ 68,610 |
| Arizona | 50 | 0.01 | 0.19 | $ 29.89 | $ 62,170 |
| North Carolina | 60 | 0.01 | 0.16 | $ 29.34 | $ 61,020 |
| Massachusetts | 90 | 0.03 | 0.33 | $ 28.56 | $ 59,400 |
| Minnesota | 90 | 0.03 | 0.39 | $ 27.47 | $ 57,140 |
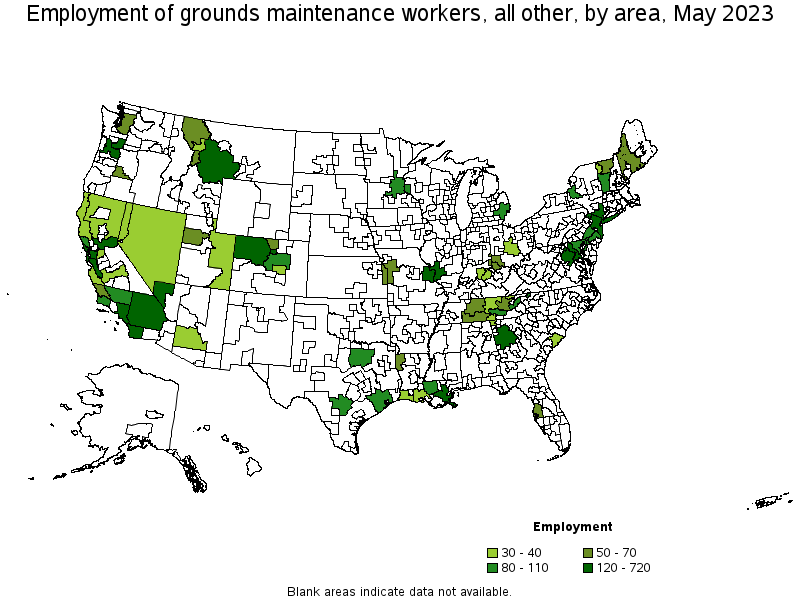
Metropolitan areas with the highest employment level in Grounds Maintenance Workers, All Other:
| Metropolitan area | Employment (1) | Employment per thousand jobs | Location quotient (9) | Hourly mean wage | Annual mean wage (2) |
|---|---|---|---|---|---|
| Los Angeles-Long Beach-Anaheim, CA | 720 | 0.12 | 1.48 | $ 24.11 | $ 50,150 |
| New York-Newark-Jersey City, NY-NJ-PA | 520 | 0.05 | 0.70 | $ 21.33 | $ 44,360 |
| Riverside-San Bernardino-Ontario, CA | 440 | 0.27 | 3.38 | $ 21.65 | $ 45,030 |
| Atlanta-Sandy Springs-Roswell, GA | 430 | 0.15 | 1.93 | $ 19.77 | $ 41,120 |
| San Diego-Carlsbad, CA | 280 | 0.18 | 2.31 | $ 23.24 | $ 48,330 |
| San Francisco-Oakland-Hayward, CA | 270 | 0.11 | 1.41 | $ 29.10 | $ 60,530 |
| Sacramento--Roseville--Arden-Arcade, CA | 240 | 0.23 | 2.87 | $ 25.54 | $ 53,130 |
| Las Vegas-Henderson-Paradise, NV | 230 | 0.21 | 2.71 | $ 20.73 | $ 43,110 |
| Washington-Arlington-Alexandria, DC-VA-MD-WV | 220 | 0.07 | 0.88 | $ 25.29 | $ 52,610 |
| Portland-Vancouver-Hillsboro, OR-WA | 190 | 0.16 | 1.98 | $ 22.05 | $ 45,870 |
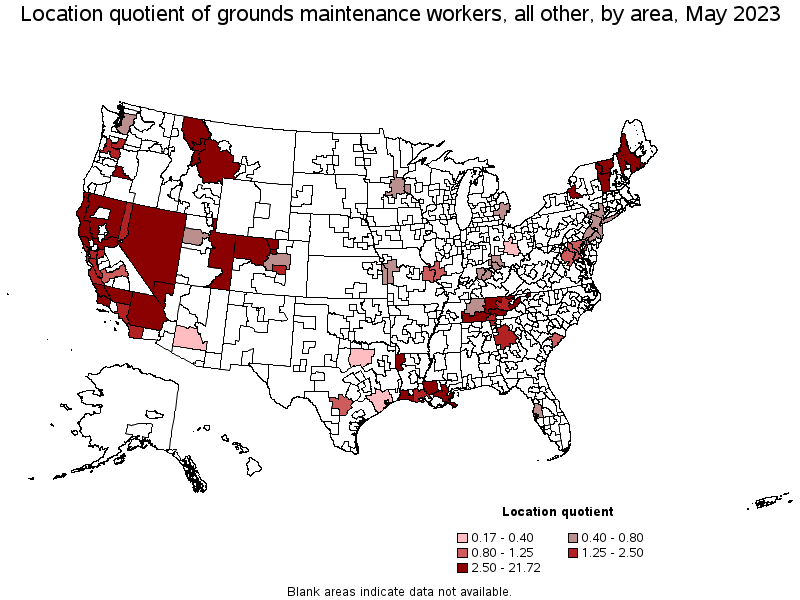
Metropolitan areas with the highest concentration of jobs and location quotients in Grounds Maintenance Workers, All Other:
| Metropolitan area | Employment (1) | Employment per thousand jobs | Location quotient (9) | Hourly mean wage | Annual mean wage (2) |
|---|---|---|---|---|---|
| Boulder, CO | 150 | 0.76 | 9.67 | $ 17.87 | $ 37,160 |
| Bend-Redmond, OR | 70 | 0.73 | 9.26 | $ 18.32 | $ 38,110 |
| Missoula, MT | 30 | 0.51 | 6.40 | $ 17.85 | $ 37,140 |
| Santa Rosa, CA | 100 | 0.50 | 6.32 | $ 26.72 | $ 55,570 |
| Lake Charles, LA | 40 | 0.44 | 5.62 | $ 14.82 | $ 30,820 |
| San Luis Obispo-Paso Robles-Arroyo Grande, CA | 50 | 0.40 | 5.08 | $ 21.70 | $ 45,130 |
| Santa Maria-Santa Barbara, CA | 80 | 0.38 | 4.84 | $ 24.94 | $ 51,880 |
| Burlington-South Burlington, VT | 40 | 0.30 | 3.83 | $ 19.25 | $ 40,030 |
| New Orleans-Metairie, LA | 160 | 0.30 | 3.82 | $ 19.03 | $ 39,590 |
| Shreveport-Bossier City, LA | 50 | 0.29 | 3.70 | $ 18.21 | $ 37,880 |
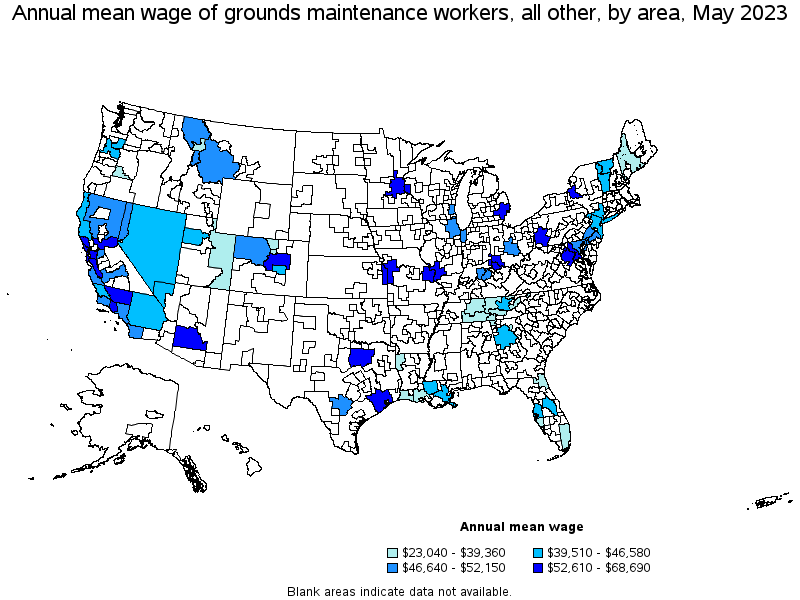
Top paying metropolitan areas for Grounds Maintenance Workers, All Other:
| Metropolitan area | Employment (1) | Employment per thousand jobs | Location quotient (9) | Hourly mean wage | Annual mean wage (2) |
|---|---|---|---|---|---|
| Pittsburgh, PA | (8) | (8) | (8) | $ 33.03 | $ 68,690 |
| Phoenix-Mesa-Scottsdale, AZ | 30 | 0.01 | 0.17 | $ 29.80 | $ 61,990 |
| San Francisco-Oakland-Hayward, CA | 270 | 0.11 | 1.41 | $ 29.10 | $ 60,530 |
| San Jose-Sunnyvale-Santa Clara, CA | 120 | 0.10 | 1.28 | $ 28.04 | $ 58,310 |
| Syracuse, NY | 80 | 0.27 | 3.44 | $ 27.80 | $ 57,820 |
| Minneapolis-St. Paul-Bloomington, MN-WI | 80 | 0.04 | 0.55 | $ 27.63 | $ 57,460 |
| Kansas City, MO-KS | 60 | 0.05 | 0.68 | $ 27.16 | $ 56,490 |
| Santa Rosa, CA | 100 | 0.50 | 6.32 | $ 26.72 | $ 55,570 |
| Dallas-Fort Worth-Arlington, TX | 90 | 0.02 | 0.29 | $ 26.66 | $ 55,450 |
| Detroit-Warren-Dearborn, MI | 100 | 0.05 | 0.65 | $ 26.61 | $ 55,360 |
Nonmetropolitan areas with the highest employment in Grounds Maintenance Workers, All Other:
| Nonmetropolitan area | Employment (1) | Employment per thousand jobs | Location quotient (9) | Hourly mean wage | Annual mean wage (2) |
|---|---|---|---|---|---|
| Northwest Colorado nonmetropolitan area | 220 | 1.71 | 21.72 | $ 23.88 | $ 49,660 |
| Southwest Montana nonmetropolitan area | 170 | 1.11 | 14.08 | $ 23.59 | $ 49,070 |
| Southern Vermont nonmetropolitan area | 80 | 0.79 | 10.03 | $ 19.87 | $ 41,330 |
| East Tennessee nonmetropolitan area | 80 | 0.54 | 6.89 | $ 12.23 | $ 25,430 |
| Southwest Maine nonmetropolitan area | 50 | 0.26 | 3.33 | $ 18.57 | $ 38,630 |
Nonmetropolitan areas with the highest concentration of jobs and location quotients in Grounds Maintenance Workers, All Other:
| Nonmetropolitan area | Employment (1) | Employment per thousand jobs | Location quotient (9) | Hourly mean wage | Annual mean wage (2) |
|---|---|---|---|---|---|
| Northwest Colorado nonmetropolitan area | 220 | 1.71 | 21.72 | $ 23.88 | $ 49,660 |
| Southwest Montana nonmetropolitan area | 170 | 1.11 | 14.08 | $ 23.59 | $ 49,070 |
| Southern Vermont nonmetropolitan area | 80 | 0.79 | 10.03 | $ 19.87 | $ 41,330 |
| Northern Vermont nonmetropolitan area | 50 | 0.65 | 8.29 | $ 19.39 | $ 40,330 |
| West Montana nonmetropolitan area | 50 | 0.57 | 7.18 | $ 23.41 | $ 48,690 |
Top paying nonmetropolitan areas for Grounds Maintenance Workers, All Other:
| Nonmetropolitan area | Employment (1) | Employment per thousand jobs | Location quotient (9) | Hourly mean wage | Annual mean wage (2) |
|---|---|---|---|---|---|
| Northwest Colorado nonmetropolitan area | 220 | 1.71 | 21.72 | $ 23.88 | $ 49,660 |
| Southwest Montana nonmetropolitan area | 170 | 1.11 | 14.08 | $ 23.59 | $ 49,070 |
| West Montana nonmetropolitan area | 50 | 0.57 | 7.18 | $ 23.41 | $ 48,690 |
| North Valley-Northern Mountains Region of California nonmetropolitan area | 40 | 0.37 | 4.69 | $ 23.40 | $ 48,670 |
| North Coast Region of California nonmetropolitan area | 30 | 0.31 | 3.93 | $ 22.34 | $ 46,470 |
These estimates are calculated with data collected from employers in all industry sectors, all metropolitan and nonmetropolitan areas, and all states and the District of Columbia. The top employment and wage figures are provided above. The complete list is available in the downloadable XLS files.
The percentile wage estimate is the value of a wage below which a certain percent of workers fall. The median wage is the 50th percentile wage estimate—50 percent of workers earn less than the median and 50 percent of workers earn more than the median. More about percentile wages.
(1) Estimates for detailed occupations do not sum to the totals because the totals include occupations not shown separately. Estimates do not include self-employed workers.
(2) Annual wages have been calculated by multiplying the hourly mean wage by a "year-round, full-time" hours figure of 2,080 hours; for those occupations where there is not an hourly wage published, the annual wage has been directly calculated from the reported survey data.
(3) The relative standard error (RSE) is a measure of the reliability of a survey statistic. The smaller the relative standard error, the more precise the estimate.
(7) The value is less than .005 percent of industry employment.
(8) Estimate not released.
(9) The location quotient is the ratio of the area concentration of occupational employment to the national average concentration. A location quotient greater than one indicates the occupation has a higher share of employment than average, and a location quotient less than one indicates the occupation is less prevalent in the area than average.
Other OEWS estimates and related information:
May 2023 National Occupational Employment and Wage Estimates
May 2023 State Occupational Employment and Wage Estimates
May 2023 Metropolitan and Nonmetropolitan Area Occupational Employment and Wage Estimates
May 2023 National Industry-Specific Occupational Employment and Wage Estimates
Last Modified Date: April 3, 2024