An official website of the United States government
 United States Department of Labor
Operate or tend washing or dry-cleaning machines to wash or dry-clean industrial or household articles, such as cloth garments, suede, leather, furs, blankets, draperies, linens, rugs, and carpets. Includes spotters and dyers of these articles.
Employment estimate and mean wage estimates for Laundry and Dry-Cleaning Workers:
| Employment (1) | Employment RSE (3) |
Mean hourly wage |
Mean annual wage (2) |
Wage RSE (3) |
|---|---|---|---|---|
| 185,000 | 0.9 % | $ 15.33 | $ 31,880 | 0.2 % |
Percentile wage estimates for Laundry and Dry-Cleaning Workers:
| Percentile | 10% | 25% | 50% (Median) |
75% | 90% |
|---|---|---|---|---|---|
| Hourly Wage | $ 11.38 | $ 13.31 | $ 14.93 | $ 17.05 | $ 18.71 |
| Annual Wage (2) | $ 23,670 | $ 27,690 | $ 31,050 | $ 35,460 | $ 38,920 |
Industries with the highest published employment and wages for Laundry and Dry-Cleaning Workers are provided. For a list of all industries with employment in Laundry and Dry-Cleaning Workers, see the Create Customized Tables function.
Industries with the highest levels of employment in Laundry and Dry-Cleaning Workers:
| Industry | Employment (1) | Percent of industry employment | Hourly mean wage | Annual mean wage (2) |
|---|---|---|---|---|
| Drycleaning and Laundry Services | 89,670 | 35.30 | $ 15.17 | $ 31,560 |
| Traveler Accommodation | 36,570 | 1.98 | $ 15.43 | $ 32,090 |
| Nursing Care Facilities (Skilled Nursing Facilities) | 20,320 | 1.47 | $ 14.40 | $ 29,960 |
| General Medical and Surgical Hospitals | 6,970 | 0.12 | $ 17.83 | $ 37,090 |
| Employment Services | 6,240 | 0.17 | $ 14.82 | $ 30,820 |
Industries with the highest concentration of employment in Laundry and Dry-Cleaning Workers:
| Industry | Employment (1) | Percent of industry employment | Hourly mean wage | Annual mean wage (2) |
|---|---|---|---|---|
| Drycleaning and Laundry Services | 89,670 | 35.30 | $ 15.17 | $ 31,560 |
| Traveler Accommodation | 36,570 | 1.98 | $ 15.43 | $ 32,090 |
| Nursing Care Facilities (Skilled Nursing Facilities) | 20,320 | 1.47 | $ 14.40 | $ 29,960 |
| Rooming and Boarding Houses, Dormitories, and Workers' Camps | 80 | 0.77 | $ 14.15 | $ 29,430 |
| Rental and Leasing Services (5322, 5323, and 5324 only) | 2,290 | 0.66 | $ 15.69 | $ 32,620 |
Top paying industries for Laundry and Dry-Cleaning Workers:
| Industry | Employment (1) | Percent of industry employment | Hourly mean wage | Annual mean wage (2) |
|---|---|---|---|---|
| Federal, State, and Local Government, excluding State and Local Government Schools and Hospitals and the U.S. Postal Service (OEWS Designation) | 910 | 0.04 | $ 21.53 | $ 44,770 |
| Offices of Physicians | 170 | 0.01 | $ 21.29 | $ 44,290 |
| State Government, excluding Schools and Hospitals (OEWS Designation) | 1,180 | 0.06 | $ 20.64 | $ 42,920 |
| Warehousing and Storage | 130 | 0.01 | $ 19.99 | $ 41,570 |
| Amusement Parks and Arcades | 220 | 0.10 | $ 19.16 | $ 39,850 |
States and areas with the highest published employment, location quotients, and wages for Laundry and Dry-Cleaning Workers are provided. For a list of all areas with employment in Laundry and Dry-Cleaning Workers, see the Create Customized Tables function.
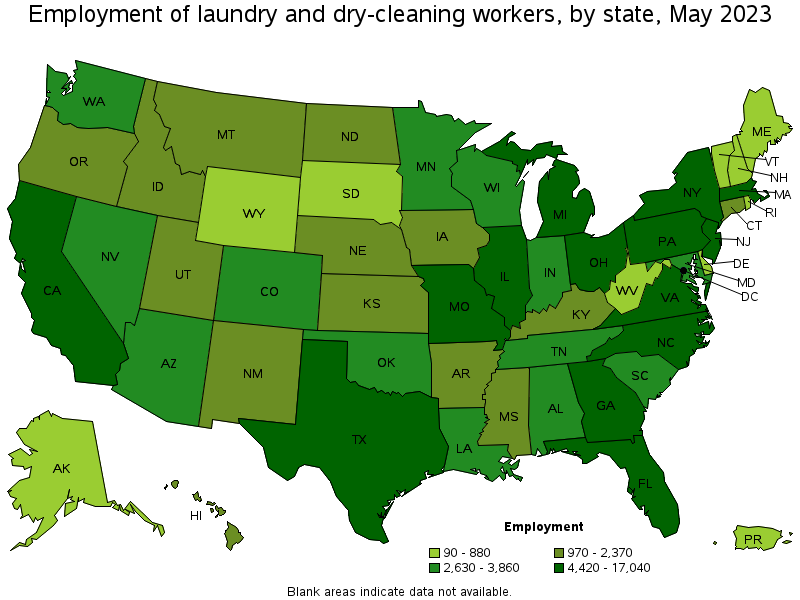
States with the highest employment level in Laundry and Dry-Cleaning Workers:
| State | Employment (1) | Employment per thousand jobs | Location quotient (9) | Hourly mean wage | Annual mean wage (2) |
|---|---|---|---|---|---|
| California | 17,040 | 0.95 | 0.78 | $ 18.17 | $ 37,790 |
| Florida | 14,940 | 1.56 | 1.28 | $ 14.23 | $ 29,600 |
| Texas | 14,050 | 1.04 | 0.85 | $ 13.87 | $ 28,850 |
| New York | 12,490 | 1.33 | 1.09 | $ 17.31 | $ 36,000 |
| Illinois | 7,180 | 1.19 | 0.98 | $ 16.24 | $ 33,780 |

States with the highest concentration of jobs and location quotients in Laundry and Dry-Cleaning Workers:
| State | Employment (1) | Employment per thousand jobs | Location quotient (9) | Hourly mean wage | Annual mean wage (2) |
|---|---|---|---|---|---|
| Hawaii | 1,680 | 2.72 | 2.23 | $ 17.42 | $ 36,240 |
| Nevada | 3,760 | 2.53 | 2.08 | $ 15.76 | $ 32,780 |
| Montana | 1,170 | 2.33 | 1.91 | $ 15.49 | $ 32,210 |
| North Dakota | 970 | 2.31 | 1.90 | $ 16.90 | $ 35,140 |
| Idaho | 1,630 | 1.98 | 1.63 | $ 16.23 | $ 33,760 |
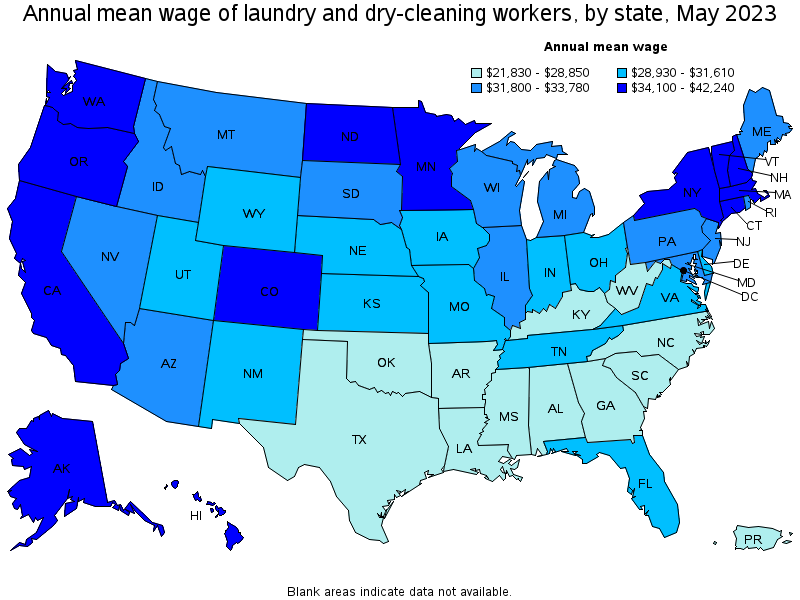
Top paying states for Laundry and Dry-Cleaning Workers:
| State | Employment (1) | Employment per thousand jobs | Location quotient (9) | Hourly mean wage | Annual mean wage (2) |
|---|---|---|---|---|---|
| District of Columbia | 270 | 0.38 | 0.31 | $ 20.31 | $ 42,240 |
| Washington | 3,660 | 1.05 | 0.86 | $ 18.32 | $ 38,100 |
| California | 17,040 | 0.95 | 0.78 | $ 18.17 | $ 37,790 |
| Alaska | 480 | 1.55 | 1.28 | $ 17.98 | $ 37,400 |
| Hawaii | 1,680 | 2.72 | 2.23 | $ 17.42 | $ 36,240 |
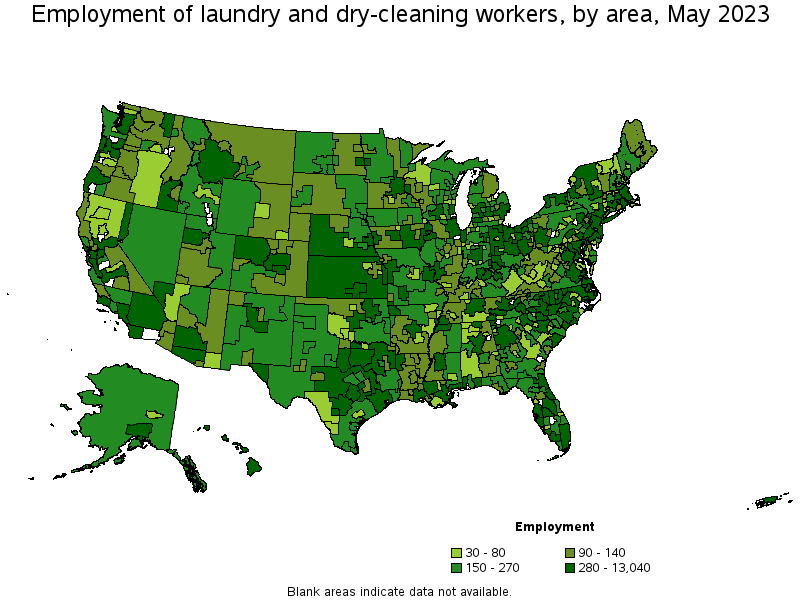
Metropolitan areas with the highest employment level in Laundry and Dry-Cleaning Workers:
| Metropolitan area | Employment (1) | Employment per thousand jobs | Location quotient (9) | Hourly mean wage | Annual mean wage (2) |
|---|---|---|---|---|---|
| New York-Newark-Jersey City, NY-NJ-PA | 13,040 | 1.37 | 1.13 | $ 17.39 | $ 36,170 |
| Los Angeles-Long Beach-Anaheim, CA | 6,120 | 0.99 | 0.81 | $ 18.10 | $ 37,640 |
| Chicago-Naperville-Elgin, IL-IN-WI | 5,460 | 1.21 | 0.99 | $ 16.52 | $ 34,350 |
| Miami-Fort Lauderdale-West Palm Beach, FL | 4,620 | 1.70 | 1.39 | $ 14.22 | $ 29,580 |
| Dallas-Fort Worth-Arlington, TX | 3,620 | 0.91 | 0.75 | $ 14.34 | $ 29,830 |
| Boston-Cambridge-Nashua, MA-NH | 3,390 | 1.23 | 1.01 | $ 17.30 | $ 35,980 |
| Washington-Arlington-Alexandria, DC-VA-MD-WV | 3,160 | 1.02 | 0.84 | $ 16.47 | $ 34,250 |
| Houston-The Woodlands-Sugar Land, TX | 3,140 | 0.99 | 0.81 | $ 13.78 | $ 28,660 |
| Las Vegas-Henderson-Paradise, NV | 3,000 | 2.77 | 2.28 | $ 15.83 | $ 32,930 |
| Atlanta-Sandy Springs-Roswell, GA | 2,970 | 1.06 | 0.87 | $ 13.33 | $ 27,720 |
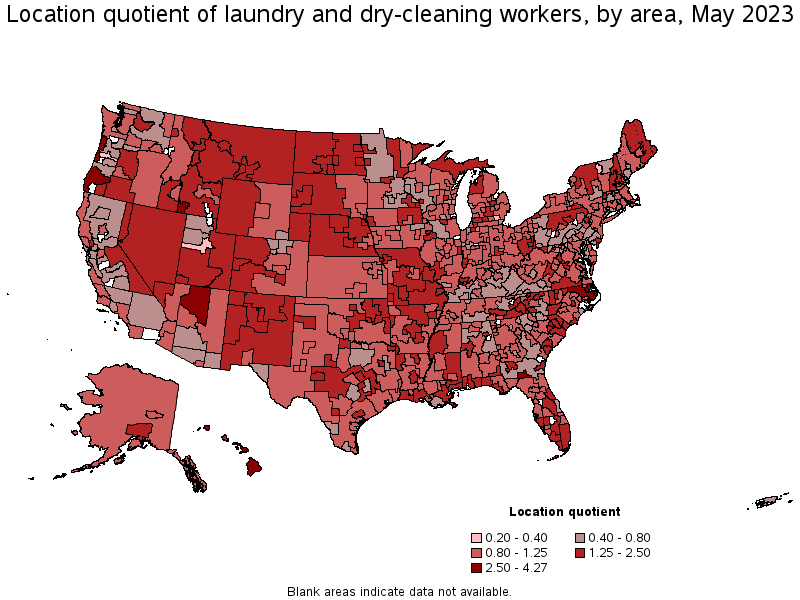
Metropolitan areas with the highest concentration of jobs and location quotients in Laundry and Dry-Cleaning Workers:
| Metropolitan area | Employment (1) | Employment per thousand jobs | Location quotient (9) | Hourly mean wage | Annual mean wage (2) |
|---|---|---|---|---|---|
| Kahului-Wailuku-Lahaina, HI | 390 | 5.21 | 4.27 | $ 17.77 | $ 36,950 |
| Valdosta, GA | 260 | 4.87 | 4.00 | (8) | (8) |
| Twin Falls, ID | 220 | 4.48 | 3.67 | $ 15.51 | $ 32,260 |
| Flagstaff, AZ | 220 | 3.38 | 2.77 | $ 16.71 | $ 34,750 |
| New Bedford, MA | 220 | 3.38 | 2.77 | $ 15.99 | $ 33,260 |
| Las Vegas-Henderson-Paradise, NV | 3,000 | 2.77 | 2.28 | $ 15.83 | $ 32,930 |
| Bismarck, ND | 200 | 2.74 | 2.25 | $ 17.08 | $ 35,520 |
| Pensacola-Ferry Pass-Brent, FL | 500 | 2.73 | 2.24 | $ 13.82 | $ 28,750 |
| Pittsfield, MA | 100 | 2.69 | 2.21 | $ 16.50 | $ 34,330 |
| Morgantown, WV | 170 | 2.67 | 2.19 | $ 13.17 | $ 27,390 |
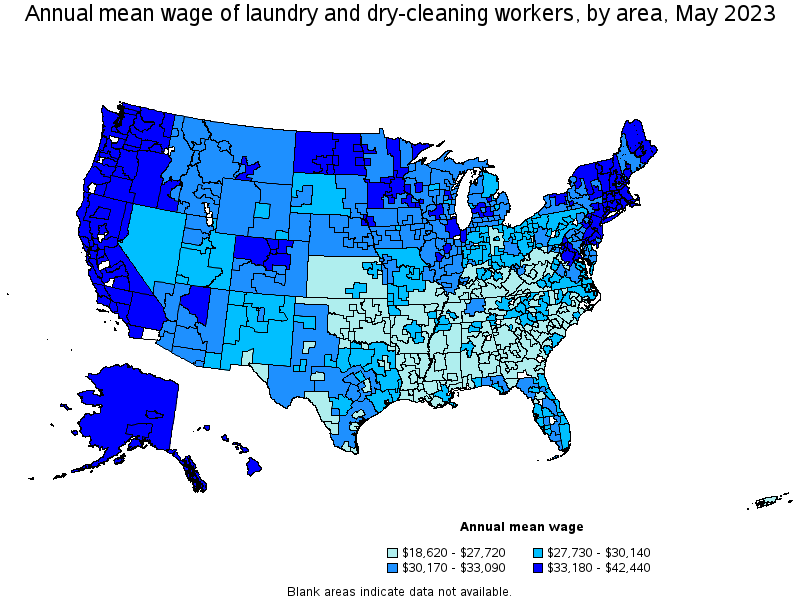
Top paying metropolitan areas for Laundry and Dry-Cleaning Workers:
| Metropolitan area | Employment (1) | Employment per thousand jobs | Location quotient (9) | Hourly mean wage | Annual mean wage (2) |
|---|---|---|---|---|---|
| San Jose-Sunnyvale-Santa Clara, CA | 670 | 0.59 | 0.48 | $ 20.41 | $ 42,440 |
| San Francisco-Oakland-Hayward, CA | 1,830 | 0.76 | 0.62 | $ 20.29 | $ 42,190 |
| Madera, CA | 30 | 0.67 | 0.55 | $ 19.67 | $ 40,900 |
| Napa, CA | 140 | 1.85 | 1.52 | $ 19.49 | $ 40,550 |
| Seattle-Tacoma-Bellevue, WA | 2,110 | 1.02 | 0.83 | $ 19.02 | $ 39,570 |
| Anchorage, AK | 290 | 1.68 | 1.38 | $ 18.60 | $ 38,700 |
| Santa Rosa, CA | 250 | 1.22 | 1.00 | $ 18.47 | $ 38,410 |
| Portland-Vancouver-Hillsboro, OR-WA | 1,000 | 0.83 | 0.68 | $ 18.11 | $ 37,670 |
| Los Angeles-Long Beach-Anaheim, CA | 6,120 | 0.99 | 0.81 | $ 18.10 | $ 37,640 |
| Santa Maria-Santa Barbara, CA | 300 | 1.49 | 1.22 | $ 18.01 | $ 37,460 |
Nonmetropolitan areas with the highest employment in Laundry and Dry-Cleaning Workers:
| Nonmetropolitan area | Employment (1) | Employment per thousand jobs | Location quotient (9) | Hourly mean wage | Annual mean wage (2) |
|---|---|---|---|---|---|
| Kansas nonmetropolitan area | 530 | 1.37 | 1.12 | $ 12.67 | $ 26,350 |
| North Northeastern Ohio nonmetropolitan area (noncontiguous) | 470 | 1.45 | 1.19 | $ 13.67 | $ 28,440 |
| Piedmont North Carolina nonmetropolitan area | 420 | 1.63 | 1.34 | $ 12.74 | $ 26,500 |
| East Tennessee nonmetropolitan area | 390 | 2.81 | 2.30 | $ 13.01 | $ 27,060 |
| Hill Country Region of Texas nonmetropolitan area | 380 | 1.86 | 1.53 | $ 15.68 | $ 32,610 |
Nonmetropolitan areas with the highest concentration of jobs and location quotients in Laundry and Dry-Cleaning Workers:
| Nonmetropolitan area | Employment (1) | Employment per thousand jobs | Location quotient (9) | Hourly mean wage | Annual mean wage (2) |
|---|---|---|---|---|---|
| Hawaii / Kauai nonmetropolitan area | 350 | 3.41 | 2.80 | $ 19.66 | $ 40,880 |
| Northeast Coastal North Carolina nonmetropolitan area | 290 | 3.15 | 2.58 | $ 13.77 | $ 28,640 |
| Coast Oregon nonmetropolitan area | 350 | 3.04 | 2.50 | $ 16.49 | $ 34,300 |
| West Montana nonmetropolitan area | 230 | 2.84 | 2.33 | $ 15.55 | $ 32,340 |
| East Tennessee nonmetropolitan area | 390 | 2.81 | 2.30 | $ 13.01 | $ 27,060 |
Top paying nonmetropolitan areas for Laundry and Dry-Cleaning Workers:
| Nonmetropolitan area | Employment (1) | Employment per thousand jobs | Location quotient (9) | Hourly mean wage | Annual mean wage (2) |
|---|---|---|---|---|---|
| Hawaii / Kauai nonmetropolitan area | 350 | 3.41 | 2.80 | $ 19.66 | $ 40,880 |
| Massachusetts nonmetropolitan area | 60 | 1.01 | 0.83 | $ 18.23 | $ 37,920 |
| Eastern Sierra-Mother Lode Region of California nonmetropolitan area | 120 | 1.98 | 1.62 | $ 18.19 | $ 37,830 |
| Eastern Washington nonmetropolitan area | 100 | 0.92 | 0.75 | $ 17.76 | $ 36,940 |
| North Coast Region of California nonmetropolitan area | 120 | 1.18 | 0.96 | $ 17.55 | $ 36,510 |
These estimates are calculated with data collected from employers in all industry sectors, all metropolitan and nonmetropolitan areas, and all states and the District of Columbia. The top employment and wage figures are provided above. The complete list is available in the downloadable XLS files.
The percentile wage estimate is the value of a wage below which a certain percent of workers fall. The median wage is the 50th percentile wage estimate—50 percent of workers earn less than the median and 50 percent of workers earn more than the median. More about percentile wages.
(1) Estimates for detailed occupations do not sum to the totals because the totals include occupations not shown separately. Estimates do not include self-employed workers.
(2) Annual wages have been calculated by multiplying the hourly mean wage by a "year-round, full-time" hours figure of 2,080 hours; for those occupations where there is not an hourly wage published, the annual wage has been directly calculated from the reported survey data.
(3) The relative standard error (RSE) is a measure of the reliability of a survey statistic. The smaller the relative standard error, the more precise the estimate.
(8) Estimate not released.
(9) The location quotient is the ratio of the area concentration of occupational employment to the national average concentration. A location quotient greater than one indicates the occupation has a higher share of employment than average, and a location quotient less than one indicates the occupation is less prevalent in the area than average.
Other OEWS estimates and related information:
May 2023 National Occupational Employment and Wage Estimates
May 2023 State Occupational Employment and Wage Estimates
May 2023 Metropolitan and Nonmetropolitan Area Occupational Employment and Wage Estimates
May 2023 National Industry-Specific Occupational Employment and Wage Estimates
Last Modified Date: April 3, 2024