
An official website of the United States government
An official website of the United States government
The .gov means it's official.
Federal government websites often end in .gov or .mil. Before sharing sensitive information,
make sure you're on a federal government site.
The site is secure.
The
https:// ensures that you are connecting to the official website and that any
information you provide is encrypted and transmitted securely.
Construct, decorate, or repair leather and leather-like products, such as luggage, shoes, and saddles. May use hand tools.
Employment estimate and mean wage estimates for Shoe and Leather Workers and Repairers:
| Employment (1) | Employment RSE (3) |
Mean hourly wage |
Mean annual wage (2) |
Wage RSE (3) |
|---|---|---|---|---|
| 7,230 | 7.2 % | $ 17.80 | $ 37,030 | 2.0 % |
Percentile wage estimates for Shoe and Leather Workers and Repairers:
| Percentile | 10% | 25% | 50% (Median) |
75% | 90% |
|---|---|---|---|---|---|
| Hourly Wage | $ 12.32 | $ 14.23 | $ 17.32 | $ 20.19 | $ 23.29 |
| Annual Wage (2) | $ 25,620 | $ 29,600 | $ 36,020 | $ 41,990 | $ 48,440 |
Industries with the highest published employment and wages for Shoe and Leather Workers and Repairers are provided. For a list of all industries with employment in Shoe and Leather Workers and Repairers, see the Create Customized Tables function.
Industries with the highest levels of employment in Shoe and Leather Workers and Repairers:
| Industry | Employment (1) | Percent of industry employment | Hourly mean wage | Annual mean wage (2) |
|---|---|---|---|---|
| Other Leather and Allied Product Manufacturing | 2,490 | 22.66 | $ 16.55 | $ 34,430 |
| Footwear Manufacturing | 2,080 | 18.56 | $ 17.78 | $ 36,980 |
| Personal and Household Goods Repair and Maintenance | 590 | 0.69 | $ 18.06 | $ 37,570 |
| Leather and Hide Tanning and Finishing | 530 | 16.26 | $ 18.09 | $ 37,620 |
| Shoe Retailers | 400 | 0.23 | $ 22.07 | $ 45,910 |
Industries with the highest concentration of employment in Shoe and Leather Workers and Repairers:
| Industry | Employment (1) | Percent of industry employment | Hourly mean wage | Annual mean wage (2) |
|---|---|---|---|---|
| Other Leather and Allied Product Manufacturing | 2,490 | 22.66 | $ 16.55 | $ 34,430 |
| Footwear Manufacturing | 2,080 | 18.56 | $ 17.78 | $ 36,980 |
| Leather and Hide Tanning and Finishing | 530 | 16.26 | $ 18.09 | $ 37,620 |
| Personal and Household Goods Repair and Maintenance | 590 | 0.69 | $ 18.06 | $ 37,570 |
| Apparel Accessories and Other Apparel Manufacturing | 50 | 0.38 | $ 13.49 | $ 28,050 |
Top paying industries for Shoe and Leather Workers and Repairers:
| Industry | Employment (1) | Percent of industry employment | Hourly mean wage | Annual mean wage (2) |
|---|---|---|---|---|
| Shoe Retailers | 400 | 0.23 | $ 22.07 | $ 45,910 |
| Apparel, Piece Goods, and Notions Merchant Wholesalers | 350 | 0.24 | $ 20.59 | $ 42,820 |
| Clothing and Clothing Accessories Retailers | 30 | (7) | $ 19.86 | $ 41,310 |
| Sporting Goods, Hobby, and Musical Instrument Retailers | 300 | 0.06 | $ 19.57 | $ 40,710 |
| Jewelry, Luggage, and Leather Goods Retailers | 170 | 0.14 | $ 18.42 | $ 38,310 |
States and areas with the highest published employment, location quotients, and wages for Shoe and Leather Workers and Repairers are provided. For a list of all areas with employment in Shoe and Leather Workers and Repairers, see the Create Customized Tables function.
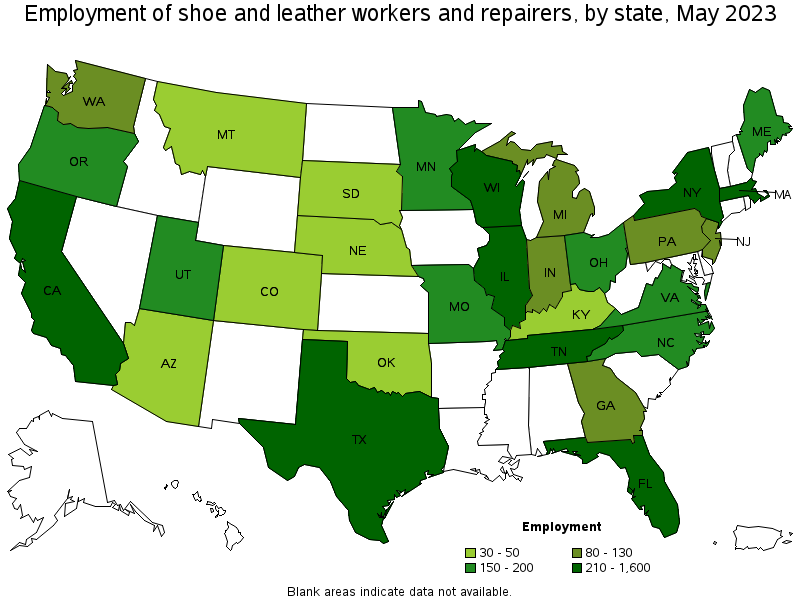
States with the highest employment level in Shoe and Leather Workers and Repairers:
| State | Employment (1) | Employment per thousand jobs | Location quotient (9) | Hourly mean wage | Annual mean wage (2) |
|---|---|---|---|---|---|
| Texas | 1,600 | 0.12 | 2.49 | $ 15.96 | $ 33,190 |
| Florida | 640 | 0.07 | 1.40 | $ 16.54 | $ 34,400 |
| California | 580 | 0.03 | 0.67 | $ 18.96 | $ 39,440 |
| Wisconsin | 400 | 0.14 | 2.93 | $ 20.29 | $ 42,210 |
| Massachusetts | 360 | 0.10 | 2.06 | $ 20.51 | $ 42,660 |
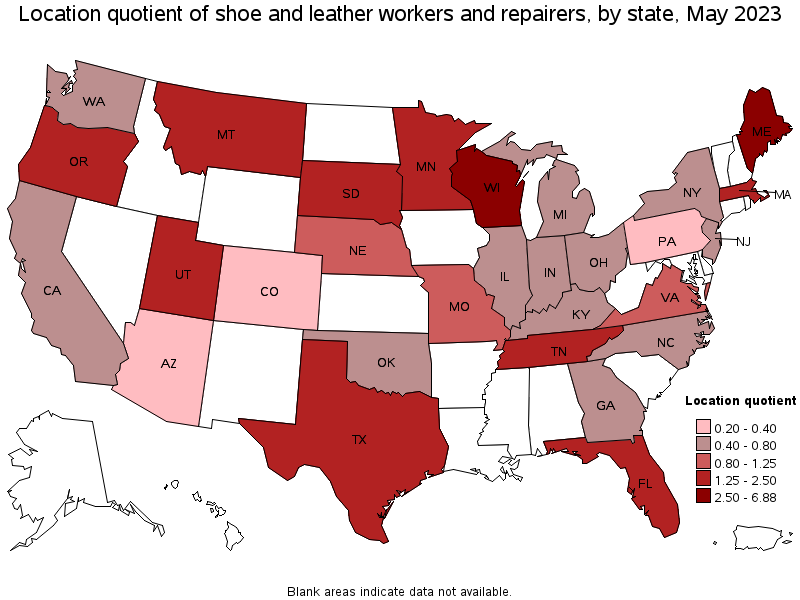
States with the highest concentration of jobs and location quotients in Shoe and Leather Workers and Repairers:
| State | Employment (1) | Employment per thousand jobs | Location quotient (9) | Hourly mean wage | Annual mean wage (2) |
|---|---|---|---|---|---|
| Maine | 200 | 0.33 | 6.88 | $ 18.06 | $ 37,560 |
| Wisconsin | 400 | 0.14 | 2.93 | $ 20.29 | $ 42,210 |
| Texas | 1,600 | 0.12 | 2.49 | $ 15.96 | $ 33,190 |
| Tennessee | 360 | 0.11 | 2.32 | $ 20.32 | $ 42,270 |
| Utah | 170 | 0.10 | 2.16 | $ 17.33 | $ 36,050 |
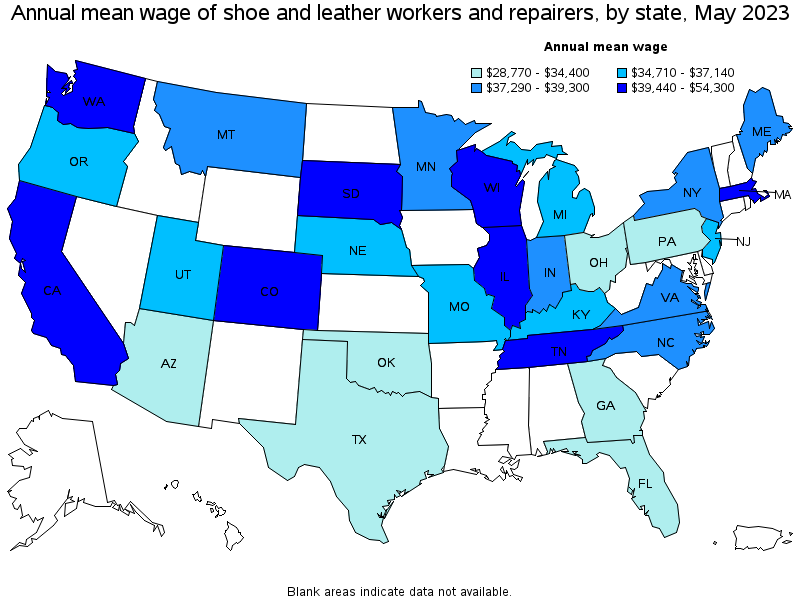
Top paying states for Shoe and Leather Workers and Repairers:
| State | Employment (1) | Employment per thousand jobs | Location quotient (9) | Hourly mean wage | Annual mean wage (2) |
|---|---|---|---|---|---|
| Washington | 130 | 0.04 | 0.77 | $ 26.11 | $ 54,300 |
| Illinois | 210 | 0.04 | 0.75 | $ 21.20 | $ 44,100 |
| Massachusetts | 360 | 0.10 | 2.06 | $ 20.51 | $ 42,660 |
| Tennessee | 360 | 0.11 | 2.32 | $ 20.32 | $ 42,270 |
| Wisconsin | 400 | 0.14 | 2.93 | $ 20.29 | $ 42,210 |
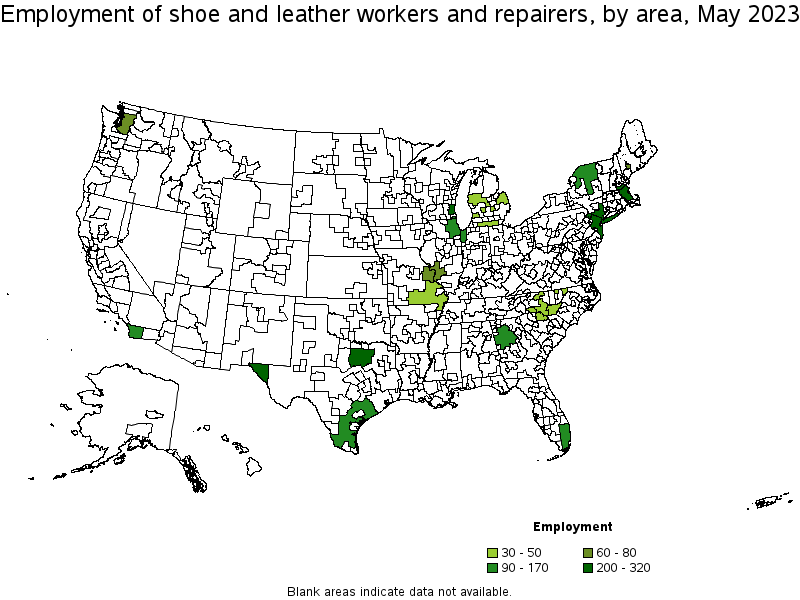
Metropolitan areas with the highest employment level in Shoe and Leather Workers and Repairers:
| Metropolitan area | Employment (1) | Employment per thousand jobs | Location quotient (9) | Hourly mean wage | Annual mean wage (2) |
|---|---|---|---|---|---|
| New York-Newark-Jersey City, NY-NJ-PA | 320 | 0.03 | 0.70 | $ 18.88 | $ 39,260 |
| Dallas-Fort Worth-Arlington, TX | 310 | 0.08 | 1.63 | $ 17.89 | $ 37,210 |
| Boston-Cambridge-Nashua, MA-NH | 260 | 0.09 | 1.96 | $ 21.16 | $ 44,000 |
| Milwaukee-Waukesha-West Allis, WI | 210 | 0.26 | 5.50 | $ 20.52 | $ 42,680 |
| El Paso, TX | 200 | 0.62 | 13.02 | $ 14.21 | $ 29,560 |
| Miami-Fort Lauderdale-West Palm Beach, FL | 140 | 0.05 | 1.09 | $ 18.16 | $ 37,770 |
| Chicago-Naperville-Elgin, IL-IN-WI | 130 | 0.03 | 0.60 | (8) | (8) |
| San Diego-Carlsbad, CA | 90 | 0.06 | 1.28 | $ 18.77 | $ 39,040 |
| Atlanta-Sandy Springs-Roswell, GA | 90 | 0.03 | 0.64 | $ 14.19 | $ 29,520 |
| Seattle-Tacoma-Bellevue, WA | 80 | 0.04 | 0.78 | $ 28.77 | $ 59,840 |
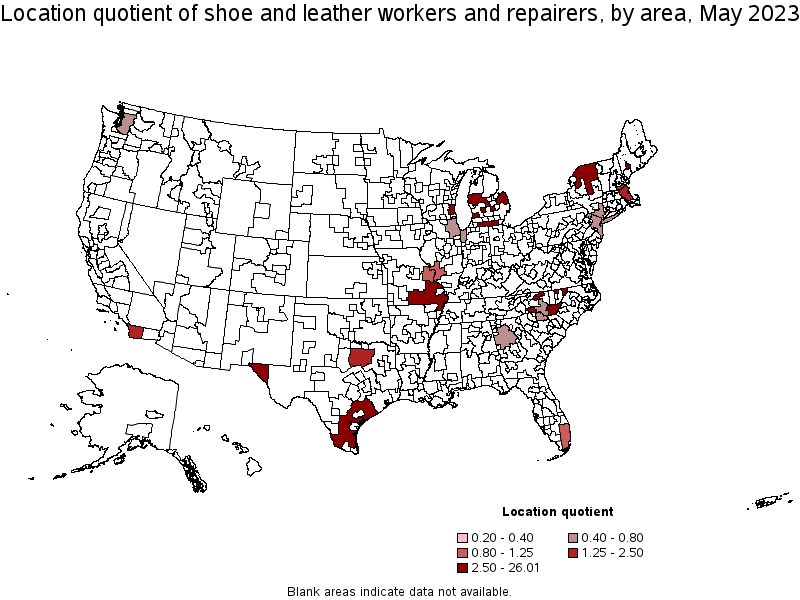
Metropolitan areas with the highest concentration of jobs and location quotients in Shoe and Leather Workers and Repairers:
| Metropolitan area | Employment (1) | Employment per thousand jobs | Location quotient (9) | Hourly mean wage | Annual mean wage (2) |
|---|---|---|---|---|---|
| Lewiston-Auburn, ME | 60 | 1.24 | 26.01 | $ 17.44 | $ 36,270 |
| El Paso, TX | 200 | 0.62 | 13.02 | $ 14.21 | $ 29,560 |
| Milwaukee-Waukesha-West Allis, WI | 210 | 0.26 | 5.50 | $ 20.52 | $ 42,680 |
| Boston-Cambridge-Nashua, MA-NH | 260 | 0.09 | 1.96 | $ 21.16 | $ 44,000 |
| Dallas-Fort Worth-Arlington, TX | 310 | 0.08 | 1.63 | $ 17.89 | $ 37,210 |
| San Diego-Carlsbad, CA | 90 | 0.06 | 1.28 | $ 18.77 | $ 39,040 |
| St. Louis, MO-IL | 70 | 0.05 | 1.14 | $ 18.03 | $ 37,510 |
| Miami-Fort Lauderdale-West Palm Beach, FL | 140 | 0.05 | 1.09 | $ 18.16 | $ 37,770 |
| Seattle-Tacoma-Bellevue, WA | 80 | 0.04 | 0.78 | $ 28.77 | $ 59,840 |
| New York-Newark-Jersey City, NY-NJ-PA | 320 | 0.03 | 0.70 | $ 18.88 | $ 39,260 |
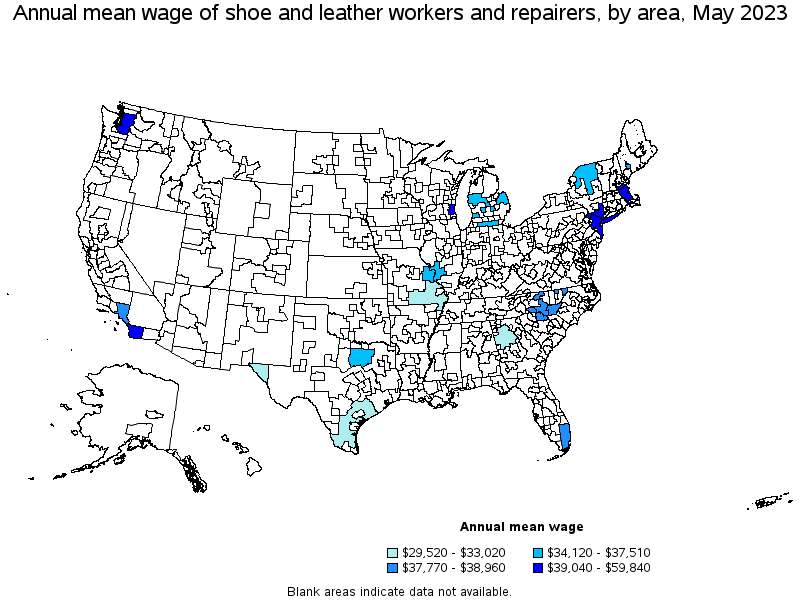
Top paying metropolitan areas for Shoe and Leather Workers and Repairers:
| Metropolitan area | Employment (1) | Employment per thousand jobs | Location quotient (9) | Hourly mean wage | Annual mean wage (2) |
|---|---|---|---|---|---|
| Seattle-Tacoma-Bellevue, WA | 80 | 0.04 | 0.78 | $ 28.77 | $ 59,840 |
| Boston-Cambridge-Nashua, MA-NH | 260 | 0.09 | 1.96 | $ 21.16 | $ 44,000 |
| Milwaukee-Waukesha-West Allis, WI | 210 | 0.26 | 5.50 | $ 20.52 | $ 42,680 |
| New York-Newark-Jersey City, NY-NJ-PA | 320 | 0.03 | 0.70 | $ 18.88 | $ 39,260 |
| San Diego-Carlsbad, CA | 90 | 0.06 | 1.28 | $ 18.77 | $ 39,040 |
| Los Angeles-Long Beach-Anaheim, CA | (8) | (8) | (8) | $ 18.73 | $ 38,960 |
| Charlotte-Concord-Gastonia, NC-SC | 30 | 0.02 | 0.48 | $ 18.29 | $ 38,050 |
| Miami-Fort Lauderdale-West Palm Beach, FL | 140 | 0.05 | 1.09 | $ 18.16 | $ 37,770 |
| St. Louis, MO-IL | 70 | 0.05 | 1.14 | $ 18.03 | $ 37,510 |
| Dallas-Fort Worth-Arlington, TX | 310 | 0.08 | 1.63 | $ 17.89 | $ 37,210 |
Nonmetropolitan areas with the highest employment in Shoe and Leather Workers and Repairers:
| Nonmetropolitan area | Employment (1) | Employment per thousand jobs | Location quotient (9) | Hourly mean wage | Annual mean wage (2) |
|---|---|---|---|---|---|
| Coastal Plains Region of Texas nonmetropolitan area | 170 | 1.16 | 24.35 | $ 15.88 | $ 33,020 |
| Capital/Northern New York nonmetropolitan area | 90 | 0.61 | 12.87 | $ 17.84 | $ 37,110 |
| Southeast Missouri nonmetropolitan area | 50 | 0.34 | 7.10 | $ 15.00 | $ 31,200 |
| Balance of Lower Peninsula of Michigan nonmetropolitan area | 50 | 0.19 | 3.95 | $ 16.41 | $ 34,120 |
| Piedmont North Carolina nonmetropolitan area | 30 | 0.13 | 2.76 | $ 18.53 | $ 38,550 |
Nonmetropolitan areas with the highest concentration of jobs and location quotients in Shoe and Leather Workers and Repairers:
| Nonmetropolitan area | Employment (1) | Employment per thousand jobs | Location quotient (9) | Hourly mean wage | Annual mean wage (2) |
|---|---|---|---|---|---|
| Coastal Plains Region of Texas nonmetropolitan area | 170 | 1.16 | 24.35 | $ 15.88 | $ 33,020 |
| Capital/Northern New York nonmetropolitan area | 90 | 0.61 | 12.87 | $ 17.84 | $ 37,110 |
| Southeast Missouri nonmetropolitan area | 50 | 0.34 | 7.10 | $ 15.00 | $ 31,200 |
| Balance of Lower Peninsula of Michigan nonmetropolitan area | 50 | 0.19 | 3.95 | $ 16.41 | $ 34,120 |
| Piedmont North Carolina nonmetropolitan area | 30 | 0.13 | 2.76 | $ 18.53 | $ 38,550 |
Top paying nonmetropolitan areas for Shoe and Leather Workers and Repairers:
| Nonmetropolitan area | Employment (1) | Employment per thousand jobs | Location quotient (9) | Hourly mean wage | Annual mean wage (2) |
|---|---|---|---|---|---|
| Piedmont North Carolina nonmetropolitan area | 30 | 0.13 | 2.76 | $ 18.53 | $ 38,550 |
| Capital/Northern New York nonmetropolitan area | 90 | 0.61 | 12.87 | $ 17.84 | $ 37,110 |
| Balance of Lower Peninsula of Michigan nonmetropolitan area | 50 | 0.19 | 3.95 | $ 16.41 | $ 34,120 |
| Coastal Plains Region of Texas nonmetropolitan area | 170 | 1.16 | 24.35 | $ 15.88 | $ 33,020 |
| Southeast Missouri nonmetropolitan area | 50 | 0.34 | 7.10 | $ 15.00 | $ 31,200 |
These estimates are calculated with data collected from employers in all industry sectors, all metropolitan and nonmetropolitan areas, and all states and the District of Columbia. The top employment and wage figures are provided above. The complete list is available in the downloadable XLS files.
The percentile wage estimate is the value of a wage below which a certain percent of workers fall. The median wage is the 50th percentile wage estimate—50 percent of workers earn less than the median and 50 percent of workers earn more than the median. More about percentile wages.
(1) Estimates for detailed occupations do not sum to the totals because the totals include occupations not shown separately. Estimates do not include self-employed workers.
(2) Annual wages have been calculated by multiplying the hourly mean wage by a "year-round, full-time" hours figure of 2,080 hours; for those occupations where there is not an hourly wage published, the annual wage has been directly calculated from the reported survey data.
(3) The relative standard error (RSE) is a measure of the reliability of a survey statistic. The smaller the relative standard error, the more precise the estimate.
(7) The value is less than .005 percent of industry employment.
(8) Estimate not released.
(9) The location quotient is the ratio of the area concentration of occupational employment to the national average concentration. A location quotient greater than one indicates the occupation has a higher share of employment than average, and a location quotient less than one indicates the occupation is less prevalent in the area than average.
Other OEWS estimates and related information:
May 2023 National Occupational Employment and Wage Estimates
May 2023 State Occupational Employment and Wage Estimates
May 2023 Metropolitan and Nonmetropolitan Area Occupational Employment and Wage Estimates
May 2023 National Industry-Specific Occupational Employment and Wage Estimates
Last Modified Date: April 3, 2024