
An official website of the United States government
An official website of the United States government
The .gov means it's official.
Federal government websites often end in .gov or .mil. Before sharing sensitive information,
make sure you're on a federal government site.
The site is secure.
The
https:// ensures that you are connecting to the official website and that any
information you provide is encrypted and transmitted securely.
All textile, apparel, and furnishings workers not listed separately.
Employment estimate and mean wage estimates for Textile, Apparel, and Furnishings Workers, All Other:
| Employment (1) | Employment RSE (3) |
Mean hourly wage |
Mean annual wage (2) |
Wage RSE (3) |
|---|---|---|---|---|
| 15,080 | 3.9 % | $ 18.00 | $ 37,430 | 1.1 % |
Percentile wage estimates for Textile, Apparel, and Furnishings Workers, All Other:
| Percentile | 10% | 25% | 50% (Median) |
75% | 90% |
|---|---|---|---|---|---|
| Hourly Wage | $ 13.48 | $ 14.50 | $ 16.89 | $ 19.57 | $ 23.95 |
| Annual Wage (2) | $ 28,030 | $ 30,150 | $ 35,130 | $ 40,710 | $ 49,810 |
Industries with the highest published employment and wages for Textile, Apparel, and Furnishings Workers, All Other are provided. For a list of all industries with employment in Textile, Apparel, and Furnishings Workers, All Other, see the Create Customized Tables function.
Industries with the highest levels of employment in Textile, Apparel, and Furnishings Workers, All Other:
| Industry | Employment (1) | Percent of industry employment | Hourly mean wage | Annual mean wage (2) |
|---|---|---|---|---|
| Other Textile Product Mills | 2,140 | 3.56 | $ 17.98 | $ 37,400 |
| Cut and Sew Apparel Manufacturing | 1,140 | 1.62 | $ 16.76 | $ 34,850 |
| Apparel Accessories and Other Apparel Manufacturing | 910 | 7.10 | $ 16.81 | $ 34,950 |
| Employment Services | 770 | 0.02 | $ 15.94 | $ 33,150 |
| Apparel, Piece Goods, and Notions Merchant Wholesalers | 710 | 0.49 | $ 20.17 | $ 41,950 |
Industries with the highest concentration of employment in Textile, Apparel, and Furnishings Workers, All Other:
| Industry | Employment (1) | Percent of industry employment | Hourly mean wage | Annual mean wage (2) |
|---|---|---|---|---|
| Apparel Accessories and Other Apparel Manufacturing | 910 | 7.10 | $ 16.81 | $ 34,950 |
| Apparel Knitting Mills | 400 | 5.67 | $ 15.60 | $ 32,450 |
| Leather and Hide Tanning and Finishing | 180 | 5.51 | $ 21.59 | $ 44,900 |
| Other Textile Product Mills | 2,140 | 3.56 | $ 17.98 | $ 37,400 |
| Cut and Sew Apparel Manufacturing | 1,140 | 1.62 | $ 16.76 | $ 34,850 |
Top paying industries for Textile, Apparel, and Furnishings Workers, All Other:
| Industry | Employment (1) | Percent of industry employment | Hourly mean wage | Annual mean wage (2) |
|---|---|---|---|---|
| Federal, State, and Local Government, excluding State and Local Government Schools and Hospitals and the U.S. Postal Service (OEWS Designation) | 520 | 0.02 | $ 27.89 | $ 58,020 |
| Personal and Household Goods Repair and Maintenance | 140 | 0.17 | $ 24.85 | $ 51,680 |
| Machinery, Equipment, and Supplies Merchant Wholesalers | 40 | 0.01 | $ 23.42 | $ 48,710 |
| Foundation, Structure, and Building Exterior Contractors | (8) | (8) | $ 22.77 | $ 47,370 |
| Services to Buildings and Dwellings | 360 | 0.02 | $ 21.64 | $ 45,010 |
States and areas with the highest published employment, location quotients, and wages for Textile, Apparel, and Furnishings Workers, All Other are provided. For a list of all areas with employment in Textile, Apparel, and Furnishings Workers, All Other, see the Create Customized Tables function.
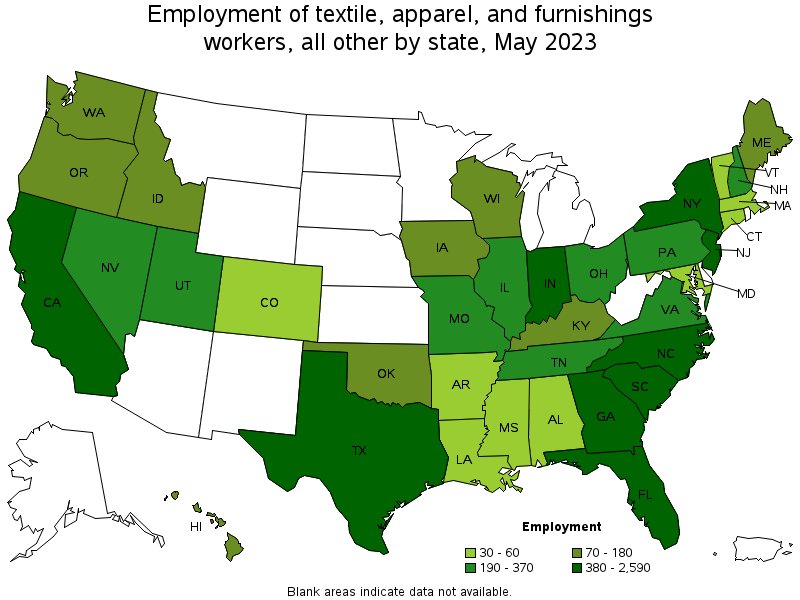
States with the highest employment level in Textile, Apparel, and Furnishings Workers, All Other:
| State | Employment (1) | Employment per thousand jobs | Location quotient (9) | Hourly mean wage | Annual mean wage (2) |
|---|---|---|---|---|---|
| California | 2,590 | 0.14 | 1.46 | $ 18.36 | $ 38,190 |
| North Carolina | 2,120 | 0.44 | 4.45 | $ 16.44 | $ 34,190 |
| Georgia | 1,440 | 0.30 | 3.04 | $ 16.54 | $ 34,400 |
| South Carolina | 800 | 0.36 | 3.62 | $ 18.91 | $ 39,330 |
| Texas | 770 | 0.06 | 0.57 | $ 15.81 | $ 32,880 |
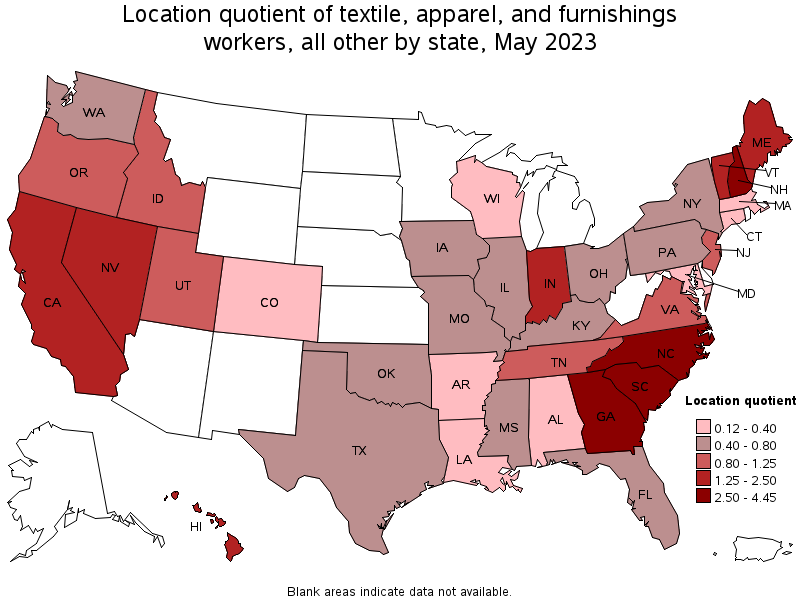
States with the highest concentration of jobs and location quotients in Textile, Apparel, and Furnishings Workers, All Other:
| State | Employment (1) | Employment per thousand jobs | Location quotient (9) | Hourly mean wage | Annual mean wage (2) |
|---|---|---|---|---|---|
| North Carolina | 2,120 | 0.44 | 4.45 | $ 16.44 | $ 34,190 |
| South Carolina | 800 | 0.36 | 3.62 | $ 18.91 | $ 39,330 |
| New Hampshire | 220 | 0.33 | 3.35 | $ 20.45 | $ 42,530 |
| Georgia | 1,440 | 0.30 | 3.04 | $ 16.54 | $ 34,400 |
| Nevada | 270 | 0.18 | 1.86 | $ 16.82 | $ 34,990 |
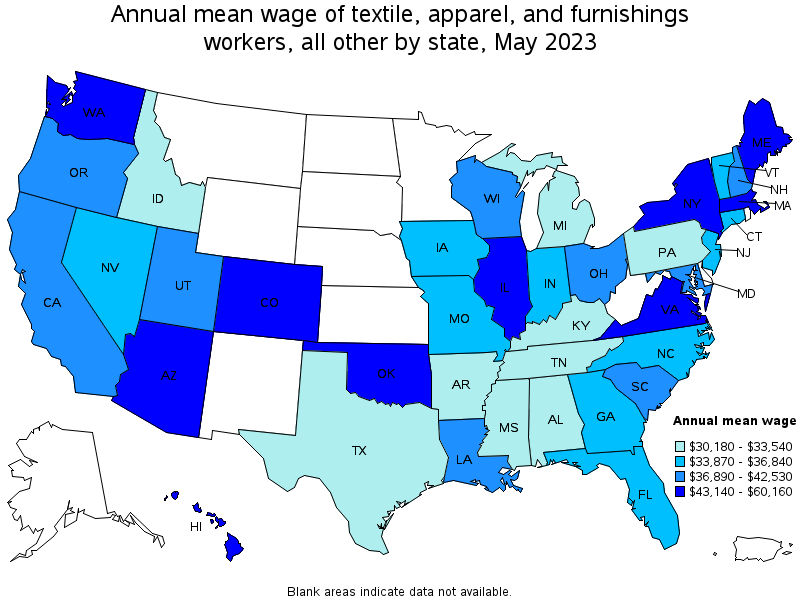
Top paying states for Textile, Apparel, and Furnishings Workers, All Other:
| State | Employment (1) | Employment per thousand jobs | Location quotient (9) | Hourly mean wage | Annual mean wage (2) |
|---|---|---|---|---|---|
| Washington | 180 | 0.05 | 0.51 | $ 28.93 | $ 60,160 |
| Hawaii | 100 | 0.17 | 1.69 | $ 26.50 | $ 55,130 |
| New York | 470 | 0.05 | 0.50 | $ 24.49 | $ 50,940 |
| Virginia | 370 | 0.09 | 0.93 | $ 23.29 | $ 48,440 |
| Maine | 110 | 0.18 | 1.85 | $ 23.18 | $ 48,220 |
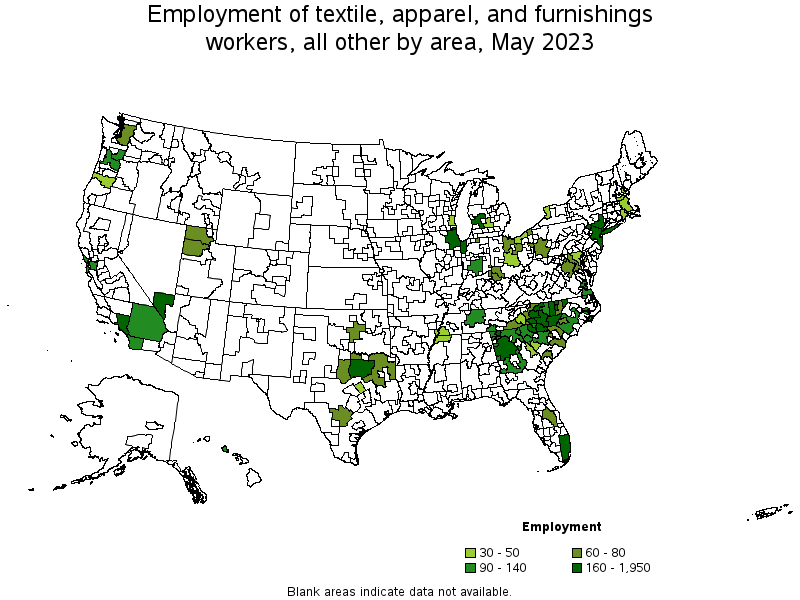
Metropolitan areas with the highest employment level in Textile, Apparel, and Furnishings Workers, All Other:
| Metropolitan area | Employment (1) | Employment per thousand jobs | Location quotient (9) | Hourly mean wage | Annual mean wage (2) |
|---|---|---|---|---|---|
| Los Angeles-Long Beach-Anaheim, CA | 1,950 | 0.32 | 3.18 | $ 18.08 | $ 37,600 |
| Dalton, GA | 560 | 8.60 | 86.57 | $ 14.94 | $ 31,080 |
| New York-Newark-Jersey City, NY-NJ-PA | 560 | 0.06 | 0.59 | $ 23.55 | $ 48,990 |
| Grand Rapids-Wyoming, MI | 420 | 0.78 | 7.82 | $ 15.90 | $ 33,060 |
| Atlanta-Sandy Springs-Roswell, GA | 330 | 0.12 | 1.18 | $ 17.11 | $ 35,590 |
| Hickory-Lenoir-Morganton, NC | 310 | 2.01 | 20.24 | $ 16.37 | $ 34,050 |
| Greensboro-High Point, NC | 300 | 0.83 | 8.35 | $ 16.47 | $ 34,250 |
| Chicago-Naperville-Elgin, IL-IN-WI | 270 | 0.06 | 0.61 | $ 21.16 | $ 44,020 |
| Dallas-Fort Worth-Arlington, TX | 270 | 0.07 | 0.68 | $ 16.81 | $ 34,970 |
| Miami-Fort Lauderdale-West Palm Beach, FL | 260 | 0.10 | 0.97 | $ 16.62 | $ 34,560 |
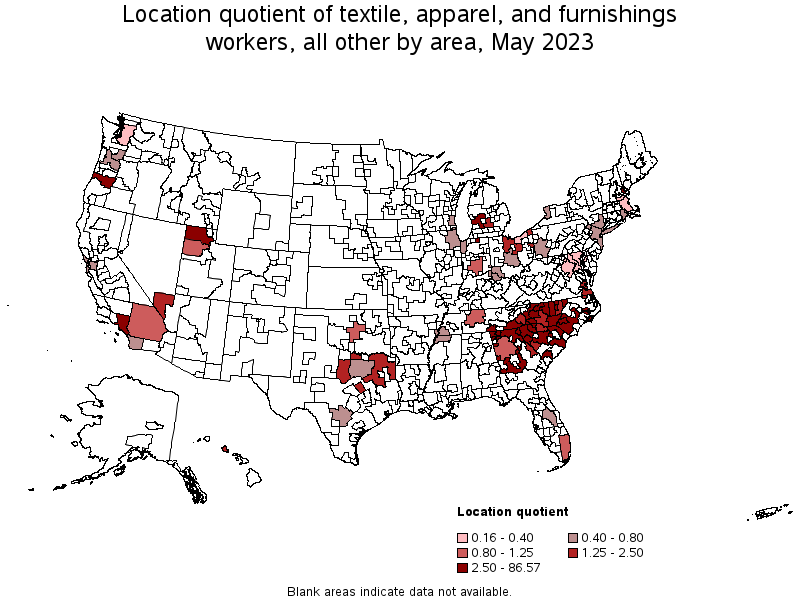
Metropolitan areas with the highest concentration of jobs and location quotients in Textile, Apparel, and Furnishings Workers, All Other:
| Metropolitan area | Employment (1) | Employment per thousand jobs | Location quotient (9) | Hourly mean wage | Annual mean wage (2) |
|---|---|---|---|---|---|
| Dalton, GA | 560 | 8.60 | 86.57 | $ 14.94 | $ 31,080 |
| Burlington, NC | 160 | 2.43 | 24.44 | $ 14.36 | $ 29,860 |
| Hickory-Lenoir-Morganton, NC | 310 | 2.01 | 20.24 | $ 16.37 | $ 34,050 |
| Spartanburg, SC | 200 | 1.24 | 12.48 | $ 19.00 | $ 39,520 |
| Dover-Durham, NH-ME | 50 | 0.99 | 9.93 | $ 23.06 | $ 47,970 |
| Greensboro-High Point, NC | 300 | 0.83 | 8.35 | $ 16.47 | $ 34,250 |
| Grand Rapids-Wyoming, MI | 420 | 0.78 | 7.82 | $ 15.90 | $ 33,060 |
| Fayetteville, NC | 70 | 0.51 | 5.10 | $ 17.07 | $ 35,510 |
| Winston-Salem, NC | 130 | 0.49 | 4.89 | $ 17.40 | $ 36,200 |
| Elkhart-Goshen, IN | 60 | 0.44 | 4.48 | $ 17.70 | $ 36,820 |
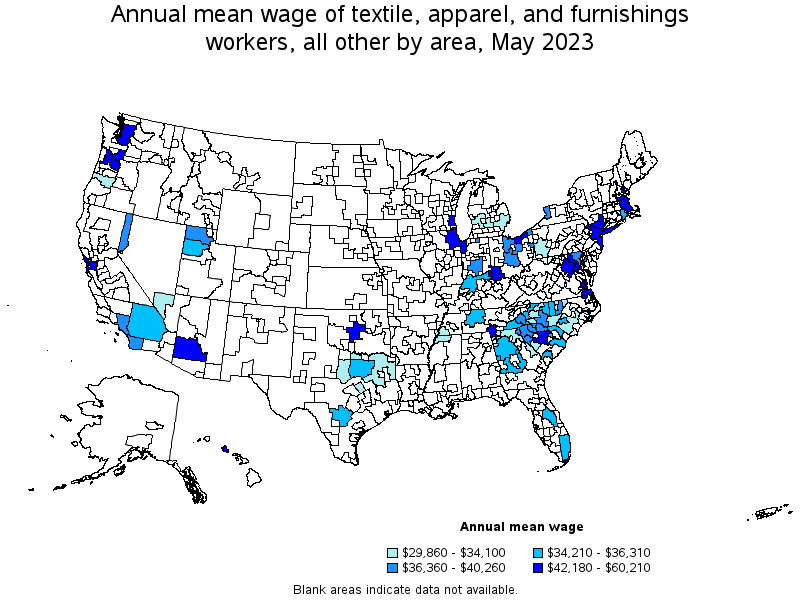
Top paying metropolitan areas for Textile, Apparel, and Furnishings Workers, All Other:
| Metropolitan area | Employment (1) | Employment per thousand jobs | Location quotient (9) | Hourly mean wage | Annual mean wage (2) |
|---|---|---|---|---|---|
| Seattle-Tacoma-Bellevue, WA | 60 | 0.03 | 0.29 | $ 28.95 | $ 60,210 |
| Urban Honolulu, HI | 90 | 0.21 | 2.16 | $ 27.21 | $ 56,590 |
| Virginia Beach-Norfolk-Newport News, VA-NC | 140 | 0.19 | 1.93 | $ 24.00 | $ 49,930 |
| New York-Newark-Jersey City, NY-NJ-PA | 560 | 0.06 | 0.59 | $ 23.55 | $ 48,990 |
| Boston-Cambridge-Nashua, MA-NH | 40 | 0.02 | 0.16 | $ 23.39 | $ 48,650 |
| Milwaukee-Waukesha-West Allis, WI | 50 | 0.06 | 0.59 | $ 23.23 | $ 48,330 |
| Dover-Durham, NH-ME | 50 | 0.99 | 9.93 | $ 23.06 | $ 47,970 |
| Phoenix-Mesa-Scottsdale, AZ | (8) | (8) | (8) | $ 22.45 | $ 46,700 |
| Oklahoma City, OK | 70 | 0.11 | 1.07 | $ 22.18 | $ 46,140 |
| Portland-Vancouver-Hillsboro, OR-WA | 90 | 0.07 | 0.75 | $ 21.19 | $ 44,070 |
Nonmetropolitan areas with the highest employment in Textile, Apparel, and Furnishings Workers, All Other:
| Nonmetropolitan area | Employment (1) | Employment per thousand jobs | Location quotient (9) | Hourly mean wage | Annual mean wage (2) |
|---|---|---|---|---|---|
| Piedmont North Carolina nonmetropolitan area | 330 | 1.30 | 13.09 | $ 15.53 | $ 32,290 |
| North Georgia nonmetropolitan area | 140 | 0.74 | 7.48 | $ 16.35 | $ 34,000 |
| Upper Savannah South Carolina nonmetropolitan area | 130 | 1.59 | 16.00 | $ 19.06 | $ 39,650 |
| Southeast Coastal North Carolina nonmetropolitan area | 110 | 0.45 | 4.48 | $ 15.17 | $ 31,560 |
| Middle Georgia nonmetropolitan area | 100 | 0.78 | 7.86 | $ 16.45 | $ 34,210 |
Nonmetropolitan areas with the highest concentration of jobs and location quotients in Textile, Apparel, and Furnishings Workers, All Other:
| Nonmetropolitan area | Employment (1) | Employment per thousand jobs | Location quotient (9) | Hourly mean wage | Annual mean wage (2) |
|---|---|---|---|---|---|
| Upper Savannah South Carolina nonmetropolitan area | 130 | 1.59 | 16.00 | $ 19.06 | $ 39,650 |
| Piedmont North Carolina nonmetropolitan area | 330 | 1.30 | 13.09 | $ 15.53 | $ 32,290 |
| Middle Georgia nonmetropolitan area | 100 | 0.78 | 7.86 | $ 16.45 | $ 34,210 |
| North Georgia nonmetropolitan area | 140 | 0.74 | 7.48 | $ 16.35 | $ 34,000 |
| Northeast South Carolina nonmetropolitan area | 60 | 0.60 | 6.07 | $ 17.07 | $ 35,500 |
Top paying nonmetropolitan areas for Textile, Apparel, and Furnishings Workers, All Other:
| Nonmetropolitan area | Employment (1) | Employment per thousand jobs | Location quotient (9) | Hourly mean wage | Annual mean wage (2) |
|---|---|---|---|---|---|
| Upper Savannah South Carolina nonmetropolitan area | 130 | 1.59 | 16.00 | $ 19.06 | $ 39,650 |
| North Northeastern Ohio nonmetropolitan area (noncontiguous) | 80 | 0.24 | 2.40 | $ 18.98 | $ 39,480 |
| Northeast South Carolina nonmetropolitan area | 60 | 0.60 | 6.07 | $ 17.07 | $ 35,500 |
| Southern Indiana nonmetropolitan area | (8) | (8) | (8) | $ 16.57 | $ 34,460 |
| Mountain North Carolina nonmetropolitan area | 70 | 0.55 | 5.55 | $ 16.51 | $ 34,350 |
These estimates are calculated with data collected from employers in all industry sectors, all metropolitan and nonmetropolitan areas, and all states and the District of Columbia. The top employment and wage figures are provided above. The complete list is available in the downloadable XLS files.
The percentile wage estimate is the value of a wage below which a certain percent of workers fall. The median wage is the 50th percentile wage estimate—50 percent of workers earn less than the median and 50 percent of workers earn more than the median. More about percentile wages.
(1) Estimates for detailed occupations do not sum to the totals because the totals include occupations not shown separately. Estimates do not include self-employed workers.
(2) Annual wages have been calculated by multiplying the hourly mean wage by a "year-round, full-time" hours figure of 2,080 hours; for those occupations where there is not an hourly wage published, the annual wage has been directly calculated from the reported survey data.
(3) The relative standard error (RSE) is a measure of the reliability of a survey statistic. The smaller the relative standard error, the more precise the estimate.
(8) Estimate not released.
(9) The location quotient is the ratio of the area concentration of occupational employment to the national average concentration. A location quotient greater than one indicates the occupation has a higher share of employment than average, and a location quotient less than one indicates the occupation is less prevalent in the area than average.
Other OEWS estimates and related information:
May 2023 National Occupational Employment and Wage Estimates
May 2023 State Occupational Employment and Wage Estimates
May 2023 Metropolitan and Nonmetropolitan Area Occupational Employment and Wage Estimates
May 2023 National Industry-Specific Occupational Employment and Wage Estimates
Last Modified Date: April 3, 2024