
An official website of the United States government
An official website of the United States government
The .gov means it's official.
Federal government websites often end in .gov or .mil. Before sharing sensitive information,
make sure you're on a federal government site.
The site is secure.
The
https:// ensures that you are connecting to the official website and that any
information you provide is encrypted and transmitted securely.
Perform work involved in developing and processing photographic images from film or digital media. May perform precision tasks such as editing photographic negatives and prints.
Employment estimate and mean wage estimates for Photographic Process Workers and Processing Machine Operators:
| Employment (1) | Employment RSE (3) |
Mean hourly wage |
Mean annual wage (2) |
Wage RSE (3) |
|---|---|---|---|---|
| 5,770 | 9.4 % | $ 20.14 | $ 41,900 | 2.6 % |
Percentile wage estimates for Photographic Process Workers and Processing Machine Operators:
| Percentile | 10% | 25% | 50% (Median) |
75% | 90% |
|---|---|---|---|---|---|
| Hourly Wage | $ 14.13 | $ 15.36 | $ 17.12 | $ 21.47 | $ 31.48 |
| Annual Wage (2) | $ 29,390 | $ 31,950 | $ 35,620 | $ 44,650 | $ 65,480 |
Industries with the highest published employment and wages for Photographic Process Workers and Processing Machine Operators are provided. For a list of all industries with employment in Photographic Process Workers and Processing Machine Operators, see the Create Customized Tables function.
Industries with the highest levels of employment in Photographic Process Workers and Processing Machine Operators:
| Industry | Employment (1) | Percent of industry employment | Hourly mean wage | Annual mean wage (2) |
|---|---|---|---|---|
| Other Professional, Scientific, and Technical Services | 1,940 | 0.23 | $ 20.08 | $ 41,770 |
| Other Personal Services | 940 | 0.23 | $ 17.58 | $ 36,560 |
| Computing Infrastructure Providers, Data Processing, Web Hosting, and Related Services | 360 | 0.07 | $ 16.97 | $ 35,300 |
| Electronics and Appliance Retailers | 260 | 0.06 | $ 16.80 | $ 34,950 |
| Management of Companies and Enterprises | 190 | 0.01 | $ 35.83 | $ 74,520 |
Industries with the highest concentration of employment in Photographic Process Workers and Processing Machine Operators:
| Industry | Employment (1) | Percent of industry employment | Hourly mean wage | Annual mean wage (2) |
|---|---|---|---|---|
| Other Professional, Scientific, and Technical Services | 1,940 | 0.23 | $ 20.08 | $ 41,770 |
| Other Personal Services | 940 | 0.23 | $ 17.58 | $ 36,560 |
| Computing Infrastructure Providers, Data Processing, Web Hosting, and Related Services | 360 | 0.07 | $ 16.97 | $ 35,300 |
| Electronics and Appliance Retailers | 260 | 0.06 | $ 16.80 | $ 34,950 |
| Printing and Related Support Activities | 170 | 0.05 | $ 17.33 | $ 36,050 |
Top paying industries for Photographic Process Workers and Processing Machine Operators:
| Industry | Employment (1) | Percent of industry employment | Hourly mean wage | Annual mean wage (2) |
|---|---|---|---|---|
| Management of Companies and Enterprises | 190 | 0.01 | $ 35.83 | $ 74,520 |
| Motion Picture and Video Industries | 80 | 0.02 | $ 35.07 | $ 72,940 |
| Other Miscellaneous Retailers | 50 | 0.01 | $ 31.76 | $ 66,060 |
| Fabricated Metal Product Manufacturing (3323 and 3324 only) | 30 | 0.01 | $ 31.30 | $ 65,110 |
| Independent Artists, Writers, and Performers | (8) | (8) | $ 29.54 | $ 61,450 |
States and areas with the highest published employment, location quotients, and wages for Photographic Process Workers and Processing Machine Operators are provided. For a list of all areas with employment in Photographic Process Workers and Processing Machine Operators, see the Create Customized Tables function.
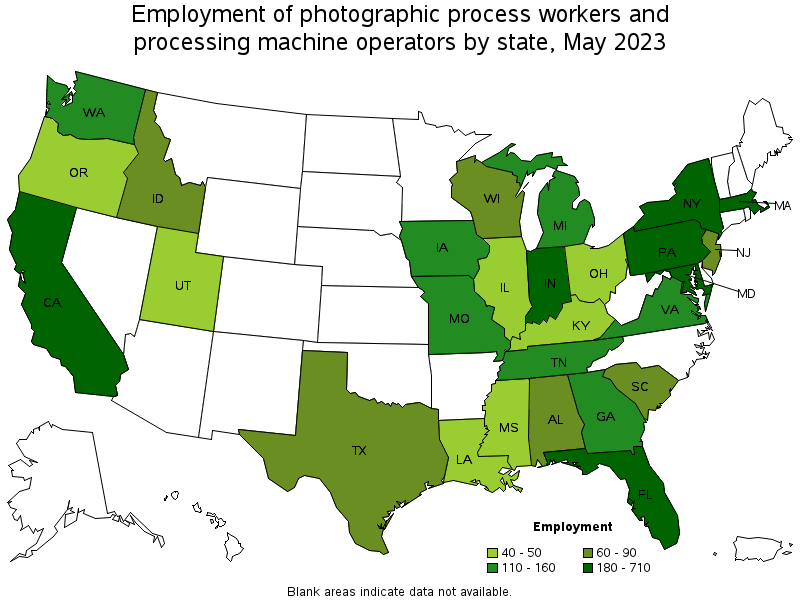
States with the highest employment level in Photographic Process Workers and Processing Machine Operators:
| State | Employment (1) | Employment per thousand jobs | Location quotient (9) | Hourly mean wage | Annual mean wage (2) |
|---|---|---|---|---|---|
| California | 710 | 0.04 | 1.04 | $ 22.43 | $ 46,650 |
| Pennsylvania | 440 | 0.07 | 1.94 | $ 18.06 | $ 37,560 |
| Massachusetts | 400 | 0.11 | 2.86 | (8) | (8) |
| Florida | 310 | 0.03 | 0.85 | $ 17.37 | $ 36,140 |
| New York | 290 | 0.03 | 0.81 | $ 34.21 | $ 71,150 |
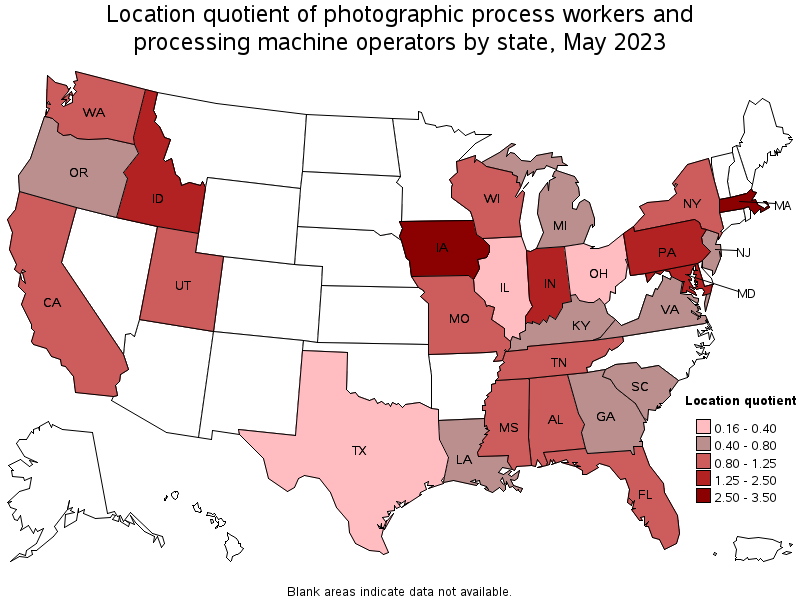
States with the highest concentration of jobs and location quotients in Photographic Process Workers and Processing Machine Operators:
| State | Employment (1) | Employment per thousand jobs | Location quotient (9) | Hourly mean wage | Annual mean wage (2) |
|---|---|---|---|---|---|
| Massachusetts | 400 | 0.11 | 2.86 | (8) | (8) |
| Iowa | 160 | 0.10 | 2.73 | $ 17.09 | $ 35,540 |
| Indiana | 240 | 0.07 | 1.96 | $ 19.09 | $ 39,710 |
| Pennsylvania | 440 | 0.07 | 1.94 | $ 18.06 | $ 37,560 |
| Maryland | 180 | 0.07 | 1.79 | (8) | (8) |
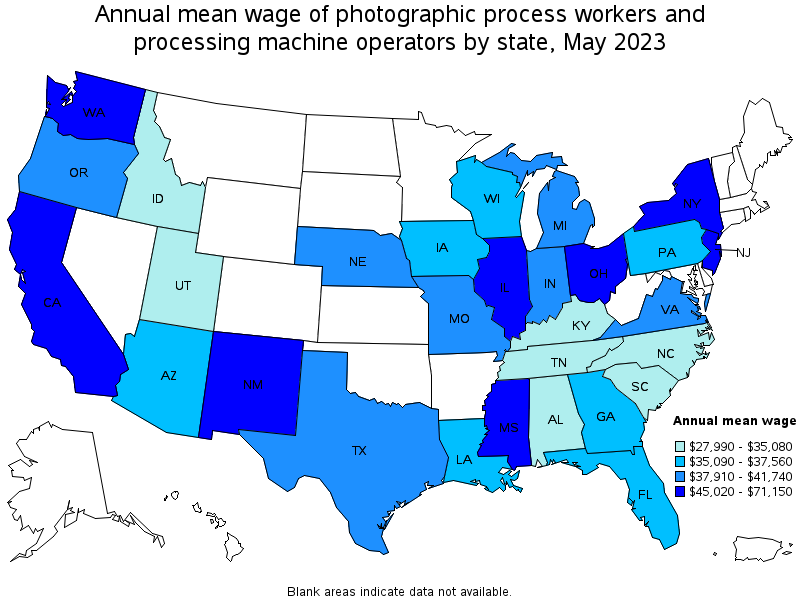
Top paying states for Photographic Process Workers and Processing Machine Operators:
| State | Employment (1) | Employment per thousand jobs | Location quotient (9) | Hourly mean wage | Annual mean wage (2) |
|---|---|---|---|---|---|
| New York | 290 | 0.03 | 0.81 | $ 34.21 | $ 71,150 |
| Washington | 120 | 0.04 | 0.93 | $ 31.36 | $ 65,230 |
| Mississippi | 40 | 0.03 | 0.84 | $ 29.21 | $ 60,760 |
| New Jersey | 90 | 0.02 | 0.58 | $ 25.15 | $ 52,310 |
| Ohio | 50 | 0.01 | 0.25 | $ 24.30 | $ 50,540 |
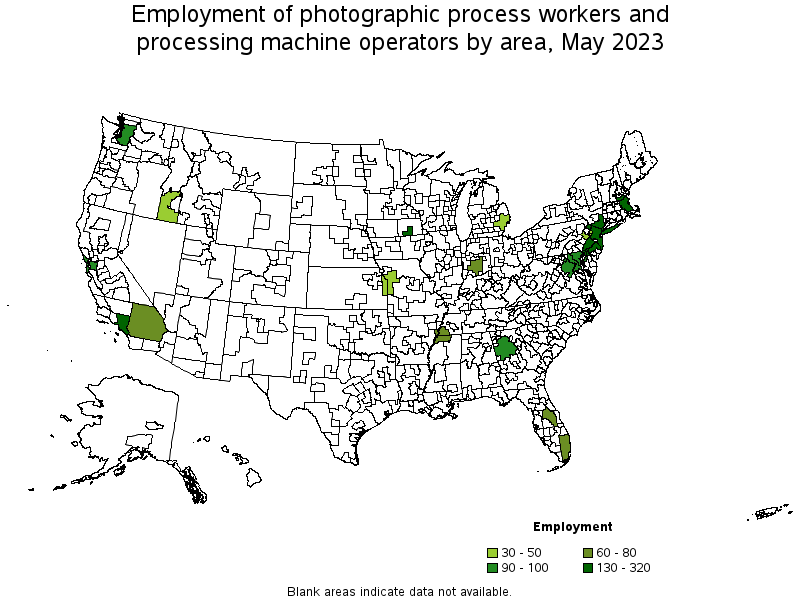
Metropolitan areas with the highest employment level in Photographic Process Workers and Processing Machine Operators:
| Metropolitan area | Employment (1) | Employment per thousand jobs | Location quotient (9) | Hourly mean wage | Annual mean wage (2) |
|---|---|---|---|---|---|
| New York-Newark-Jersey City, NY-NJ-PA | 320 | 0.03 | 0.89 | $ 33.50 | $ 69,690 |
| Boston-Cambridge-Nashua, MA-NH | 300 | 0.11 | 2.88 | (8) | (8) |
| Los Angeles-Long Beach-Anaheim, CA | 210 | 0.03 | 0.88 | $ 27.76 | $ 57,740 |
| Philadelphia-Camden-Wilmington, PA-NJ-DE-MD | 150 | 0.05 | 1.38 | $ 19.53 | $ 40,620 |
| Waterloo-Cedar Falls, IA | 130 | 1.46 | 38.35 | $ 15.42 | $ 32,070 |
| Atlanta-Sandy Springs-Roswell, GA | 100 | 0.04 | 0.96 | $ 18.06 | $ 37,560 |
| Baltimore-Columbia-Towson, MD | 100 | 0.07 | 1.96 | (8) | (8) |
| Washington-Arlington-Alexandria, DC-VA-MD-WV | 90 | 0.03 | 0.81 | $ 25.44 | $ 52,910 |
| Seattle-Tacoma-Bellevue, WA | 90 | 0.04 | 1.14 | $ 35.84 | $ 74,550 |
| San Francisco-Oakland-Hayward, CA | 90 | 0.04 | 0.95 | $ 24.53 | $ 51,020 |
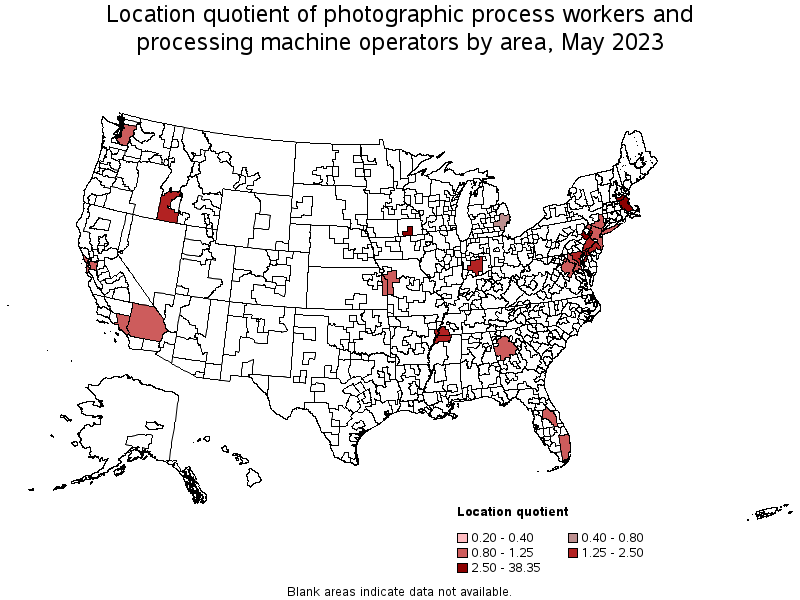
Metropolitan areas with the highest concentration of jobs and location quotients in Photographic Process Workers and Processing Machine Operators:
| Metropolitan area | Employment (1) | Employment per thousand jobs | Location quotient (9) | Hourly mean wage | Annual mean wage (2) |
|---|---|---|---|---|---|
| Waterloo-Cedar Falls, IA | 130 | 1.46 | 38.35 | $ 15.42 | $ 32,070 |
| Allentown-Bethlehem-Easton, PA-NJ | 40 | 0.11 | 2.93 | $ 18.22 | $ 37,890 |
| Boston-Cambridge-Nashua, MA-NH | 300 | 0.11 | 2.88 | (8) | (8) |
| Memphis, TN-MS-AR | 60 | 0.09 | 2.38 | $ 22.67 | $ 47,160 |
| Boise City, ID | 30 | 0.08 | 2.18 | $ 14.52 | $ 30,200 |
| Baltimore-Columbia-Towson, MD | 100 | 0.07 | 1.96 | (8) | (8) |
| Indianapolis-Carmel-Anderson, IN | 60 | 0.06 | 1.55 | $ 18.38 | $ 38,240 |
| Philadelphia-Camden-Wilmington, PA-NJ-DE-MD | 150 | 0.05 | 1.38 | $ 19.53 | $ 40,620 |
| Riverside-San Bernardino-Ontario, CA | 70 | 0.04 | 1.17 | $ 20.85 | $ 43,360 |
| Seattle-Tacoma-Bellevue, WA | 90 | 0.04 | 1.14 | $ 35.84 | $ 74,550 |
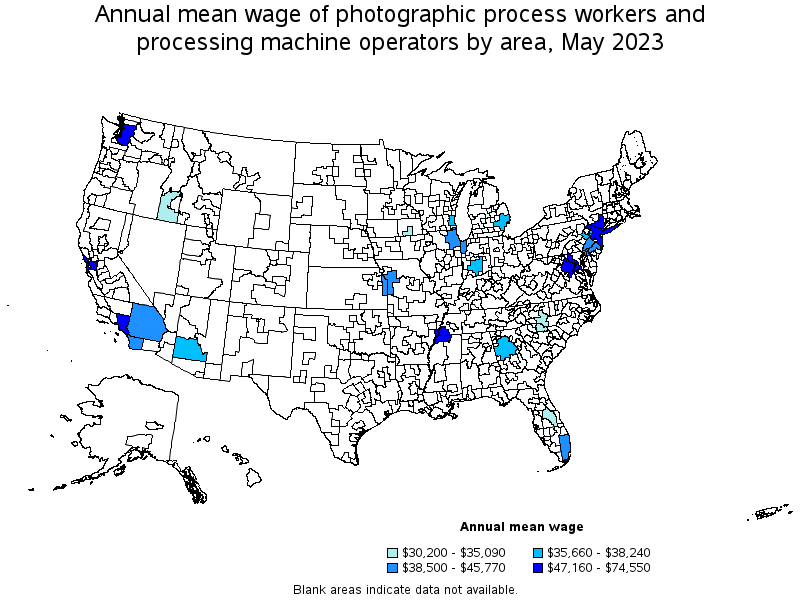
Top paying metropolitan areas for Photographic Process Workers and Processing Machine Operators:
| Metropolitan area | Employment (1) | Employment per thousand jobs | Location quotient (9) | Hourly mean wage | Annual mean wage (2) |
|---|---|---|---|---|---|
| Seattle-Tacoma-Bellevue, WA | 90 | 0.04 | 1.14 | $ 35.84 | $ 74,550 |
| New York-Newark-Jersey City, NY-NJ-PA | 320 | 0.03 | 0.89 | $ 33.50 | $ 69,690 |
| Los Angeles-Long Beach-Anaheim, CA | 210 | 0.03 | 0.88 | $ 27.76 | $ 57,740 |
| Washington-Arlington-Alexandria, DC-VA-MD-WV | 90 | 0.03 | 0.81 | $ 25.44 | $ 52,910 |
| San Francisco-Oakland-Hayward, CA | 90 | 0.04 | 0.95 | $ 24.53 | $ 51,020 |
| Memphis, TN-MS-AR | 60 | 0.09 | 2.38 | $ 22.67 | $ 47,160 |
| Kansas City, MO-KS | 50 | 0.04 | 1.13 | $ 22.01 | $ 45,770 |
| San Diego-Carlsbad, CA | (8) | (8) | (8) | $ 21.06 | $ 43,800 |
| Riverside-San Bernardino-Ontario, CA | 70 | 0.04 | 1.17 | $ 20.85 | $ 43,360 |
| Chicago-Naperville-Elgin, IL-IN-WI | (8) | (8) | (8) | $ 20.00 | $ 41,600 |
These estimates are calculated with data collected from employers in all industry sectors, all metropolitan and nonmetropolitan areas, and all states and the District of Columbia. The top employment and wage figures are provided above. The complete list is available in the downloadable XLS files.
The percentile wage estimate is the value of a wage below which a certain percent of workers fall. The median wage is the 50th percentile wage estimate—50 percent of workers earn less than the median and 50 percent of workers earn more than the median. More about percentile wages.
(1) Estimates for detailed occupations do not sum to the totals because the totals include occupations not shown separately. Estimates do not include self-employed workers.
(2) Annual wages have been calculated by multiplying the hourly mean wage by a "year-round, full-time" hours figure of 2,080 hours; for those occupations where there is not an hourly wage published, the annual wage has been directly calculated from the reported survey data.
(3) The relative standard error (RSE) is a measure of the reliability of a survey statistic. The smaller the relative standard error, the more precise the estimate.
(8) Estimate not released.
(9) The location quotient is the ratio of the area concentration of occupational employment to the national average concentration. A location quotient greater than one indicates the occupation has a higher share of employment than average, and a location quotient less than one indicates the occupation is less prevalent in the area than average.
Other OEWS estimates and related information:
May 2023 National Occupational Employment and Wage Estimates
May 2023 State Occupational Employment and Wage Estimates
May 2023 Metropolitan and Nonmetropolitan Area Occupational Employment and Wage Estimates
May 2023 National Industry-Specific Occupational Employment and Wage Estimates
Last Modified Date: April 3, 2024