An official website of the United States government
 United States Department of Labor
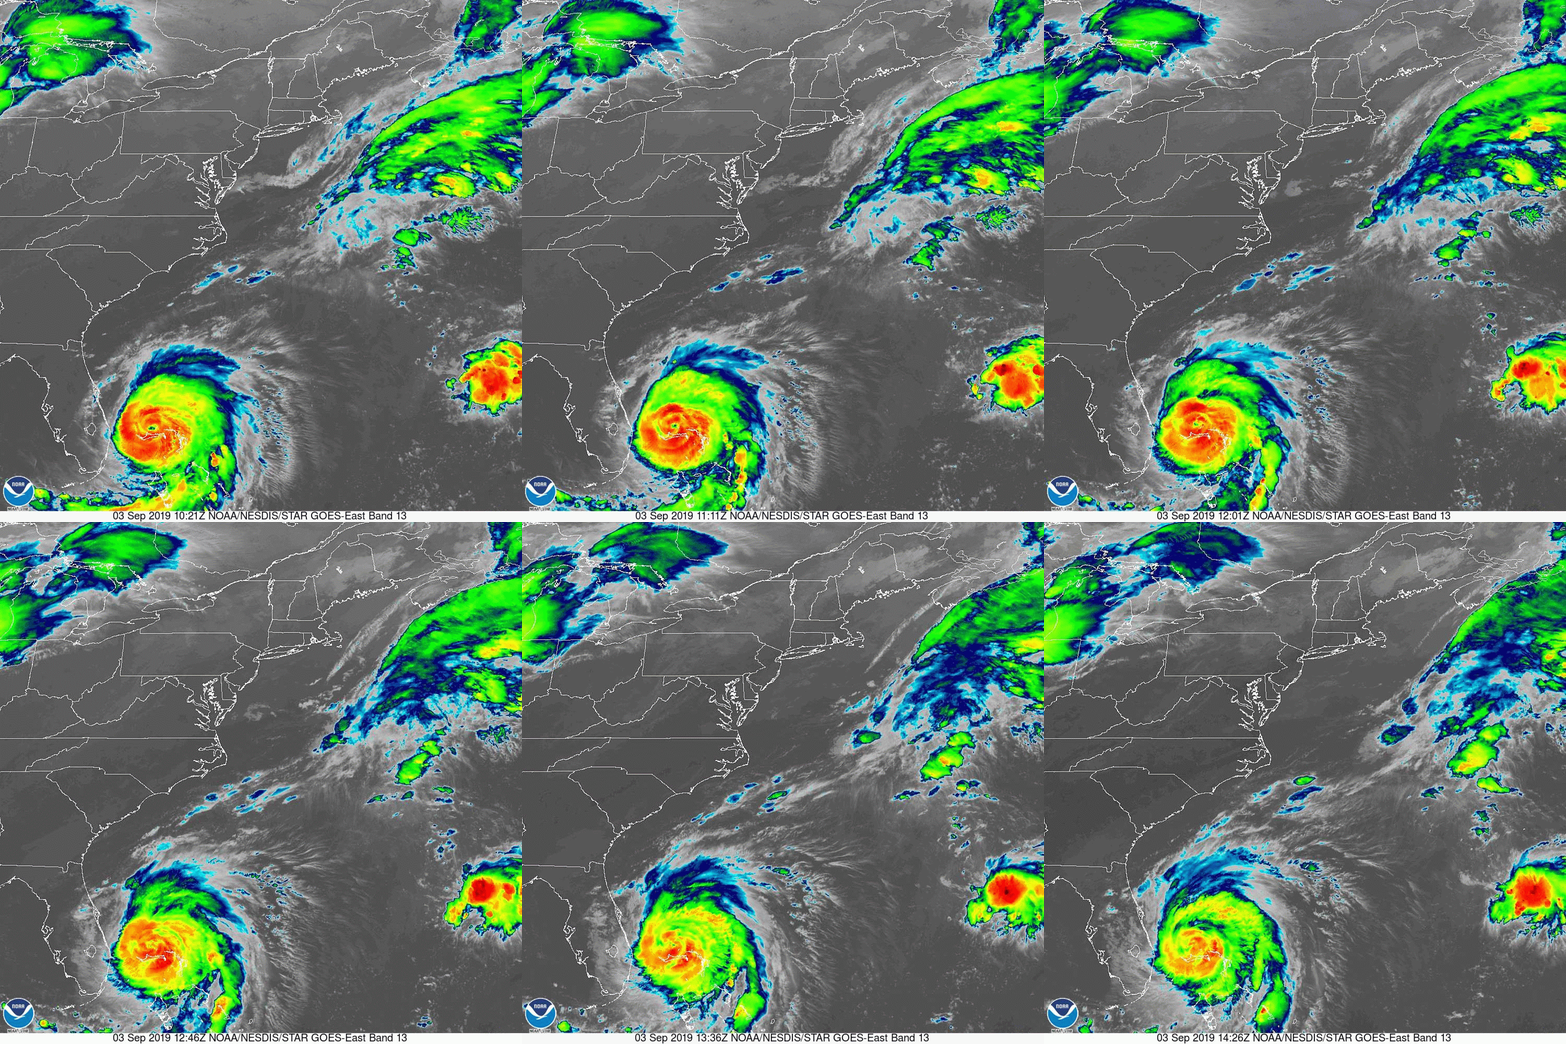
The National Hurricane Center (NHC) is tracking the progress of Hurricane Dorian. According to the Public Advisory issued by the NHC at 11:00 AM EDT on Tuesday, September 3, 2019, the eye of Hurricane Dorian was located near latitude 27.1 North, longitude 78.6 West. Dorian is moving toward the northwest near 2 mph (4 km/h), and a slightly faster motion toward the northwest or north-northwest is expected later today and tonight. A turn toward the north is forecast by Wednesday evening, followed by a turn toward the north-northeast Thursday morning. On this track, the core of extremely dangerous Hurricane Dorian will gradually move north of Grand Bahama Island through this evening. The hurricane will then move dangerously close to the Florida east coast late today through Wednesday evening, very near the Georgia and South Carolina coasts Wednesday night and Thursday, and near or over the North Carolina coast late Thursday and Thursday night. BLS maps and tables are available for areas in all of the states that may be affected by this event. For more information on hurricanes, see the National Hurricane Center.

The Quarterly Census of Employment and Wages (QCEW) program has created a set of maps and data for hurricane flood zones on the Gulf and Atlantic Coasts. Where permitted by State regulations, maps include dots indicating the location of business and government establishments. This product is the combination of geocoded BLS establishment data and flood zones created by the U.S. Corps of Engineers and State emergency management authorities. For more information, see the flood zone Questions and Answers page.
The summarized data are presented for each zone. If a Category I storm is experienced, the subject establishments are represented by the zone 1 sums. The zone 2 sums represent the establishments which are not affected by Category I storms, but are affected by Category II storms. To get a total for establishments subject to a Category II storm, users should add the zone 1 and zone 2 values. The zone 3 sums represent the establishments which are not affected by Category I or II storms, but are affected by Category III storms. To get a total for establishments subject to a Category III storm, users should add the zone 1, 2, and 3 values. The zone 4 sums represent the establishments which are not affected by Category I, II, or III storms, but are affected by Category IV storms. To get a total for establishments subject to a Category IV storm, users should add the zone 1, 2, 3, and 4 values.
Last Modified Date: September 3, 2019