
An official website of the United States government
 United States Department of Labor
An official website of the United States government
United States Department of Labor

The .gov means it's official.
Federal government websites often end in .gov or .mil. Before sharing sensitive information,
make sure you're on a federal government site.

The site is secure.
The
https:// ensures that you are connecting to the official website and that any
information you provide is encrypted and transmitted securely.


Beginning with the publication of the June 2026 Employment Cost Index (ECI), relative importance estimates are now available in the ECI database.
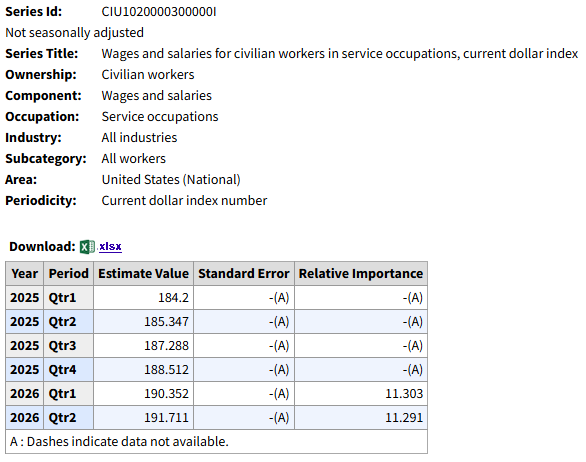
A relative importance estimate represents the wage bill of a published ECI series as a percentage of the higher-level aggregate series above. A wage bill measures the average wage or benefit cost that employers incur multiplied by the number of employees represented. For more information on wage bills, see the Calculation section of the Handbook of Methods. For example, in March 2026 service occupations held a relative importance value of 11.303 percent; or put another way, service occupations represented 11.303 percent of total wage costs among civilian workers.
A relative importance measure can change through two variables: employment and wage/benefit costs. While wage and benefit costs change quarter to quarter, the ECI is a fixed-weight index that holds occupation and industry composition fixed. As such, ECI relative importance values often remain largely stable over time with shifts in employment only coming during a reweight. For more information on the history of reweighting in the ECI, see Reweighting and Recoding in the ECI.
An increase in relative importance suggests the wage bill for the lower-level series has increased faster than the aggregate series. A decrease in relative importance suggests the wage bill for the lower-level series has increased less than the aggregate.
Relative importance estimates can be used to derive the contribution of a specific series to the higher-level aggregate estimate.
Evaluate the contribution of the goods-producing and service-providing industries to the overall movement in private industry wages and salaries in June 2026.
Step 1: Gather the relative importance and percent changes for the relevant series.
| Series | March 2026 Relative Importance | June 2026 3-month percent change (NSA) |
| All private industry workers | 100.000 | 0.9 |
| Goods-producing industries | 16.987 | 1.3 |
| Service-providing industries | 83.013 | 0.8 |
Step 2: Calculate the contribution to the overall 3-month percent change.
Contribution = relative importance * 3-month percent change
Goods-producing contribution = 0.16987 * 0.013
Goods-producing contribution = 0.0022 or 0.22 %
Service-providing contribution = 0.83013 * 0.008
Service-providing contribution = 0.0066 or 0.66 %
Of the 0.9 percent change for private industry workers in June 2026, 0.22 percent (~0.2 percent) was contributed by goods-producing industries and 0.66 percent (~0.7 percent) was contributed by service-providing industries.
Relative importance estimates are available for select ECI series. Occupation and industry relative importance estimates aggregate up to their respective all workers series by ownership: civilian, private industry, and state and local government. Due to publication criteria, not all industries or occupations are published for each ownership, which may result in summations less than 100. See Table A, Table B, and Table C for an example of the relative importance of wages and benefits by ownership.
| ECI Series | Wages[1] | Benefits |
|---|---|---|
| All workers | 100.000 | 100.000 |
| Management, professional, and related occupations | 53.054 | - |
| Management, business, and financial occupations | 21.860 | - |
| Professional and related occupations | 31.194 | - |
| Sales and office occupations | 16.940 | - |
| Sales and related occupations | 7.709 | - |
| Office and administrative support occupations | 9.231 | - |
| Service occupations | 11.303 | - |
| Natural resources, construction, and maintenance occupations | 7.751 | - |
| Construction, extraction, farming, fishing, and forestry occupations | 4.069 | - |
| Installation, maintenance, and repair occupations | 3.683 | - |
| Production, transportation, and material moving occupations | 10.952 | - |
| Production occupations | 4.409 | - |
| Transportation and material moving occupations | 6.543 | - |
| Goods-producing industries | 14.359 | - |
| Manufacturing industry | 8.496 | - |
| Service-providing industries | 85.641 | - |
| Education and health services industry | 27.565 | - |
| Educational services industry | 11.929 | - |
| Elementary and secondary schools | 7.398 | - |
| Junior colleges, colleges, and universities | 3.942 | - |
| Health care and social assistance industry | 15.636 | - |
| Hospitals | 5.758 | - |
| Nursing and residential care facilities | 1.685 | - |
| Public administration industry | 4.615 | - |
| [1] Relative importance estimates may not sum to 100 due to rounding. Source: U.S. Bureau of Labor Statistics, Employment Cost Index (ECI). | ||
| ECI Series | Wages[1] | Benefits[1] |
|---|---|---|
| All workers | 100.000 | 100.000 |
| Management, professional, and related occupations | 49.497 | 52.448 |
| Management, business, and financial occupations | 23.562 | - |
| Professional and related occupations | 25.935 | - |
| Sales and office occupations | 18.659 | 16.721 |
| Sales and related occupations | 9.156 | - |
| Office and administrative support occupations | 9.502 | - |
| Service occupations | 10.788 | 7.430 |
| Natural resources, construction, and maintenance occupations | 8.472 | 9.127 |
| Construction, extraction, farming, fishing, and forestry occupations | 4.457 | - |
| Installation, maintenance, and repair occupations | 4.015 | - |
| Production, transportation, and material moving occupations | 12.584 | 14.275 |
| Production occupations | 5.128 | - |
| Transportation and material moving occupations | 7.456 | - |
| Goods-producing industries | 16.987 | 19.085 |
| Management, professional, and related occupations | 5.243 | - |
| Sales and office occupations | 1.798 | - |
| Natural resources, construction, and maintenance occupations | 4.995 | - |
| Production, transportation, and material moving occupations | 4.839 | - |
| Construction industry | 6.391 | - |
| Manufacturing industry | 10.142 | 12.134 |
| Management, professional, and related occupations | 3.725 | - |
| Sales and office occupations | 1.104 | - |
| Natural resources, construction, and maintenance occupations | 0.730 | - |
| Production, transportation, and material moving occupations | 4.496 | - |
| Service-providing industries | 83.013 | 80.915 |
| Management, professional, and related occupations | 44.254 | - |
| Sales and office occupations | 16.861 | - |
| Service occupations | 10.676 | - |
| Natural resources, construction, and maintenance occupations | 3.477 | - |
| Production, transportation, and material moving occupations | 7.745 | - |
| Trade, transportation, and utilities industries | 19.483 | - |
| Wholesale trade industry | 5.437 | - |
| Retail trade industry | 8.443 | - |
| Transportation and warehousing industry | 4.872 | - |
| Utilities industry | 0.732 | - |
| Information industry | 3.693 | - |
| Financial activities industries | 9.117 | - |
| Finance and insurance industry | 7.522 | - |
| Credit intermediation and related activities industries | 2.968 | - |
| Insurance carriers and related activities industries | 2.590 | - |
| Real estate and rental and leasing industries | 1.595 | - |
| Professional and business services industries | 22.024 | - |
| Professional, scientific, and technical services industries | 13.097 | - |
| Administrative and support and waste management and remediation services industries | 6.029 | - |
| Education and health services industry | 20.287 | - |
| Educational services industry | 3.099 | - |
| Junior colleges, colleges, universities, and professional schools | 1.664 | - |
| Health care and social assistance industry | 17.188 | - |
| Hospitals | 5.771 | - |
| Nursing and residential care facilities | 1.886 | - |
| Nursing care facilities | 0.931 | - |
| Leisure and hospitality industries | 5.592 | - |
| Accommodation and food service industries | 4.605 | - |
| Other services, except public administration, industries | 2.816 | - |
| [1] Relative importance estimates may not sum to 100 due to rounding. Source: U.S. Bureau of Labor Statistics, Employment Cost Index (ECI). | ||
| ECI Series | Wages[1] | Benefits |
|---|---|---|
| All workers | 100.000 | 100.000 |
| Management, professional, and related occupations | 71.411 | - |
| Professional and related occupations | 58.338 | - |
| Sales and office occupations | 8.072 | - |
| Office and administrative support occupations | 7.831 | - |
| Service occupations | 13.960 | - |
| Education and health services industry | 65.127 | - |
| Educational services industry | 57.505 | - |
| Schools industry | 57.152 | - |
| Elementary and secondary schools industry | 41.449 | - |
| Health care and social assistance industry | 7.623 | - |
| Hospitals industry | 5.693 | - |
| Public administration industry | 28.437 | - |
| [1] Relative importance estimates may not sum to 100 due to rounding. Source: U.S. Bureau of Labor Statistics, Employment Cost Index (ECI). | ||
Relative importance estimates are not available for seasonally adjusted estimates.Relative importance estimates are also not available for series by bargaining status (union/nonunion), geographic area (Census region/Census division/metropolitan area), or series excluding incentive-based pay. Fixed employment data are not available for these series and, therefore, the employment weights are reallocated within these series for each reference period based on the current ECI sample. For more information on the calculation methods used in the ECI, see the Handbook of Methods.
Relative importance estimates can be found in the ECI database attached to current dollar index series; see below for an example. Updated relative importance estimates will be available in the database with each ECI release. Future ECI release dates are available on the BLS release calendar.
ECI relative importance estimates were first introduced in Relative importance: putting the Employment Cost Index (ECI) into perspective.
For more information on the concepts and calculation methods of the ECI, see the Handbook of Methods.
Last modified: August 12, 2026