
An official website of the United States government
An official website of the United States government
The .gov means it's official.
Federal government websites often end in .gov or .mil. Before sharing sensitive information,
make sure you're on a federal government site.
The site is secure.
The
https:// ensures that you are connecting to the official website and that any
information you provide is encrypted and transmitted securely.
The Employment Cost Index (ECI) is a product of the National Compensation Survey (NCS) that is a measure of the change in the employer costs of labor, independent of employment shifts among occupations and industry categories. The total compensation series includes changes in wages and salaries and in employer costs for employee benefits. The ECI calculates indexes of total compensation, wages and salaries, and benefits separately for civilian workers in the United States (as defined by the NCS), for private industry workers, and for workers in state and local government. For all of these categories, the ECI calculates the same measures by occupational group, industry group, and worker and establishment characteristics. Seasonally adjusted series are calculated as well. The calculation details for the ECI are covered in this section.
Participation in the NCS is voluntary; therefore, a company official may refuse to participate in the initial survey or may be unwilling or unable to update previously provided data for one or more occupations during subsequent contact. In addition, some establishments selected from the sample frame may be out of scope for the survey or have gone out of business. To address the problems of nonresponse and missing data, the NCS adjusts the weights of the remaining establishments and imputes missing values (fills in missing values with plausible values). To ensure that published estimates ultimately are representative of compensation in the civilian, private industry, and state and local government sectors, weight adjustments and imputation are made in accordance with the following steps:
Step 1. Unit nonresponse adjustment. An establishment is considered responding if it provided information on at least one usable occupation. A selected occupation is classified as usable if the following data are present: occupational attributes (full-time or part-time schedule, union or nonunion status, and time- or incentive-based pay), work schedule, and wage data. Wages account for approximately 70 percent of compensation; therefore, if wage data are not available, other data from the establishment cannot be used in calculating estimates. Without the wage data, it is not possible to create benefit-cost estimates because many benefits, such as paid leave, for example, are linked to wages.
An establishment is considered nonresponding if it refused to participate in the survey or did not provide wages and salaries, occupational classification, worker attributes, and work schedule data for any selected occupation. Establishment nonresponse during the initial interview (referred to as initiation) is addressed by introducing nonresponse adjustments that redistribute the weights of nonrespondents to responding sample units in the same ownership, industry, size class, and area. For example, if the nonresponding establishment was in the manufacturing industry and had an employment of 350 workers, the NCS would adjust the weights of responding manufacturing establishments with 100–499 workers by a nonresponse factor calculated by dividing the sum of the product of establishment employment and sample weight for responding and nonresponding establishments by the sum of the product of establishment employment and sample weight for responding establishments.
Step 2. Quote nonresponse adjustment. Quote nonresponse is a situation in which an establishment refuses to provide any wage data for a given sampled occupation (quote). Quote nonresponse during the initial interview is addressed by an adjustment that redistributes the weights of nonresponding quotes to responding sample quotes in the same occupational group, ownership, industry, size class, and area. Quote nonresponse during an update interview is addressed by imputation.
Step 3. Item imputation. Item nonresponse is a situation in which an establishment responds to the survey but is unable or unwilling to provide some or all of the benefits data, for a given sampled occupation. Item nonresponse is addressed through item imputation in certain situations. Item imputation replaces missing values for an item with values derived from similar occupations and establishments with similar characteristics.
For benefit estimates, items can be imputed for nonresponse at initial and subsequent data collection. For example, during the initial contact, an establishment reports wage and salary data for a sampled occupation but refuses or is unable to report whether those in the occupation receive paid vacation benefits; the NCS imputes the incidence of vacation benefits for the selected occupation on the basis of the incidence of vacation benefits among similar occupations in similar establishments.
For wages and salaries, cost data are not imputed for item nonresponse during the establishment’s initial data collection but are imputed at subsequent data collections (update). For example, if a manufacturing establishment reported wages and salaries for its full-time nonunion assembly workers during the initial collection, but not in a subsequent collection period (update), the NCS calculates the rate of change in wages and salaries of full-time nonunion workers in similar manufacturing establishments between the two collection periods, where the rate of change in wages and salaries between two collection periods is estimated from a regression model fit to establishments who reported wage data in both periods. This rate is then multiplied by the establishment reported wages and salaries, at initiation, to impute missing wages and salaries. However, if the establishment did not provide wages and salaries for full-time nonunion assembly workers at the initial collection, the NCS would perform a quote nonresponse adjustment.
Additional adjustment factors are applied to special situations that may have occurred during data collection. For example, when a sample unit is one of two establishments owned by a given company and the respondent provides data for both locations combined instead of data for the sampled unit, the weight of the sampled unit is adjusted to reflect the employment data for the sampled unit.
Step 4. Benchmarking (poststratification). Benchmarking is the process of adjusting the weight of each quote in the survey to match the base quarter distribution of employment by industry and occupational group. The benchmark cells are the basic cells  used in the index calculation (described below). Each weight in cell is benchmarked to
  , the number of workers represented by the cell in the base quarter.
The ECI is a modified Laspeyres index (an index reflecting the change in labor costs over time) for which the basic computational framework is the standard formula for an index number with fixed index weights, modified by special statistical conditions and accounting for sampling methodology.
An index number for the ECI is a weighted average of the cumulative average wage changes within each of the ECI basic cells, with “wage bills” serving as the fixed weights. For benefit costs, the index number is a weighted average of the cumulative average benefit costs within each of the ECI basic cells, with “benefit bills” serving as the fixed weights. A basic cell for the ECI is composed of wage (or benefit) data from a narrowly defined set of workers, sorted by ownership sector, industry, and occupational groups in which they are employed. The ECI cell structure sorts the industry codes into one of three ownership sectors: private, state government, or local government. Workers within private establishments are sorted into 1 of 59 industry categories that are defined primarily by three-digit industry codes using the North American Industry Classification System (NAICS). Workers in either state or local government are classified into 13 industry categories; the government industry categories are as broad as “all goods-producing industries” and as narrow as “hospitals.” Each of these private and government industry groups is arrayed across nine aggregate occupational groups, which are ordered numerically by their Standard Occupational Classification System (SOC) codes. Altogether, there are 531 (59 × 9) private industry occupational cells and 234 (13 × 9 × 2) state and local government industry occupational cells, totaling 765 ECI basic cells.
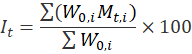
The unweighted average wage (or benefit cost) is calculated from all workers within a sampled quote (selected job). The wage (or benefit) bill, , is the product of the weighted average wage (or benefit cost) of sampled quotes (selected jobs),
 , within the cellat the period
 , in which the wage (or benefit) bill is calculated; and the number of workers represented by the cell,.

For the ECI, the number of workers represented by the cell is held fixed. For each basic cell, wage and benefit bills ()are computed, and the bills are updated each quarter by observed rates of change from the ECI survey sample.
The simplified formula for a basic cell is:
where
 is the index at period
 ,
,
 is the estimated wage (or benefit) bill for the
  th cell at the base period
 , and
, and
 is the multiplicatively accumulated weighted average wage (or benefit cost) change in theth cell from time 0 (the base period the wage or benefit bill is calculated) to time(the current quarter).projects the weighted average wage (or benefit cost) level for the cell forward to the current quarter.
Note thatcan be written as , where
 ,
,
and
 is the ratio of the current-quarter weighted average wage (or average benefit cost) in the cell to the previous-quarter weighted average wage (or average benefit cost) in the cell, both calculated in the current quarter from matched-sampled quotes. Using only matched quotes in the ratio eliminates the inclusion of wage (or benefit cost) changes that might be caused by workers reassigned between jobs within establishments or changes of jobs sampled in the survey. That is, the ECI sample tracks changes in wages (or benefit cost) within establishment jobs, not by individual workers of the establishment. The sample quote weights are applied to compute the cell-weighted averages.
All wage and benefit indexes are computed from the following data:
Computation of the index for a calendar quarter involves five principal steps:
. This ratio()is used as an estimate of the current-quarter()wage (or benefit cost) change for that basic cell and is multiplied by the previous-quarter ( )cumulative average wage (or benefit cost) change for the cell (
 ). The productis a measure of the cumulative percent wage (or benefit cost) change in the cell's wage bill ()since the period it was calculated.
 ) in the calculated period to generate an estimate of the current-quarter wage (or benefit) bill for the cell.
 ) is divided by the summed base-period wage bill (
 ).), which is then divided by the previous-quarter index (
 )to provide a measure of quarter-to-quarter change, referred to as an “index link relative.”
Computations for the occupational and industry group indexes follow the same procedures as those for the overall indexes, except for summation. For example, for an index of a broad occupational group, the wage (or benefit) bills are summed across all cells, which are a subset of that occupational group, with indexes for industry groups calculated analogously.
Fixed employment weights are used to calculate aggregate indexes for civilian, private, and state and local government. These fixed weights are also used to derive all of the industry and occupation series indexes. See the “Reweighting and Recoding in the ECI” webpage for more information.
Computation procedures for measures of change in the regional, union and nonunion, and excluding-incentive workers indexes differ from those of the national wage and benefit indexes because the sample is not large enough to hold the wage and benefit bills constant at the level of detail of the indexes for larger samples. For these indexes, the prevailing distribution in the sample in the previous quarter (for example, between union and nonunion attributes within each ownership–industry–occupation cell of the previous quarter) is used to apportion the previous-period wage (or benefit) bill in that cell (for example, between the union and nonunion indexes) each period. The portion of the wage (or benefit) bill assigned to the union index is then adjusted by the percent change in the union wages (or benefit costs) in the cell, and similarly for the nonunion index. Therefore, the relative employment of the union index in each cell is not held constant over time and will likely change each period as the sample changes and as the employment distribution across these attributes changes. Because the weights of the census region, union/nonunion status, and time- or incentive-paid workers indexes are allowed to vary over time, these indexes are not strictly comparable to the aggregate, industry, occupation, and Metropolitan Statistical Area/Combined Statistical Area indexes.
In some cases, a cell may have too few quotes to produce reliable estimates of mean costs, link relatives, and apportionment factors for the cell. To compensate, the original cell estimate is replaced with a corresponding estimate from a larger, collapsed cell (that contains the original cell).
Over the course of a year, rates of change in the cost of wages and benefits, as measured in the ECI, reflect events that follow a more or less predictable pattern. These events include expansions and contractions of economic activity that occur in specific periods of the year, such as increased work in the construction industry during warm weather or changes in education stemming from new contracts associated with the beginning of the new school year. Such regular patterns in an economic time series typically are referred to as seasonal effects. The process of estimating and removing these effects from an economic series is called seasonal adjustment. Seasonal adjustment makes it easier to observe changes in labor cost trends across economic sectors by excluding cyclical (seasonal) effects.
While evaluating changes in a seasonally adjusted series, it is important to note that seasonal adjustment is an approximation based on past experience. Seasonally adjusted data have a similar margin of error as the original data on which they are based; therefore, the standard errors of the original (not seasonally adjusted) series can be used to assess the approximate precision of the corresponding seasonally adjusted estimates.
Seasonal adjustment is performed with the X-13ARIMA-SEATS program developed by staff of the Statistical Research Division of the U.S. Census Bureau. The X-13ARIMA-SEATS program includes enhancements to both the X-11 variant of the Census Method II seasonal adjustment program and the X-11 ARIMA (Autoregressive Integrated Moving Average) program developed by Statistics Canada. For explanatory information on ARIMA, see “The X-13ARIMA-SEATS Seasonal Adjustment Program” and “The X-II-ARIMA Seasonal Adjustment Method.”
ECI series are seasonally adjusted by either a direct or an indirect method. In the direct method, an original (or unadjusted) index is divided by its seasonal factor estimated from X-13ARIMA-SEATS. In the indirect method, also called composite seasonal adjustment, the seasonally adjusted index is calculated as a weighted sum of seasonally adjusted index components, where the weights are derived from the index weights.
Indexes at comparatively low levels of aggregation, such as the construction wage index, are adjusted by the direct method—dividing the index by its seasonal factor. Higher level aggregate indexes, such as civilian wages and salaries, are generally seasonally adjusted by the indirect method—a weighted sum of seasonally adjusted component indexes—in which the weights sum to 1.0. Industry and occupational series that are seasonally adjusted by the indirect method are based on industry and occupational components, respectively.
At the beginning of each calendar year, seasonal adjustment factors are calculated for use during the coming year and revisions of historical seasonally adjusted data are made for the most recent 5 years. The seasonal factors for the directly adjusted series for the coming year are published with each March publication.
During this process, all published series are reviewed for seasonality. The most recent 10 years of estimates are used to determine seasonality. In some instances, series no longer exhibit seasonality and are dropped from publication. In other instances, series are added to publication when they begin exhibiting identifiable seasonality, along with 5 years of historical data. See the Annual Seasonal Readjustment: Seasonal factors and revised seasonally adjusted estimates webpage for additional information.
Constant dollar (real) estimates are current (nominal) costs that have been adjusted by the change in consumer prices to show the real compensation cost changes.
To make this adjustment, the Consumer Price Index for All Urban Consumers (CPI-U) must be converted to the same index base period as the ECI. The ECI is currently based on December 2005. The converted (rebased) CPI-U is calculated by dividing each period's CPI-U index number by the December 2005 CPI-U index number. The converted CPI-U indexes for each period are then divided into the respective period's current ECI index to derive the constant dollar ECI index. All national ECI series are adjusted by the CPI-U for all items. Regional ECI series are adjusted by dividing the corresponding not seasonally adjusted current dollar index by the rebased CPI-U.
For example, the March 2022 not seasonally adjusted constant dollar wages and salaries index for civilian workers was 102.4 and the current dollar index was 149.6. To begin computing the index value, calculate the rebased CPI-U for all items by dividing the March 2022 CPI-U of 287.504 by the December 2005 CPI-U of 196.8.

Then, divide the March 2022 not seasonally adjusted current dollar wages and salaries index for civilian workers (149.6) by the rebased CPI-U for all items (1.461). The resulting March 2022 constant dollar value is 102.4.

Two types of errors are possible in an estimate based on a sample survey: sampling errors and nonsampling errors. Sampling errors occur because the sample makes up only a part of the population it represents. The sample used for the survey is one of a number of possible samples that could have been selected under the sample design, each producing its own estimate. A measure of the variation among sample estimates is the standard error. Nonsampling errors are data errors that stem from any source other than sampling error, such as data collection errors and data processing errors.
Standard errors can be used to measure the precision with which an estimate from a particular sample approximates the expected result of all possible samples. The chances are about 68 out of 100 that an estimate from the survey differs from a complete population figure by less than the standard error. The chances are about 90 out of 100 that this difference is less than 1.6 times the standard error. Statements of comparison appearing in ECI publications are significant at a level of 1.6 standard error or better. This means that, for differences cited, the estimated difference is less than 1.6 times the standard error of the difference. To assist users in evaluating the reliability of indexes, standard errors for ECI estimates, excluding seasonally adjusted series, are available.
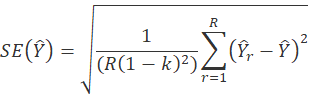
The ECI uses a variation of balanced repeated replication (BRR), a methodology employed to estimate the standard error. The procedure for BRR entails first partitioning the sample into 120 variance strata composed of a single sampling stratum or clusters of sampling strata, and then splitting the sample units in each variance stratum evenly into two variance primary sampling units (PSUs). Next, half-samples are chosen, so that each contains exactly one variance PSU from each variance stratum. Choices are not random, but are designed to yield a “balanced” collection of half-samples. For each half-sample, a “replicate” estimate is computed with the same formula for the regular, or “full-sample,” estimate, except that the final weights are adjusted. A total of 120 replicates are used in this process. If a unit is in the half-sample, its weight is multiplied by (2 – k); if not, its weight is multiplied by k. For all NCS publications, k = 0.5, so the multipliers are 1.5 and 0.5.
The BRR estimate of the standard error with R half-sample replicates is
where
the summation is over all half-sample replicates r = 1,...,R,
 is the rth half-sample replicate estimate,
and
 is the full-sample estimate.
Data collection and processing errors are mitigated primarily through quality assurance programs that include the use of data collection reinterviews, observed interviews, computer edits of the data, and a systematic professional review of the data. The programs also serve as a training device to provide feedback to field economists on errors and the sources of errors that can be remedied by improved collection instructions or computer processing edits. Extensive training of field economists is conducted to maintain high standards in data collection.
Before estimates are declared fit for BLS publications, estimates are validated. This process compares estimates with expected values derived from historical trends, economic conditions and indicators, changes in legislation (such as minimum wage or leave requirements), labor-management disputes, sample composition, sample rotation, changes in compensation structure, etc. Validation evaluates estimates based on individual establishment and worker domains.