
An official website of the United States government
An official website of the United States government
The .gov means it's official.
Federal government websites often end in .gov or .mil. Before sharing sensitive information,
make sure you're on a federal government site.
The site is secure.
The
https:// ensures that you are connecting to the official website and that any
information you provide is encrypted and transmitted securely.
Purchase goods or services for further processing, resale, or to enable operation of an establishment. May analyze past buying trends, sales records, price, and quality of goods or services. May select, order, and authorize payment according to contractual agreements. May conduct meetings with sales personnel and introduce new products. Includes wholesale and retail buyers and purchasing agents for farm products, equipment, and raw materials.
Employment estimate and mean wage estimates for this occupation:
| Employment (1) | Employment RSE (3) |
Mean hourly wage |
Mean annual wage (2) |
Wage RSE (3) |
|---|---|---|---|---|
| 413,540 | 0.6 % | $32.19 | $66,960 | 0.3 % |
Percentile wage estimates for this occupation:
| Percentile | 10% | 25% | 50% (Median) |
75% | 90% |
|---|---|---|---|---|---|
| Hourly Wage | $17.49 | $22.63 | $29.87 | $39.34 | $49.75 |
| Annual Wage (2) | $36,370 | $47,070 | $62,120 | $81,830 | $103,480 |
Industries with the highest published employment and wages for this occupation are provided. For a list of all industries with employment in this occupation, see the Create Customized Tables function.
Industries with the highest levels of employment in this occupation:
| Industry | Employment (1) | Percent of industry employment | Hourly mean wage | Annual mean wage (2) |
|---|---|---|---|---|
| Management of Companies and Enterprises | 39,630 | 1.70 | $35.61 | $74,060 |
| Federal Executive Branch (OES Designation) | 35,220 | 1.74 | $40.40 | $84,020 |
| Merchant Wholesalers, Durable Goods (4232, 4233, 4235, 4236, 4237, and 4239 only) | 18,460 | 1.39 | $29.63 | $61,630 |
| Merchant Wholesalers, Nondurable Goods (4244 and 4248 only) | 12,160 | 1.29 | $30.19 | $62,800 |
| Aerospace Product and Parts Manufacturing | 11,720 | 2.45 | $38.89 | $80,890 |
Industries with the highest concentration of employment in this occupation:
| Industry | Employment (1) | Percent of industry employment | Hourly mean wage | Annual mean wage (2) |
|---|---|---|---|---|
| Aerospace Product and Parts Manufacturing | 11,720 | 2.45 | $38.89 | $80,890 |
| Federal Executive Branch (OES Designation) | 35,220 | 1.74 | $40.40 | $84,020 |
| Farm Product Raw Material Merchant Wholesalers | 1,270 | 1.74 | $30.73 | $63,910 |
| Management of Companies and Enterprises | 39,630 | 1.70 | $35.61 | $74,060 |
| Navigational, Measuring, Electromedical, and Control Instruments Manufacturing | 6,730 | 1.68 | $35.60 | $74,050 |
Top paying industries for this occupation:
| Industry | Employment (1) | Percent of industry employment | Hourly mean wage | Annual mean wage (2) |
|---|---|---|---|---|
| Securities, Commodity Contracts, and Other Financial Investments and Related Activities | 730 | 0.08 | $46.00 | $95,670 |
| Pipeline Transportation of Crude Oil | 50 | 0.38 | $41.55 | $86,420 |
| Monetary Authorities-Central Bank | 50 | 0.25 | $41.45 | $86,220 |
| Natural Gas Distribution | 470 | 0.42 | $41.30 | $85,900 |
| Scientific Research and Development Services | 5,030 | 0.78 | $40.53 | $84,290 |
States and areas with the highest published employment, location quotients, and wages for this occupation are provided. For a list of all areas with employment in this occupation, see the Create Customized Tables function.
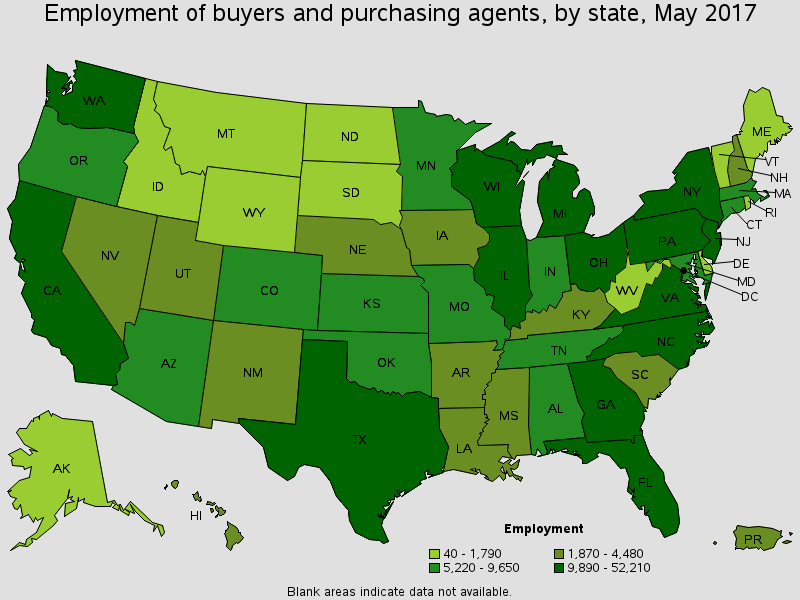
States with the highest employment level in this occupation:
| State | Employment (1) | Employment per thousand jobs | Location quotient (9) | Hourly mean wage | Annual mean wage (2) |
|---|---|---|---|---|---|
| California | 52,210 | 3.13 | 1.08 | $33.63 | $69,950 |
| Texas | 37,900 | 3.19 | 1.10 | $32.21 | $66,990 |
| New York | 22,020 | 2.39 | 0.82 | $34.39 | $71,530 |
| Florida | 19,760 | 2.35 | 0.81 | $29.86 | $62,110 |
| Ohio | 18,180 | 3.38 | 1.17 | $31.91 | $66,380 |
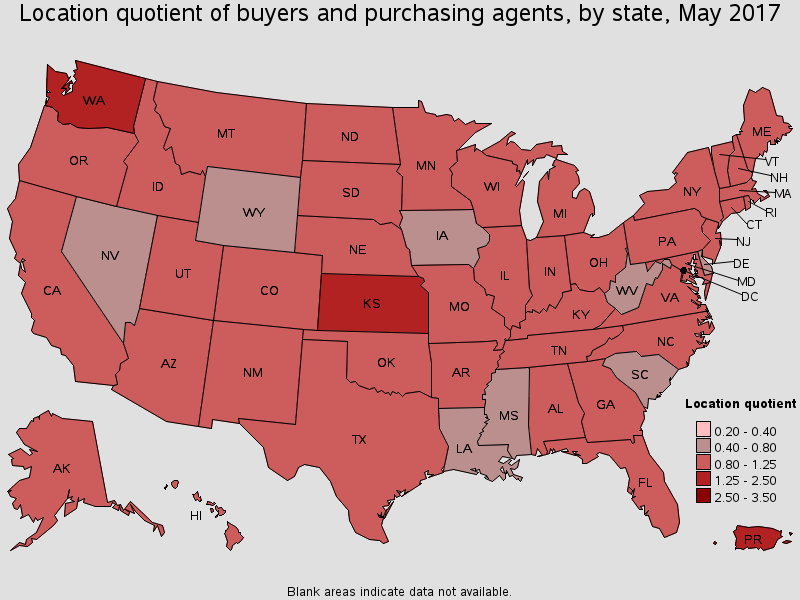
States with the highest concentration of jobs and location quotients in this occupation:
| State | Employment (1) | Employment per thousand jobs | Location quotient (9) | Hourly mean wage | Annual mean wage (2) |
|---|---|---|---|---|---|
| Washington | 15,770 | 4.95 | 1.71 | $34.47 | $71,700 |
| Kansas | 5,290 | 3.86 | 1.33 | $29.33 | $61,000 |
| District of Columbia | 2,710 | 3.83 | 1.32 | $45.49 | $94,620 |
| Virginia | 13,680 | 3.61 | 1.24 | $36.89 | $76,740 |
| Alabama | 6,750 | 3.51 | 1.21 | $32.07 | $66,700 |
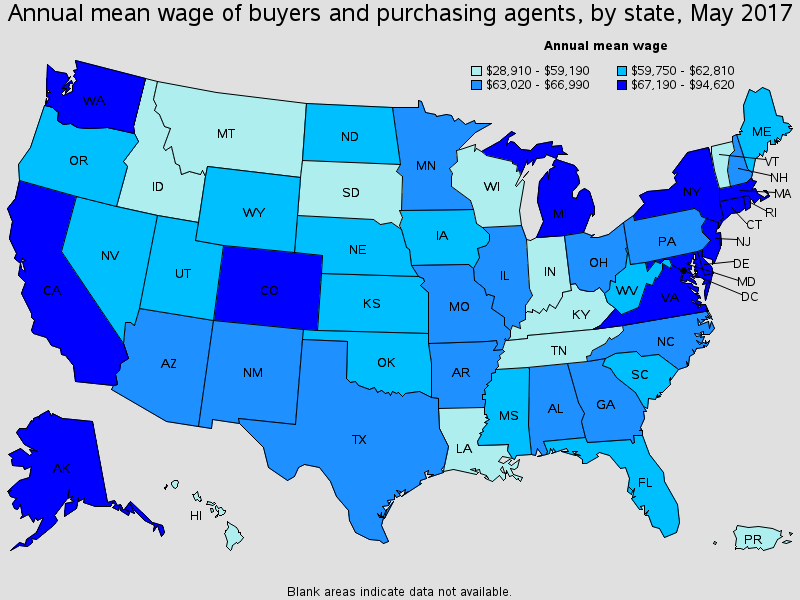
Top paying States for this occupation:
| State | Employment (1) | Employment per thousand jobs | Location quotient (9) | Hourly mean wage | Annual mean wage (2) |
|---|---|---|---|---|---|
| District of Columbia | 2,710 | 3.83 | 1.32 | $45.49 | $94,620 |
| New Jersey | 11,180 | 2.79 | 0.96 | $38.60 | $80,300 |
| Maryland | 8,270 | 3.11 | 1.07 | $37.02 | $77,000 |
| Virginia | 13,680 | 3.61 | 1.24 | $36.89 | $76,740 |
| Massachusetts | 9,240 | 2.62 | 0.90 | $34.65 | $72,060 |
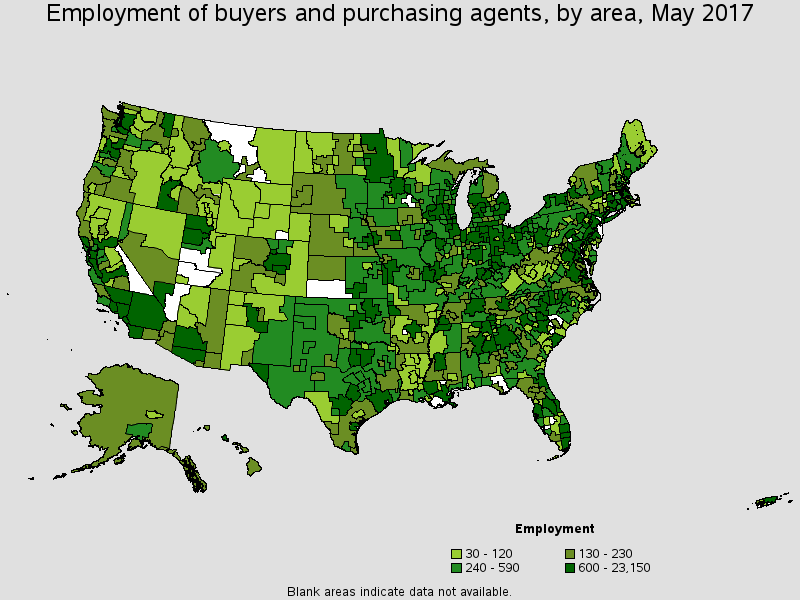
Metropolitan areas with the highest employment level in this occupation:
| Metropolitan area | Employment (1) | Employment per thousand jobs | Location quotient (9) | Hourly mean wage | Annual mean wage (2) |
|---|---|---|---|---|---|
| New York-Jersey City-White Plains, NY-NJ Metropolitan Division | 16,560 | 2.47 | 0.85 | $37.04 | $77,040 |
| Los Angeles-Long Beach-Glendale, CA Metropolitan Division | 15,200 | 3.43 | 1.18 | $33.00 | $68,640 |
| Houston-The Woodlands-Sugar Land, TX | 11,360 | 3.88 | 1.34 | $33.57 | $69,830 |
| Seattle-Bellevue-Everett, WA Metropolitan Division | 11,130 | 6.75 | 2.33 | $36.31 | $75,520 |
| Washington-Arlington-Alexandria, DC-VA-MD-WV Metropolitan Division | 9,520 | 3.78 | 1.30 | $43.00 | $89,440 |
| Dallas-Plano-Irving, TX Metropolitan Division | 8,310 | 3.34 | 1.15 | $34.12 | $70,960 |
| Chicago-Naperville-Arlington Heights, IL Metropolitan Division | 8,040 | 2.20 | 0.76 | $31.46 | $65,440 |
| Minneapolis-St. Paul-Bloomington, MN-WI | 7,450 | 3.85 | 1.33 | $33.25 | $69,150 |
| Atlanta-Sandy Springs-Roswell, GA | 7,370 | 2.81 | 0.97 | $33.74 | $70,190 |
| Anaheim-Santa Ana-Irvine, CA Metropolitan Division | 6,290 | 3.89 | 1.34 | $35.36 | $73,550 |
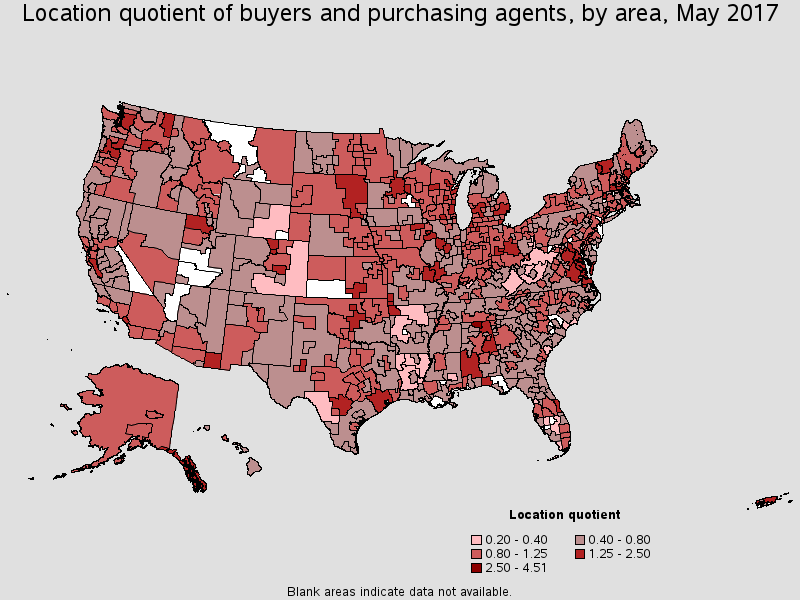
Metropolitan areas with the highest concentration of jobs and location quotients in this occupation:
| Metropolitan area | Employment (1) | Employment per thousand jobs | Location quotient (9) | Hourly mean wage | Annual mean wage (2) |
|---|---|---|---|---|---|
| California-Lexington Park, MD | 600 | 13.10 | 4.51 | $42.13 | $87,630 |
| Huntsville, AL | 2,260 | 10.17 | 3.51 | $38.89 | $80,880 |
| Wausau, WI | 500 | 7.21 | 2.48 | $25.39 | $52,820 |
| Warner Robins, GA | 480 | 6.86 | 2.37 | $36.90 | $76,750 |
| Seattle-Bellevue-Everett, WA Metropolitan Division | 11,130 | 6.75 | 2.33 | $36.31 | $75,520 |
| Fayetteville-Springdale-Rogers, AR-MO | 1,580 | 6.60 | 2.28 | (8) | (8) |
| Dayton, OH | 2,240 | 6.03 | 2.08 | $36.15 | $75,190 |
| Elkhart-Goshen, IN | 750 | 5.87 | 2.02 | $26.81 | $55,750 |
| Wichita, KS | 1,550 | 5.24 | 1.81 | $31.82 | $66,190 |
| Davenport-Moline-Rock Island, IA-IL | 890 | 4.93 | 1.70 | $35.99 | $74,850 |
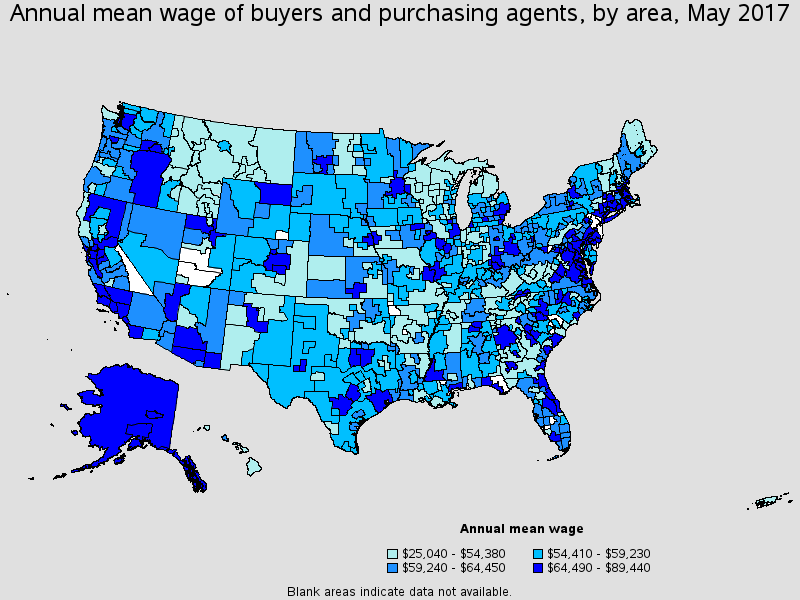
Top paying metropolitan areas for this occupation:
| Metropolitan area | Employment (1) | Employment per thousand jobs | Location quotient (9) | Hourly mean wage | Annual mean wage (2) |
|---|---|---|---|---|---|
| Washington-Arlington-Alexandria, DC-VA-MD-WV Metropolitan Division | 9,520 | 3.78 | 1.30 | $43.00 | $89,440 |
| California-Lexington Park, MD | 600 | 13.10 | 4.51 | $42.13 | $87,630 |
| Silver Spring-Frederick-Rockville, MD Metropolitan Division | 2,170 | 3.71 | 1.28 | $40.06 | $83,320 |
| Niles-Benton Harbor, MI | 280 | 4.42 | 1.52 | $39.68 | $82,540 |
| Huntsville, AL | 2,260 | 10.17 | 3.51 | $38.89 | $80,880 |
| Dutchess County-Putnam County, NY Metropolitan Division | 220 | 1.60 | 0.55 | $38.59 | $80,270 |
| Peoria, IL | 670 | 3.92 | 1.35 | $38.13 | $79,310 |
| San Francisco-Redwood City-South San Francisco, CA Metropolitan Division | 3,590 | 3.22 | 1.11 | $37.74 | $78,490 |
| Camden, NJ Metropolitan Division | 1,550 | 2.94 | 1.01 | $37.41 | $77,820 |
| Kennewick-Richland, WA | 410 | 3.65 | 1.26 | $37.39 | $77,770 |
Nonmetropolitan areas with the highest employment in this occupation:
| Nonmetropolitan area | Employment (1) | Employment per thousand jobs | Location quotient (9) | Hourly mean wage | Annual mean wage (2) |
|---|---|---|---|---|---|
| West Northwestern Ohio nonmetropolitan area | 910 | 3.58 | 1.23 | $30.61 | $63,670 |
| North Northeastern Ohio non-metropolitan area (non-contiguous) | 850 | 2.56 | 0.88 | $26.94 | $56,040 |
| Balance of Lower Peninsula of Michigan nonmetropolitan area | 650 | 2.35 | 0.81 | $27.70 | $57,610 |
| South Central Wisconsin nonmetropolitan area | 640 | 3.09 | 1.07 | $25.66 | $53,370 |
| Northern Indiana nonmetropolitan area | 640 | 2.97 | 1.02 | $23.72 | $49,350 |
Nonmetropolitan areas with the highest concentration of jobs and location quotients in this occupation:
| Nonmetropolitan area | Employment (1) | Employment per thousand jobs | Location quotient (9) | Hourly mean wage | Annual mean wage (2) |
|---|---|---|---|---|---|
| Los Alamos County, New Mexico nonmetropolitan area | 140 | 8.85 | 3.05 | $40.82 | $84,900 |
| Southeast Alaska nonmetropolitan area | 150 | 4.39 | 1.51 | $32.28 | $67,150 |
| Southwest New Hampshire nonmetropolitan area | 160 | 4.23 | 1.46 | $25.99 | $54,050 |
| Northeast Virginia nonmetropolitan area | 210 | 4.21 | 1.45 | $41.42 | $86,160 |
| Northeast Alabama nonmetropolitan area | 610 | 4.19 | 1.45 | $28.30 | $58,860 |
Top paying nonmetropolitan areas for this occupation:
| Nonmetropolitan area | Employment (1) | Employment per thousand jobs | Location quotient (9) | Hourly mean wage | Annual mean wage (2) |
|---|---|---|---|---|---|
| Northeast Virginia nonmetropolitan area | 210 | 4.21 | 1.45 | $41.42 | $86,160 |
| Los Alamos County, New Mexico nonmetropolitan area | 140 | 8.85 | 3.05 | $40.82 | $84,900 |
| Wasatch Back nonmetropolitan area | 60 | 1.78 | 0.61 | $37.03 | $77,010 |
| Connecticut nonmetropolitan area | 50 | 1.46 | 0.50 | $36.50 | $75,920 |
| Southwest Mississippi nonmetropolitan area | 140 | 2.02 | 0.70 | $35.71 | $74,280 |
These estimates are calculated with data collected from employers in all industry sectors, all metropolitan and nonmetropolitan areas, and all states and the District of Columbia. The top employment and wage figures are provided above. The complete list is available in the downloadable XLS files.
The percentile wage estimate is the value of a wage below which a certain percent of workers fall. The median wage is the 50th percentile wage estimate--50 percent of workers earn less than the median and 50 percent of workers earn more than the median. More about percentile wages.
(1) Estimates for detailed occupations do not sum to the totals because the totals include occupations not shown separately. Estimates do not include self-employed workers.
(2) Annual wages have been calculated by multiplying the hourly mean wage by a "year-round, full-time" hours figure of 2,080 hours; for those occupations where there is not an hourly wage published, the annual wage has been directly calculated from the reported survey data.
(3) The relative standard error (RSE) is a measure of the reliability of a survey statistic. The smaller the relative standard error, the more precise the estimate.
(8) Estimate not released.
(9) The location quotient is the ratio of the area concentration of occupational employment to the national average concentration. A location quotient greater than one indicates the occupation has a higher share of employment than average, and a location quotient less than one indicates the occupation is less prevalent in the area than average.
Other OES estimates and related information:
May 2017 National Occupational Employment and Wage Estimates
May 2017 State Occupational Employment and Wage Estimates
May 2017 Metropolitan and Nonmetropolitan Area Occupational Employment and Wage Estimates
May 2017 National Industry-Specific Occupational Employment and Wage Estimates
Last Modified Date: March 30, 2018