
An official website of the United States government
An official website of the United States government
The .gov means it's official.
Federal government websites often end in .gov or .mil. Before sharing sensitive information,
make sure you're on a federal government site.
The site is secure.
The
https:// ensures that you are connecting to the official website and that any
information you provide is encrypted and transmitted securely.
Apply electrical and electronic theory and related knowledge, usually under the direction of engineering staff, to design, build, repair, calibrate, and modify electrical components, circuitry, controls, and machinery for subsequent evaluation and use by engineering staff in making engineering design decisions. Excludes "Broadcast Technicians" (27-4012).
Employment estimate and mean wage estimates for this occupation:
| Employment (1) | Employment RSE (3) |
Mean hourly wage |
Mean annual wage (2) |
Wage RSE (3) |
|---|---|---|---|---|
| 128,320 | 2.1 % | $30.91 | $64,290 | 0.4 % |
Percentile wage estimates for this occupation:
| Percentile | 10% | 25% | 50% (Median) |
75% | 90% |
|---|---|---|---|---|---|
| Hourly Wage | $17.99 | $23.53 | $30.60 | $36.93 | $45.10 |
| Annual Wage (2) | $37,420 | $48,940 | $63,660 | $76,820 | $93,810 |
Industries with the highest published employment and wages for this occupation are provided. For a list of all industries with employment in this occupation, see the Create Customized Tables function.
Industries with the highest levels of employment in this occupation:
| Industry | Employment (1) | Percent of industry employment | Hourly mean wage | Annual mean wage (2) |
|---|---|---|---|---|
| Architectural, Engineering, and Related Services | 19,440 | 1.37 | $30.83 | $64,130 |
| Semiconductor and Other Electronic Component Manufacturing | 16,690 | 4.63 | $29.20 | $60,740 |
| Navigational, Measuring, Electromedical, and Control Instruments Manufacturing | 8,800 | 2.20 | $28.48 | $59,240 |
| Federal Executive Branch (OES Designation) | 7,520 | 0.37 | $40.36 | $83,950 |
| Computer Systems Design and Related Services | 7,150 | 0.35 | $32.20 | $66,970 |
Industries with the highest concentration of employment in this occupation:
| Industry | Employment (1) | Percent of industry employment | Hourly mean wage | Annual mean wage (2) |
|---|---|---|---|---|
| Semiconductor and Other Electronic Component Manufacturing | 16,690 | 4.63 | $29.20 | $60,740 |
| Audio and Video Equipment Manufacturing | 500 | 2.78 | $25.18 | $52,360 |
| Communications Equipment Manufacturing | 2,060 | 2.42 | $29.60 | $61,570 |
| Navigational, Measuring, Electromedical, and Control Instruments Manufacturing | 8,800 | 2.20 | $28.48 | $59,240 |
| Computer and Peripheral Equipment Manufacturing | 3,440 | 2.14 | $30.32 | $63,070 |
Top paying industries for this occupation:
| Industry | Employment (1) | Percent of industry employment | Hourly mean wage | Annual mean wage (2) |
|---|---|---|---|---|
| Newspaper, Periodical, Book, and Directory Publishers | 50 | 0.01 | $41.64 | $86,620 |
| Federal Executive Branch (OES Designation) | 7,520 | 0.37 | $40.36 | $83,950 |
| Natural Gas Distribution | 450 | 0.40 | $39.15 | $81,440 |
| Technical and Trade Schools | 40 | 0.03 | $39.09 | $81,300 |
| Utility System Construction | 130 | 0.03 | $38.09 | $79,230 |
States and areas with the highest published employment, location quotients, and wages for this occupation are provided. For a list of all areas with employment in this occupation, see the Create Customized Tables function.

States with the highest employment level in this occupation:
| State | Employment (1) | Employment per thousand jobs | Location quotient (9) | Hourly mean wage | Annual mean wage (2) |
|---|---|---|---|---|---|
| California | 22,960 | 1.38 | 1.53 | $32.46 | $67,520 |
| Texas | 12,800 | 1.08 | 1.20 | $31.51 | $65,540 |
| Virginia | 6,120 | 1.62 | 1.79 | $33.52 | $69,720 |
| New York | 5,600 | 0.61 | 0.68 | $31.02 | $64,510 |
| Florida | 5,350 | 0.64 | 0.71 | $28.46 | $59,190 |
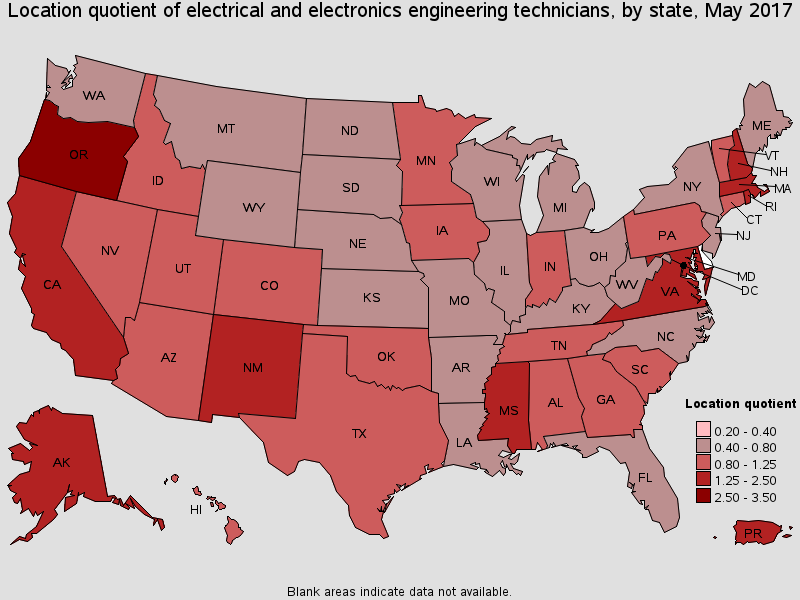
States with the highest concentration of jobs and location quotients in this occupation:
| State | Employment (1) | Employment per thousand jobs | Location quotient (9) | Hourly mean wage | Annual mean wage (2) |
|---|---|---|---|---|---|
| Oregon | 4,250 | 2.32 | 2.58 | (8) | (8) |
| Virginia | 6,120 | 1.62 | 1.79 | $33.52 | $69,720 |
| New Mexico | 1,280 | 1.60 | 1.78 | $30.15 | $62,710 |
| Alaska | 500 | 1.59 | 1.76 | $38.28 | $79,620 |
| Rhode Island | 740 | 1.56 | 1.74 | $28.24 | $58,730 |
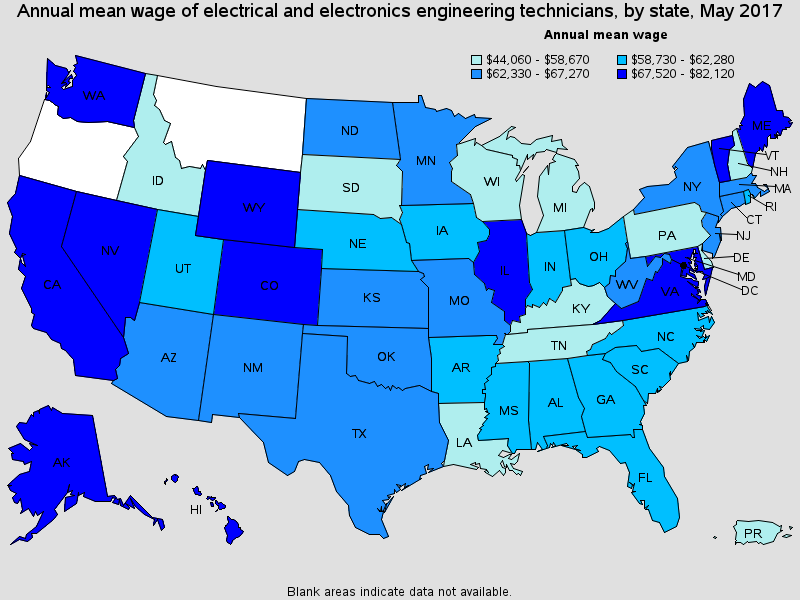
Top paying States for this occupation:
| State | Employment (1) | Employment per thousand jobs | Location quotient (9) | Hourly mean wage | Annual mean wage (2) |
|---|---|---|---|---|---|
| District of Columbia | 400 | 0.56 | 0.62 | $39.48 | $82,120 |
| Vermont | 290 | 0.95 | 1.06 | $39.40 | $81,960 |
| Alaska | 500 | 1.59 | 1.76 | $38.28 | $79,620 |
| Maryland | 4,040 | 1.52 | 1.68 | $35.30 | $73,430 |
| Colorado | 1,930 | 0.76 | 0.84 | $34.75 | $72,290 |
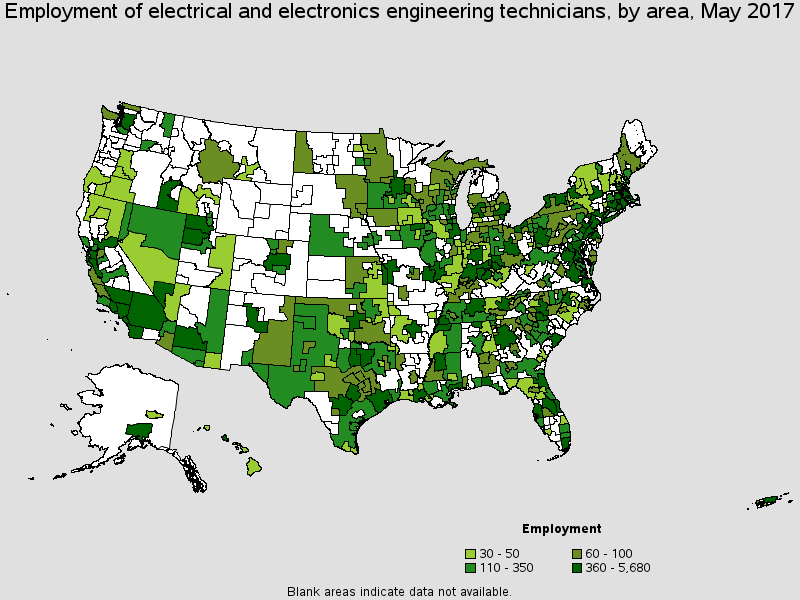
Metropolitan areas with the highest employment level in this occupation:
| Metropolitan area | Employment (1) | Employment per thousand jobs | Location quotient (9) | Hourly mean wage | Annual mean wage (2) |
|---|---|---|---|---|---|
| San Jose-Sunnyvale-Santa Clara, CA | 5,270 | 4.84 | 5.38 | $30.65 | $63,750 |
| Houston-The Woodlands-Sugar Land, TX | 3,780 | 1.29 | 1.43 | $33.10 | $68,850 |
| Los Angeles-Long Beach-Glendale, CA Metropolitan Division | 3,360 | 0.76 | 0.84 | $33.44 | $69,550 |
| Washington-Arlington-Alexandria, DC-VA-MD-WV Metropolitan Division | 3,320 | 1.32 | 1.47 | $35.19 | $73,200 |
| San Diego-Carlsbad, CA | 2,920 | 2.04 | 2.27 | $33.53 | $69,730 |
| Austin-Round Rock, TX | 2,910 | 2.92 | 3.24 | $32.02 | $66,610 |
| New York-Jersey City-White Plains, NY-NJ Metropolitan Division | 2,860 | 0.43 | 0.48 | $34.27 | $71,280 |
| Atlanta-Sandy Springs-Roswell, GA | 2,400 | 0.92 | 1.02 | $27.51 | $57,220 |
| Chicago-Naperville-Arlington Heights, IL Metropolitan Division | 2,340 | 0.64 | 0.71 | $34.23 | $71,200 |
| Anaheim-Santa Ana-Irvine, CA Metropolitan Division | 2,330 | 1.44 | 1.60 | $27.70 | $57,620 |
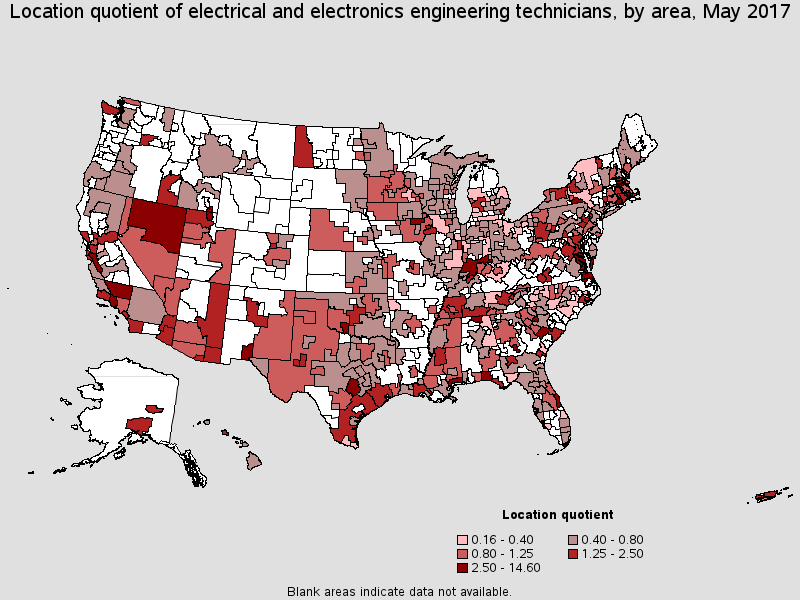
Metropolitan areas with the highest concentration of jobs and location quotients in this occupation:
| Metropolitan area | Employment (1) | Employment per thousand jobs | Location quotient (9) | Hourly mean wage | Annual mean wage (2) |
|---|---|---|---|---|---|
| California-Lexington Park, MD | 600 | 13.14 | 14.60 | $42.87 | $89,180 |
| Huntsville, AL | 1,110 | 5.02 | 5.57 | $30.20 | $62,820 |
| San Jose-Sunnyvale-Santa Clara, CA | 5,270 | 4.84 | 5.38 | $30.65 | $63,750 |
| Las Cruces, NM | 310 | 4.40 | 4.89 | $34.14 | $71,010 |
| Lawton, OK | 180 | 4.22 | 4.69 | $31.93 | $66,400 |
| Nashua, NH-MA NECTA Division | 470 | 3.56 | 3.96 | $27.89 | $58,010 |
| Crestview-Fort Walton Beach-Destin, FL | 360 | 3.33 | 3.69 | $31.30 | $65,110 |
| Palm Bay-Melbourne-Titusville, FL | 660 | 3.21 | 3.56 | $29.09 | $60,510 |
| Warner Robins, GA | 220 | 3.15 | 3.50 | $33.29 | $69,240 |
| Gulfport-Biloxi-Pascagoula, MS | 470 | 3.12 | 3.47 | $30.86 | $64,190 |

Top paying metropolitan areas for this occupation:
| Metropolitan area | Employment (1) | Employment per thousand jobs | Location quotient (9) | Hourly mean wage | Annual mean wage (2) |
|---|---|---|---|---|---|
| Salinas, CA | 100 | 0.55 | 0.62 | $43.80 | $91,100 |
| California-Lexington Park, MD | 600 | 13.14 | 14.60 | $42.87 | $89,180 |
| Burlington-South Burlington, VT | 240 | 1.93 | 2.14 | $41.69 | $86,710 |
| Fresno, CA | 160 | 0.43 | 0.48 | $39.89 | $82,970 |
| Anchorage, AK | 390 | 2.23 | 2.48 | $39.58 | $82,320 |
| Stockton-Lodi, CA | 70 | 0.29 | 0.33 | $39.35 | $81,850 |
| New Bern, NC | 90 | 2.05 | 2.27 | $39.31 | $81,770 |
| Bakersfield, CA | 860 | 2.85 | 3.16 | $39.22 | $81,580 |
| Oxnard-Thousand Oaks-Ventura, CA | 790 | 2.55 | 2.84 | $38.94 | $81,000 |
| Fairbanks, AK | 50 | 1.27 | 1.42 | $38.34 | $79,750 |
Nonmetropolitan areas with the highest employment in this occupation:
| Nonmetropolitan area | Employment (1) | Employment per thousand jobs | Location quotient (9) | Hourly mean wage | Annual mean wage (2) |
|---|---|---|---|---|---|
| Southern Indiana nonmetropolitan area | 700 | 3.74 | 4.15 | $34.56 | $71,890 |
| Northeast Virginia nonmetropolitan area | 300 | 6.13 | 6.80 | $42.83 | $89,090 |
| Coastal Plains Region of Texas nonmetropolitan area | 250 | 1.71 | 1.90 | $29.79 | $61,960 |
| West Texas Region of Texas nonmetropolitan area | 200 | 1.03 | 1.15 | $35.48 | $73,800 |
| Southeast Iowa nonmetropolitan area | 190 | 0.82 | 0.91 | $29.50 | $61,350 |
Nonmetropolitan areas with the highest concentration of jobs and location quotients in this occupation:
| Nonmetropolitan area | Employment (1) | Employment per thousand jobs | Location quotient (9) | Hourly mean wage | Annual mean wage (2) |
|---|---|---|---|---|---|
| Northeast Virginia nonmetropolitan area | 300 | 6.13 | 6.80 | $42.83 | $89,090 |
| Los Alamos County, New Mexico nonmetropolitan area | 70 | 4.05 | 4.50 | $42.08 | $87,520 |
| Southern Indiana nonmetropolitan area | 700 | 3.74 | 4.15 | $34.56 | $71,890 |
| North Nevada nonmetropolitan area | 120 | 2.77 | 3.07 | $30.97 | $64,410 |
| Lower Savannah South Carolina nonmetropolitan area | 140 | 2.58 | 2.87 | $25.97 | $54,010 |
Top paying nonmetropolitan areas for this occupation:
| Nonmetropolitan area | Employment (1) | Employment per thousand jobs | Location quotient (9) | Hourly mean wage | Annual mean wage (2) |
|---|---|---|---|---|---|
| Northeast Virginia nonmetropolitan area | 300 | 6.13 | 6.80 | $42.83 | $89,090 |
| Los Alamos County, New Mexico nonmetropolitan area | 70 | 4.05 | 4.50 | $42.08 | $87,520 |
| South Nevada nonmetropolitan area | 40 | 0.77 | 0.86 | $41.97 | $87,290 |
| Eastern Utah nonmetropolitan area | 40 | 0.88 | 0.97 | $41.18 | $85,650 |
| Southwest Mississippi nonmetropolitan area | 60 | 0.77 | 0.86 | $36.88 | $76,700 |
These estimates are calculated with data collected from employers in all industry sectors, all metropolitan and nonmetropolitan areas, and all states and the District of Columbia. The top employment and wage figures are provided above. The complete list is available in the downloadable XLS files.
The percentile wage estimate is the value of a wage below which a certain percent of workers fall. The median wage is the 50th percentile wage estimate--50 percent of workers earn less than the median and 50 percent of workers earn more than the median. More about percentile wages.
(1) Estimates for detailed occupations do not sum to the totals because the totals include occupations not shown separately. Estimates do not include self-employed workers.
(2) Annual wages have been calculated by multiplying the hourly mean wage by a "year-round, full-time" hours figure of 2,080 hours; for those occupations where there is not an hourly wage published, the annual wage has been directly calculated from the reported survey data.
(3) The relative standard error (RSE) is a measure of the reliability of a survey statistic. The smaller the relative standard error, the more precise the estimate.
(8) Estimate not released.
(9) The location quotient is the ratio of the area concentration of occupational employment to the national average concentration. A location quotient greater than one indicates the occupation has a higher share of employment than average, and a location quotient less than one indicates the occupation is less prevalent in the area than average.
Other OES estimates and related information:
May 2017 National Occupational Employment and Wage Estimates
May 2017 State Occupational Employment and Wage Estimates
May 2017 Metropolitan and Nonmetropolitan Area Occupational Employment and Wage Estimates
May 2017 National Industry-Specific Occupational Employment and Wage Estimates
Last Modified Date: March 30, 2018