
An official website of the United States government
An official website of the United States government
The .gov means it's official.
Federal government websites often end in .gov or .mil. Before sharing sensitive information,
make sure you're on a federal government site.
The site is secure.
The
https:// ensures that you are connecting to the official website and that any
information you provide is encrypted and transmitted securely.
Sell business goods or services, the selling of which requires a technical background equivalent to a baccalaureate degree in engineering. Excludes "Engineers" (17-2011 through 17-2199) whose primary function is not marketing or sales.
Employment estimate and mean wage estimates for this occupation:
| Employment (1) | Employment RSE (3) |
Mean hourly wage |
Mean annual wage (2) |
Wage RSE (3) |
|---|---|---|---|---|
| 70,820 | 2.2 % | $51.42 | $106,950 | 0.8 % |
Percentile wage estimates for this occupation:
| Percentile | 10% | 25% | 50% (Median) |
75% | 90% |
|---|---|---|---|---|---|
| Hourly Wage | $27.37 | $35.38 | $47.46 | $62.47 | $78.24 |
| Annual Wage (2) | $56,940 | $73,600 | $98,720 | $129,940 | $162,740 |
Industries with the highest published employment and wages for this occupation are provided. For a list of all industries with employment in this occupation, see the Create Customized Tables function.
Industries with the highest levels of employment in this occupation:
| Industry | Employment (1) | Percent of industry employment | Hourly mean wage | Annual mean wage (2) |
|---|---|---|---|---|
| Computer Systems Design and Related Services | 12,170 | 0.60 | $54.37 | $113,080 |
| Wholesale Electronic Markets and Agents and Brokers | 7,810 | 0.89 | $55.08 | $114,560 |
| Professional and Commercial Equipment and Supplies Merchant Wholesalers | 5,770 | 0.93 | $52.54 | $109,280 |
| Merchant Wholesalers, Durable Goods (4232, 4233, 4235, 4236, 4237, and 4239 only) | 5,430 | 0.41 | $49.51 | $102,980 |
| Machinery, Equipment, and Supplies Merchant Wholesalers | 4,940 | 0.75 | $45.57 | $94,780 |
Industries with the highest concentration of employment in this occupation:
| Industry | Employment (1) | Percent of industry employment | Hourly mean wage | Annual mean wage (2) |
|---|---|---|---|---|
| Professional and Commercial Equipment and Supplies Merchant Wholesalers | 5,770 | 0.93 | $52.54 | $109,280 |
| Wholesale Electronic Markets and Agents and Brokers | 7,810 | 0.89 | $55.08 | $114,560 |
| Software Publishers | 3,150 | 0.86 | $56.88 | $118,300 |
| Communications Equipment Manufacturing | 690 | 0.82 | $52.49 | $109,170 |
| Machinery, Equipment, and Supplies Merchant Wholesalers | 4,940 | 0.75 | $45.57 | $94,780 |
Top paying industries for this occupation:
| Industry | Employment (1) | Percent of industry employment | Hourly mean wage | Annual mean wage (2) |
|---|---|---|---|---|
| Utility System Construction | 50 | 0.01 | $67.81 | $141,040 |
| Electronics and Appliance Stores | 140 | 0.03 | $64.63 | $134,430 |
| Other Support Services | 100 | 0.03 | $61.07 | $127,020 |
| Business Schools and Computer and Management Training | 80 | 0.11 | $60.06 | $124,920 |
| Management, Scientific, and Technical Consulting Services | 1,470 | 0.11 | $59.29 | $123,310 |
States and areas with the highest published employment, location quotients, and wages for this occupation are provided. For a list of all areas with employment in this occupation, see the Create Customized Tables function.
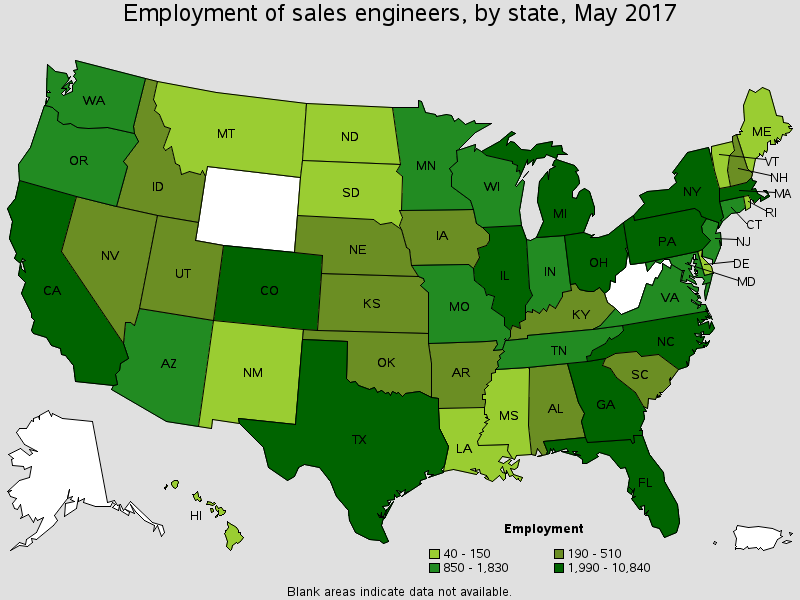
States with the highest employment level in this occupation:
| State | Employment (1) | Employment per thousand jobs | Location quotient (9) | Hourly mean wage | Annual mean wage (2) |
|---|---|---|---|---|---|
| California | 10,840 | 0.65 | 1.31 | $56.61 | $117,750 |
| Texas | 10,690 | 0.90 | 1.81 | $51.81 | $107,770 |
| Massachusetts | 4,350 | 1.23 | 2.48 | $51.92 | $107,990 |
| Pennsylvania | 3,410 | 0.59 | 1.19 | $45.76 | $95,180 |
| Colorado | 3,270 | 1.28 | 2.57 | $60.01 | $124,820 |

States with the highest concentration of jobs and location quotients in this occupation:
| State | Employment (1) | Employment per thousand jobs | Location quotient (9) | Hourly mean wage | Annual mean wage (2) |
|---|---|---|---|---|---|
| Colorado | 3,270 | 1.28 | 2.57 | $60.01 | $124,820 |
| Massachusetts | 4,350 | 1.23 | 2.48 | $51.92 | $107,990 |
| Texas | 10,690 | 0.90 | 1.81 | $51.81 | $107,770 |
| New Hampshire | 510 | 0.79 | 1.58 | $53.02 | $110,280 |
| North Carolina | 2,920 | 0.68 | 1.37 | $43.40 | $90,260 |

Top paying States for this occupation:
| State | Employment (1) | Employment per thousand jobs | Location quotient (9) | Hourly mean wage | Annual mean wage (2) |
|---|---|---|---|---|---|
| Delaware | 50 | 0.12 | 0.24 | $68.48 | $142,450 |
| Maryland | 1,110 | 0.42 | 0.84 | $63.42 | $131,910 |
| Virginia | 1,690 | 0.45 | 0.90 | $61.99 | $128,940 |
| Colorado | 3,270 | 1.28 | 2.57 | $60.01 | $124,820 |
| Washington | 1,360 | 0.43 | 0.86 | $58.50 | $121,670 |
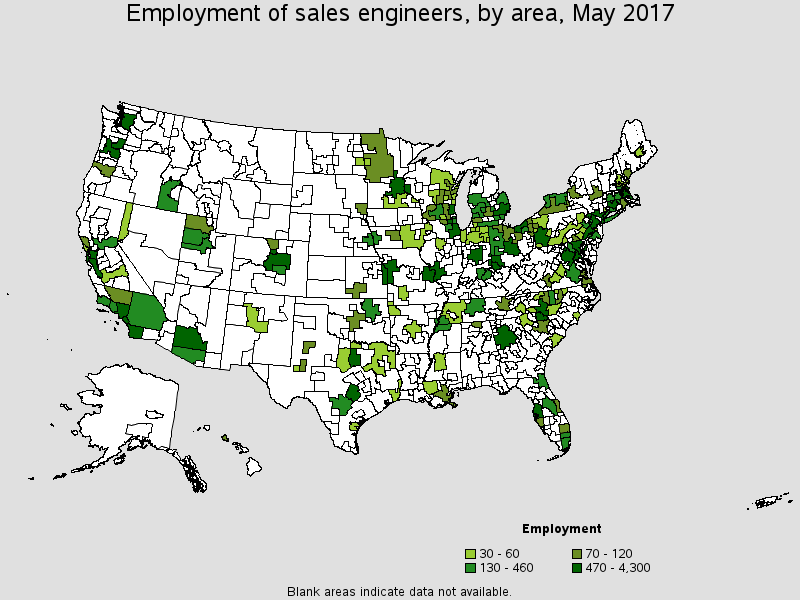
Metropolitan areas with the highest employment level in this occupation:
| Metropolitan area | Employment (1) | Employment per thousand jobs | Location quotient (9) | Hourly mean wage | Annual mean wage (2) |
|---|---|---|---|---|---|
| Boston-Cambridge-Newton, MA NECTA Division | 2,800 | 1.52 | 3.06 | $51.54 | $107,200 |
| Denver-Aurora-Lakewood, CO | 2,390 | 1.66 | 3.34 | $60.97 | $126,830 |
| Los Angeles-Long Beach-Glendale, CA Metropolitan Division | 2,260 | 0.51 | 1.03 | $52.47 | $109,130 |
| San Jose-Sunnyvale-Santa Clara, CA | 2,040 | 1.88 | 3.78 | $62.45 | $129,890 |
| Chicago-Naperville-Arlington Heights, IL Metropolitan Division | 1,900 | 0.52 | 1.05 | $50.32 | $104,670 |
| New York-Jersey City-White Plains, NY-NJ Metropolitan Division | 1,820 | 0.27 | 0.55 | $55.63 | $115,700 |
| Atlanta-Sandy Springs-Roswell, GA | 1,720 | 0.66 | 1.32 | $44.71 | $93,000 |
| Phoenix-Mesa-Scottsdale, AZ | 1,600 | 0.81 | 1.62 | $51.70 | $107,530 |
| Anaheim-Santa Ana-Irvine, CA Metropolitan Division | 1,510 | 0.94 | 1.88 | $64.22 | $133,570 |
| Washington-Arlington-Alexandria, DC-VA-MD-WV Metropolitan Division | 1,400 | 0.56 | 1.12 | $63.87 | $132,840 |
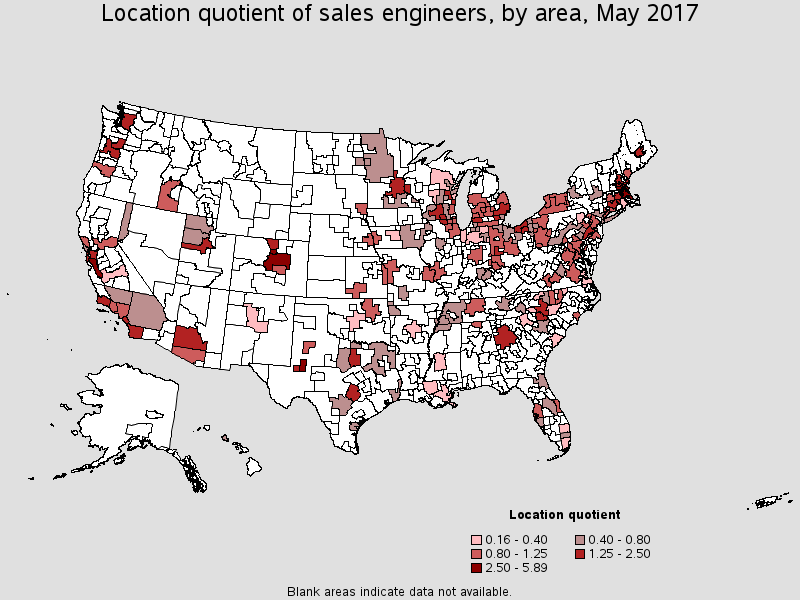
Metropolitan areas with the highest concentration of jobs and location quotients in this occupation:
| Metropolitan area | Employment (1) | Employment per thousand jobs | Location quotient (9) | Hourly mean wage | Annual mean wage (2) |
|---|---|---|---|---|---|
| Boulder, CO | 520 | 2.93 | 5.89 | $63.51 | $132,100 |
| Framingham, MA NECTA Division | 470 | 2.73 | 5.49 | $52.93 | $110,100 |
| Lowell-Billerica-Chelmsford, MA-NH NECTA Division | 330 | 2.11 | 4.25 | $57.33 | $119,250 |
| San Jose-Sunnyvale-Santa Clara, CA | 2,040 | 1.88 | 3.78 | $62.45 | $129,890 |
| Denver-Aurora-Lakewood, CO | 2,390 | 1.66 | 3.34 | $60.97 | $126,830 |
| Boston-Cambridge-Newton, MA NECTA Division | 2,800 | 1.52 | 3.06 | $51.54 | $107,200 |
| Nashua, NH-MA NECTA Division | 190 | 1.42 | 2.86 | $54.69 | $113,750 |
| Midland, TX | 110 | 1.25 | 2.52 | $57.33 | $119,240 |
| San Francisco-Redwood City-South San Francisco, CA Metropolitan Division | 1,320 | 1.18 | 2.37 | $54.32 | $112,990 |
| Akron, OH | 360 | 1.10 | 2.21 | $47.92 | $99,670 |
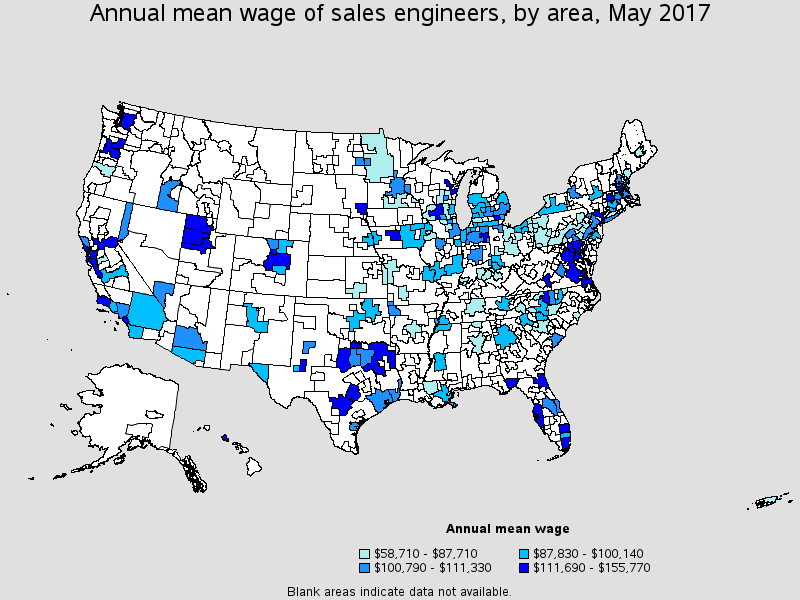
Top paying metropolitan areas for this occupation:
| Metropolitan area | Employment (1) | Employment per thousand jobs | Location quotient (9) | Hourly mean wage | Annual mean wage (2) |
|---|---|---|---|---|---|
| Silver Spring-Frederick-Rockville, MD Metropolitan Division | 350 | 0.60 | 1.22 | $74.89 | $155,770 |
| North Port-Sarasota-Bradenton, FL | 100 | 0.33 | 0.67 | $67.70 | $140,820 |
| Ann Arbor, MI | 150 | 0.71 | 1.43 | $66.09 | $137,460 |
| Ogden-Clearfield, UT | 80 | 0.32 | 0.64 | $65.79 | $136,850 |
| Santa Maria-Santa Barbara, CA | 130 | 0.71 | 1.44 | $65.35 | $135,930 |
| Anaheim-Santa Ana-Irvine, CA Metropolitan Division | 1,510 | 0.94 | 1.88 | $64.22 | $133,570 |
| Washington-Arlington-Alexandria, DC-VA-MD-WV Metropolitan Division | 1,400 | 0.56 | 1.12 | $63.87 | $132,840 |
| Boulder, CO | 520 | 2.93 | 5.89 | $63.51 | $132,100 |
| San Antonio-New Braunfels, TX | 390 | 0.38 | 0.77 | $62.74 | $130,510 |
| San Jose-Sunnyvale-Santa Clara, CA | 2,040 | 1.88 | 3.78 | $62.45 | $129,890 |
Nonmetropolitan areas with the highest employment in this occupation:
| Nonmetropolitan area | Employment (1) | Employment per thousand jobs | Location quotient (9) | Hourly mean wage | Annual mean wage (2) |
|---|---|---|---|---|---|
| West Northwestern Ohio nonmetropolitan area | 140 | 0.56 | 1.13 | (8) | (8) |
| Balance of Lower Peninsula of Michigan nonmetropolitan area | 140 | 0.51 | 1.02 | $45.15 | $93,900 |
| North Northeastern Ohio non-metropolitan area (non-contiguous) | 110 | 0.35 | 0.70 | $40.07 | $83,340 |
| Southwest New York nonmetropolitan area | 100 | 0.56 | 1.13 | $42.63 | $88,670 |
| South Central Wisconsin nonmetropolitan area | 70 | 0.35 | 0.70 | $38.83 | $80,760 |
Nonmetropolitan areas with the highest concentration of jobs and location quotients in this occupation:
| Nonmetropolitan area | Employment (1) | Employment per thousand jobs | Location quotient (9) | Hourly mean wage | Annual mean wage (2) |
|---|---|---|---|---|---|
| Central New Hampshire nonmetropolitan area | 60 | 0.62 | 1.25 | $52.24 | $108,660 |
| West Northwestern Ohio nonmetropolitan area | 140 | 0.56 | 1.13 | (8) | (8) |
| Southwest New York nonmetropolitan area | 100 | 0.56 | 1.13 | $42.63 | $88,670 |
| Balance of Lower Peninsula of Michigan nonmetropolitan area | 140 | 0.51 | 1.02 | $45.15 | $93,900 |
| Western Pennsylvania nonmetropolitan area | 60 | 0.42 | 0.85 | $35.85 | $74,580 |
Top paying nonmetropolitan areas for this occupation:
| Nonmetropolitan area | Employment (1) | Employment per thousand jobs | Location quotient (9) | Hourly mean wage | Annual mean wage (2) |
|---|---|---|---|---|---|
| North Texas Region of Texas nonmetropolitan area | 60 | 0.20 | 0.41 | $54.11 | $112,550 |
| Central New Hampshire nonmetropolitan area | 60 | 0.62 | 1.25 | $52.24 | $108,660 |
| Northern Indiana nonmetropolitan area | 40 | 0.18 | 0.37 | $49.94 | $103,880 |
| East Central Illinois nonmetropolitan area | (8) | (8) | (8) | $45.55 | $94,750 |
| Southeast Iowa nonmetropolitan area | 50 | 0.22 | 0.44 | $45.33 | $94,290 |
These estimates are calculated with data collected from employers in all industry sectors, all metropolitan and nonmetropolitan areas, and all states and the District of Columbia. The top employment and wage figures are provided above. The complete list is available in the downloadable XLS files.
The percentile wage estimate is the value of a wage below which a certain percent of workers fall. The median wage is the 50th percentile wage estimate--50 percent of workers earn less than the median and 50 percent of workers earn more than the median. More about percentile wages.
(1) Estimates for detailed occupations do not sum to the totals because the totals include occupations not shown separately. Estimates do not include self-employed workers.
(2) Annual wages have been calculated by multiplying the hourly mean wage by a "year-round, full-time" hours figure of 2,080 hours; for those occupations where there is not an hourly wage published, the annual wage has been directly calculated from the reported survey data.
(3) The relative standard error (RSE) is a measure of the reliability of a survey statistic. The smaller the relative standard error, the more precise the estimate.
(8) Estimate not released.
(9) The location quotient is the ratio of the area concentration of occupational employment to the national average concentration. A location quotient greater than one indicates the occupation has a higher share of employment than average, and a location quotient less than one indicates the occupation is less prevalent in the area than average.
Other OES estimates and related information:
May 2017 National Occupational Employment and Wage Estimates
May 2017 State Occupational Employment and Wage Estimates
May 2017 Metropolitan and Nonmetropolitan Area Occupational Employment and Wage Estimates
May 2017 National Industry-Specific Occupational Employment and Wage Estimates
Last Modified Date: March 30, 2018