
An official website of the United States government
An official website of the United States government
The .gov means it's official.
Federal government websites often end in .gov or .mil. Before sharing sensitive information,
make sure you're on a federal government site.
The site is secure.
The
https:// ensures that you are connecting to the official website and that any
information you provide is encrypted and transmitted securely.
Provide information by accessing alphabetical, geographical, or other directories. Assist customers with special billing requests, such as charges to a third party and credits or refunds for incorrectly dialed numbers or bad connections. May handle emergency calls and assist children or people with physical disabilities to make telephone calls.
Employment estimate and mean wage estimates for this occupation:
| Employment (1) | Employment RSE (3) |
Mean hourly wage |
Mean annual wage (2) |
Wage RSE (3) |
|---|---|---|---|---|
| 6,310 | 8.1 % | $18.47 | $38,410 | 2.5 % |
Percentile wage estimates for this occupation:
| Percentile | 10% | 25% | 50% (Median) |
75% | 90% |
|---|---|---|---|---|---|
| Hourly Wage | $10.85 | $13.23 | $17.46 | $23.64 | $28.44 |
| Annual Wage (2) | $22,580 | $27,520 | $36,320 | $49,170 | $59,150 |
Industries with the highest published employment and wages for this occupation are provided. For a list of all industries with employment in this occupation, see the Create Customized Tables function.
Industries with the highest levels of employment in this occupation:
| Industry | Employment (1) | Percent of industry employment | Hourly mean wage | Annual mean wage (2) |
|---|---|---|---|---|
| Telecommunications | 1,880 | 0.24 | $22.10 | $45,980 |
| General Medical and Surgical Hospitals | 1,350 | 0.02 | $17.22 | $35,820 |
| Offices of Physicians | 570 | 0.02 | $13.65 | $28,390 |
| Local Government, excluding schools and hospitals (OES Designation) | 510 | 0.01 | $20.31 | $42,240 |
| Business Support Services | 440 | 0.05 | $15.10 | $31,400 |
Industries with the highest concentration of employment in this occupation:
| Industry | Employment (1) | Percent of industry employment | Hourly mean wage | Annual mean wage (2) |
|---|---|---|---|---|
| Telecommunications | 1,880 | 0.24 | $22.10 | $45,980 |
| Business Support Services | 440 | 0.05 | $15.10 | $31,400 |
| Specialty (except Psychiatric and Substance Abuse) Hospitals | 90 | 0.04 | $18.18 | $37,820 |
| General Medical and Surgical Hospitals | 1,350 | 0.02 | $17.22 | $35,820 |
| Offices of Physicians | 570 | 0.02 | $13.65 | $28,390 |
Top paying industries for this occupation:
| Industry | Employment (1) | Percent of industry employment | Hourly mean wage | Annual mean wage (2) |
|---|---|---|---|---|
| Telecommunications | 1,880 | 0.24 | $22.10 | $45,980 |
| Management of Companies and Enterprises | 40 | (7) | $20.94 | $43,550 |
| Local Government, excluding schools and hospitals (OES Designation) | 510 | 0.01 | $20.31 | $42,240 |
| Credit Intermediation and Related Activities (5221 And 5223 only) | (8) | (8) | $19.94 | $41,480 |
| Specialty (except Psychiatric and Substance Abuse) Hospitals | 90 | 0.04 | $18.18 | $37,820 |
States and areas with the highest published employment, location quotients, and wages for this occupation are provided. For a list of all areas with employment in this occupation, see the Create Customized Tables function.
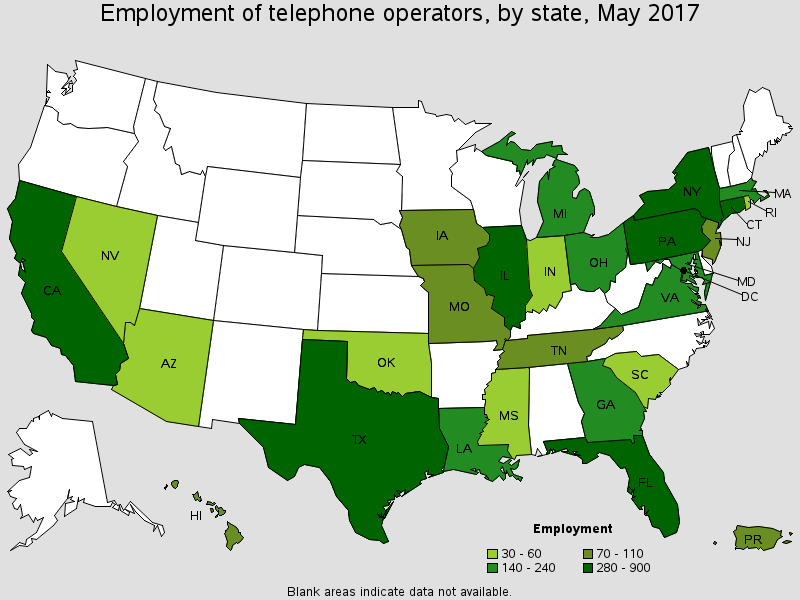
States with the highest employment level in this occupation:
| State | Employment (1) | Employment per thousand jobs | Location quotient (9) | Hourly mean wage | Annual mean wage (2) |
|---|---|---|---|---|---|
| New York | 900 | 0.10 | 2.21 | $23.12 | $48,100 |
| California | 570 | 0.03 | 0.77 | $18.97 | $39,450 |
| Texas | 420 | 0.04 | 0.79 | $18.06 | $37,570 |
| Illinois | 390 | 0.07 | 1.49 | $16.64 | $34,610 |
| Pennsylvania | 300 | 0.05 | 1.16 | $18.59 | $38,680 |
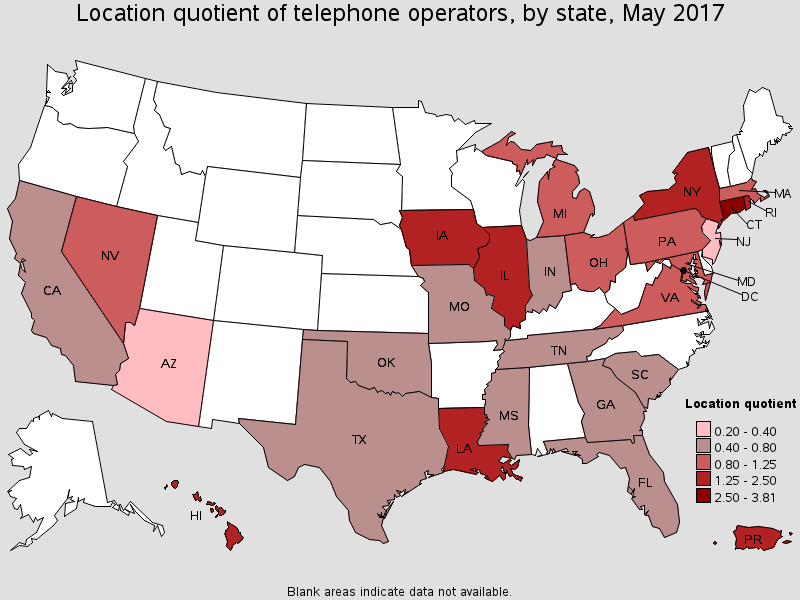
States with the highest concentration of jobs and location quotients in this occupation:
| State | Employment (1) | Employment per thousand jobs | Location quotient (9) | Hourly mean wage | Annual mean wage (2) |
|---|---|---|---|---|---|
| Connecticut | 280 | 0.17 | 3.81 | $15.68 | $32,610 |
| Hawaii | 70 | 0.11 | 2.39 | $21.42 | $44,550 |
| New York | 900 | 0.10 | 2.21 | $23.12 | $48,100 |
| Rhode Island | 40 | 0.08 | 1.73 | (8) | (8) |
| Louisiana | 150 | 0.08 | 1.72 | $16.02 | $33,330 |
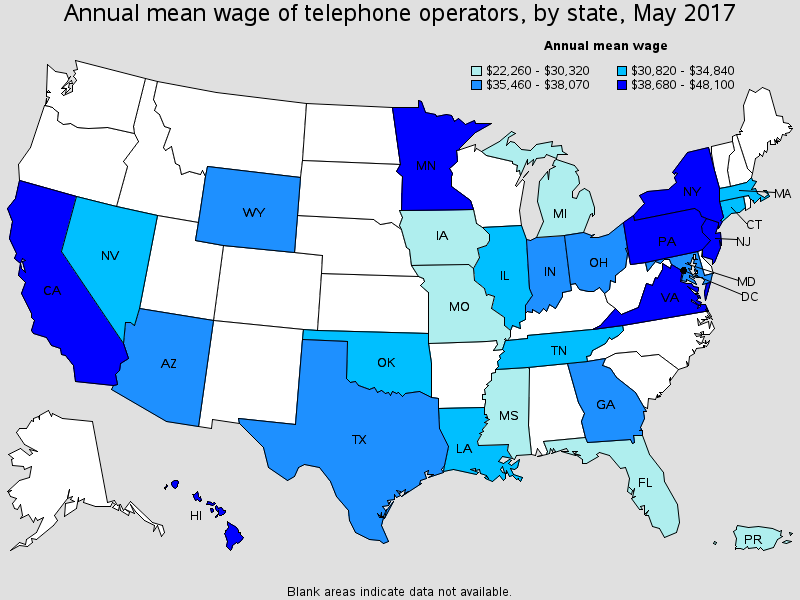
Top paying States for this occupation:
| State | Employment (1) | Employment per thousand jobs | Location quotient (9) | Hourly mean wage | Annual mean wage (2) |
|---|---|---|---|---|---|
| New York | 900 | 0.10 | 2.21 | $23.12 | $48,100 |
| Hawaii | 70 | 0.11 | 2.39 | $21.42 | $44,550 |
| District of Columbia | 50 | 0.08 | 1.73 | $21.31 | $44,320 |
| Virginia | 180 | 0.05 | 1.04 | $20.99 | $43,660 |
| New Jersey | 70 | 0.02 | 0.37 | $19.62 | $40,800 |
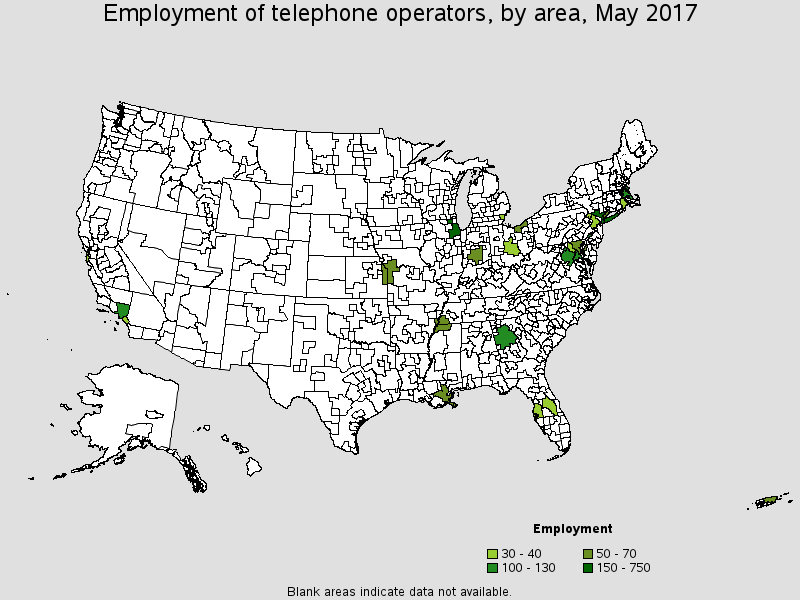
Metropolitan areas with the highest employment level in this occupation:
| Metropolitan area | Employment (1) | Employment per thousand jobs | Location quotient (9) | Hourly mean wage | Annual mean wage (2) |
|---|---|---|---|---|---|
| New York-Jersey City-White Plains, NY-NJ Metropolitan Division | 490 | 0.07 | 1.64 | $23.67 | $49,230 |
| Chicago-Naperville-Arlington Heights, IL Metropolitan Division | 280 | 0.08 | 1.73 | $17.08 | $35,520 |
| Nassau County-Suffolk County, NY Metropolitan Division | 230 | 0.18 | 4.02 | $21.72 | $45,180 |
| Philadelphia, PA Metropolitan Division | 130 | 0.14 | 3.27 | $18.65 | $38,800 |
| Los Angeles-Long Beach-Glendale, CA Metropolitan Division | 130 | 0.03 | 0.67 | $18.05 | $37,540 |
| Washington-Arlington-Alexandria, DC-VA-MD-WV Metropolitan Division | 110 | 0.04 | 0.95 | $18.71 | $38,910 |
| Atlanta-Sandy Springs-Roswell, GA | 100 | 0.04 | 0.86 | $19.79 | $41,160 |
| Boston-Cambridge-Newton, MA NECTA Division | 100 | 0.05 | 1.19 | $16.93 | $35,220 |
| Bridgeport-Stamford-Norwalk, CT | 70 | 0.17 | 3.76 | $14.21 | $29,550 |
| Kansas City, MO-KS | 60 | 0.06 | 1.31 | $15.09 | $31,380 |
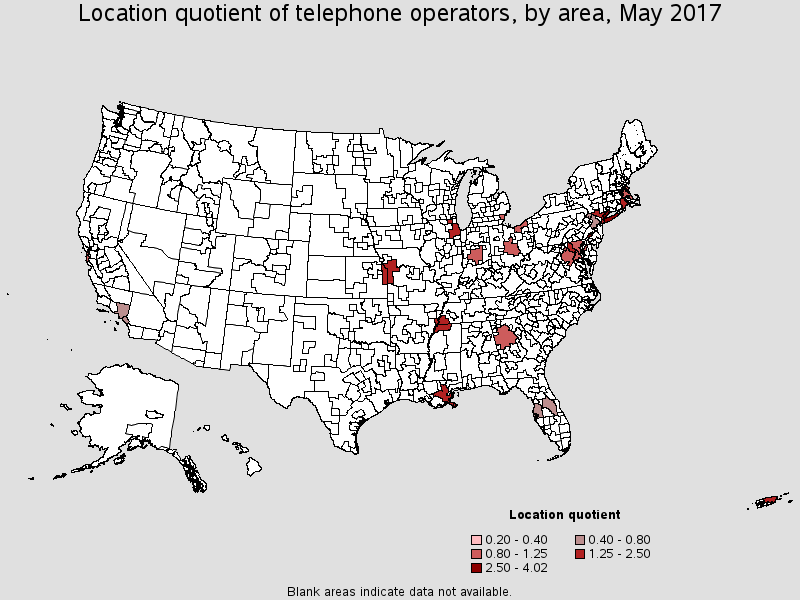
Metropolitan areas with the highest concentration of jobs and location quotients in this occupation:
| Metropolitan area | Employment (1) | Employment per thousand jobs | Location quotient (9) | Hourly mean wage | Annual mean wage (2) |
|---|---|---|---|---|---|
| Nassau County-Suffolk County, NY Metropolitan Division | 230 | 0.18 | 4.02 | $21.72 | $45,180 |
| Bridgeport-Stamford-Norwalk, CT | 70 | 0.17 | 3.76 | $14.21 | $29,550 |
| Philadelphia, PA Metropolitan Division | 130 | 0.14 | 3.27 | $18.65 | $38,800 |
| New Orleans-Metairie, LA | 50 | 0.09 | 1.99 | $13.49 | $28,050 |
| Memphis, TN-MS-AR | 50 | 0.08 | 1.85 | $15.45 | $32,130 |
| Chicago-Naperville-Arlington Heights, IL Metropolitan Division | 280 | 0.08 | 1.73 | $17.08 | $35,520 |
| Providence-Warwick, RI-MA | 40 | 0.07 | 1.52 | $19.33 | $40,200 |
| Silver Spring-Frederick-Rockville, MD Metropolitan Division | 40 | 0.07 | 1.49 | $19.65 | $40,860 |
| New York-Jersey City-White Plains, NY-NJ Metropolitan Division | 490 | 0.07 | 1.64 | $23.67 | $49,230 |
| Kansas City, MO-KS | 60 | 0.06 | 1.31 | $15.09 | $31,380 |
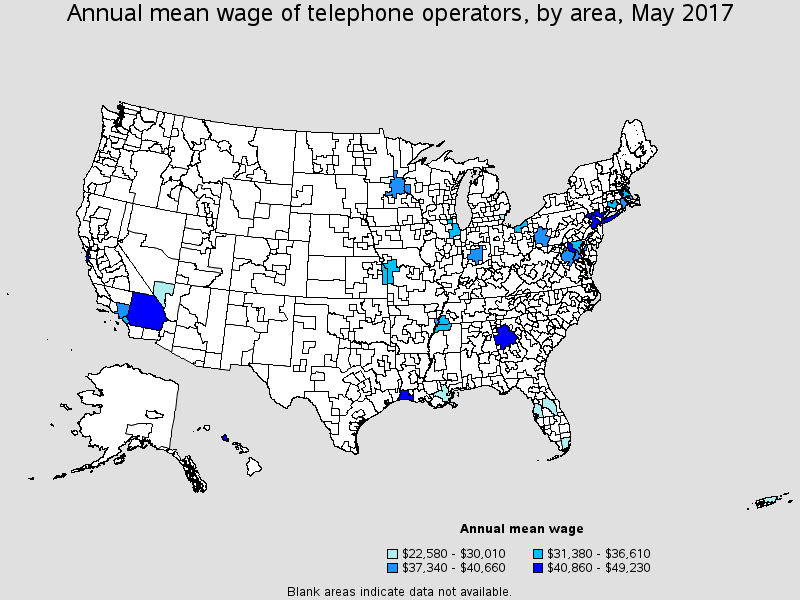
Top paying metropolitan areas for this occupation:
| Metropolitan area | Employment (1) | Employment per thousand jobs | Location quotient (9) | Hourly mean wage | Annual mean wage (2) |
|---|---|---|---|---|---|
| New York-Jersey City-White Plains, NY-NJ Metropolitan Division | 490 | 0.07 | 1.64 | $23.67 | $49,230 |
| San Francisco-Redwood City-South San Francisco, CA Metropolitan Division | 40 | 0.04 | 0.87 | $22.11 | $45,980 |
| Nassau County-Suffolk County, NY Metropolitan Division | 230 | 0.18 | 4.02 | $21.72 | $45,180 |
| Urban Honolulu, HI | (8) | (8) | (8) | $21.27 | $44,250 |
| Newark, NJ-PA Metropolitan Division | 30 | 0.03 | 0.59 | $20.79 | $43,240 |
| Riverside-San Bernardino-Ontario, CA | (8) | (8) | (8) | $20.10 | $41,810 |
| Lake Charles, LA | (8) | (8) | (8) | $19.98 | $41,560 |
| Atlanta-Sandy Springs-Roswell, GA | 100 | 0.04 | 0.86 | $19.79 | $41,160 |
| Silver Spring-Frederick-Rockville, MD Metropolitan Division | 40 | 0.07 | 1.49 | $19.65 | $40,860 |
| Pittsburgh, PA | (8) | (8) | (8) | $19.55 | $40,660 |
These estimates are calculated with data collected from employers in all industry sectors, all metropolitan and nonmetropolitan areas, and all states and the District of Columbia. The top employment and wage figures are provided above. The complete list is available in the downloadable XLS files.
The percentile wage estimate is the value of a wage below which a certain percent of workers fall. The median wage is the 50th percentile wage estimate--50 percent of workers earn less than the median and 50 percent of workers earn more than the median. More about percentile wages.
(1) Estimates for detailed occupations do not sum to the totals because the totals include occupations not shown separately. Estimates do not include self-employed workers.
(2) Annual wages have been calculated by multiplying the hourly mean wage by a "year-round, full-time" hours figure of 2,080 hours; for those occupations where there is not an hourly wage published, the annual wage has been directly calculated from the reported survey data.
(3) The relative standard error (RSE) is a measure of the reliability of a survey statistic. The smaller the relative standard error, the more precise the estimate.
(7) The value is less than .005 percent of industry employment.
(8) Estimate not released.
(9) The location quotient is the ratio of the area concentration of occupational employment to the national average concentration. A location quotient greater than one indicates the occupation has a higher share of employment than average, and a location quotient less than one indicates the occupation is less prevalent in the area than average.
Other OES estimates and related information:
May 2017 National Occupational Employment and Wage Estimates
May 2017 State Occupational Employment and Wage Estimates
May 2017 Metropolitan and Nonmetropolitan Area Occupational Employment and Wage Estimates
May 2017 National Industry-Specific Occupational Employment and Wage Estimates
Last Modified Date: March 30, 2018