
An official website of the United States government
An official website of the United States government
The .gov means it's official.
Federal government websites often end in .gov or .mil. Before sharing sensitive information,
make sure you're on a federal government site.
The site is secure.
The
https:// ensures that you are connecting to the official website and that any
information you provide is encrypted and transmitted securely.
Drive and control farm equipment to till soil and to plant, cultivate, and harvest crops. May perform tasks, such as crop baling or hay bucking. May operate stationary equipment to perform post-harvest tasks, such as husking, shelling, threshing, and ginning.
Employment estimate and mean wage estimates for this occupation:
| Employment (1) | Employment RSE (3) |
Mean hourly wage |
Mean annual wage (2) |
Wage RSE (3) |
|---|---|---|---|---|
| 26,070 | 4.5 % | $15.12 | $31,440 | 1.0 % |
Percentile wage estimates for this occupation:
| Percentile | 10% | 25% | 50% (Median) |
75% | 90% |
|---|---|---|---|---|---|
| Hourly Wage | $9.74 | $11.80 | $14.48 | $17.75 | $21.45 |
| Annual Wage (2) | $20,250 | $24,540 | $30,110 | $36,910 | $44,620 |
Industries with the highest published employment and wages for this occupation are provided. For a list of all industries with employment in this occupation, see the Create Customized Tables function.
Industries with the highest levels of employment in this occupation:
| Industry | Employment (1) | Percent of industry employment | Hourly mean wage | Annual mean wage (2) |
|---|---|---|---|---|
| Support Activities for Crop Production | 14,590 | 4.24 | $14.37 | $29,890 |
| Merchant Wholesalers, Nondurable Goods (4241, 4247, and 4249 only) | 4,930 | 0.91 | $16.99 | $35,330 |
| Farm Product Raw Material Merchant Wholesalers | 1,540 | 2.11 | $16.87 | $35,090 |
| Employment Services | 750 | 0.02 | $11.73 | $24,410 |
| Lawn and Garden Equipment and Supplies Stores | 470 | 0.29 | $15.88 | $33,040 |
Industries with the highest concentration of employment in this occupation:
| Industry | Employment (1) | Percent of industry employment | Hourly mean wage | Annual mean wage (2) |
|---|---|---|---|---|
| Support Activities for Crop Production | 14,590 | 4.24 | $14.37 | $29,890 |
| Farm Product Raw Material Merchant Wholesalers | 1,540 | 2.11 | $16.87 | $35,090 |
| Merchant Wholesalers, Nondurable Goods (4241, 4247, and 4249 only) | 4,930 | 0.91 | $16.99 | $35,330 |
| Support Activities for Animal Production | 120 | 0.38 | $15.23 | $31,670 |
| Lawn and Garden Equipment and Supplies Stores | 470 | 0.29 | $15.88 | $33,040 |
Top paying industries for this occupation:
| Industry | Employment (1) | Percent of industry employment | Hourly mean wage | Annual mean wage (2) |
|---|---|---|---|---|
| Machinery, Equipment, and Supplies Merchant Wholesalers | (8) | (8) | $23.72 | $49,340 |
| State Government, excluding schools and hospitals (OES Designation) | 40 | (7) | $21.28 | $44,270 |
| Management, Scientific, and Technical Consulting Services | (8) | (8) | $20.61 | $42,870 |
| Colleges, Universities, and Professional Schools | 180 | 0.01 | $19.59 | $40,760 |
| Merchant Wholesalers, Nondurable Goods (4241, 4247, and 4249 only) | 4,930 | 0.91 | $16.99 | $35,330 |
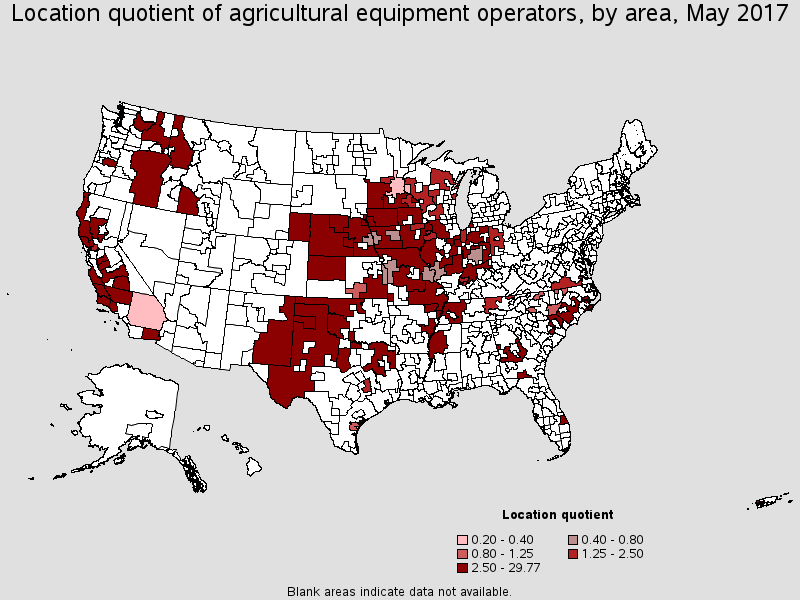
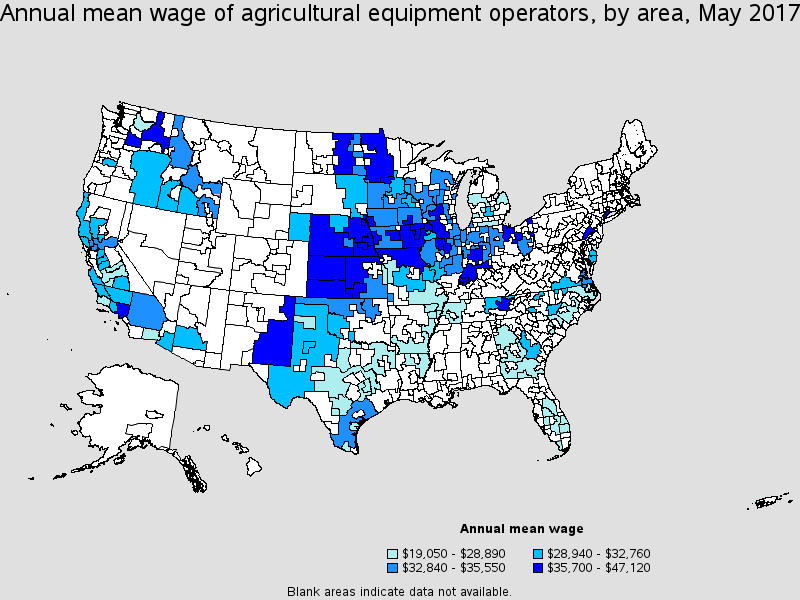
States and areas with the highest published employment, location quotients, and wages for this occupation are provided. For a list of all areas with employment in this occupation, see the Create Customized Tables function.
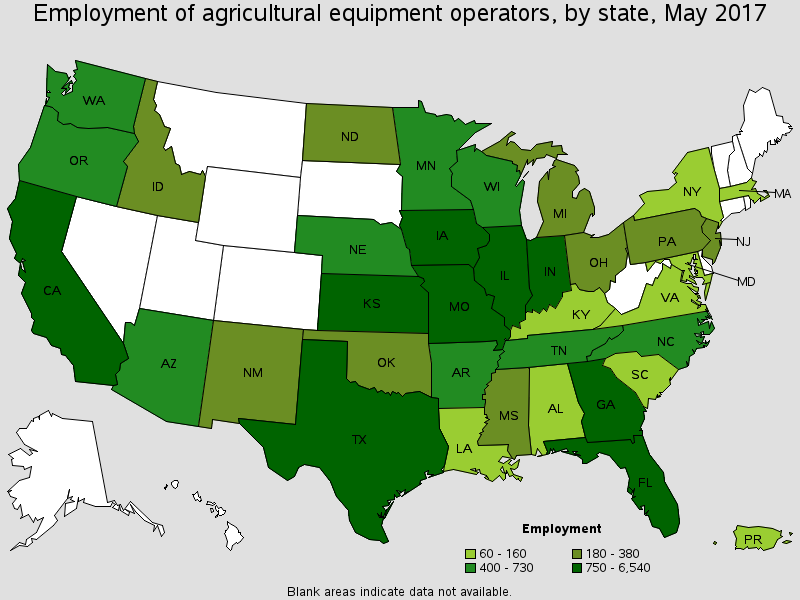
States with the highest employment level in this occupation:
| State | Employment (1) | Employment per thousand jobs | Location quotient (9) | Hourly mean wage | Annual mean wage (2) |
|---|---|---|---|---|---|
| California | 6,540 | 0.39 | 2.14 | $14.75 | $30,670 |
| Texas | 2,590 | 0.22 | 1.19 | $13.88 | $28,870 |
| Florida | 1,860 | 0.22 | 1.21 | $12.34 | $25,660 |
| Iowa | 1,390 | 0.90 | 4.94 | $16.93 | $35,220 |
| Illinois | 1,330 | 0.22 | 1.22 | $16.72 | $34,790 |
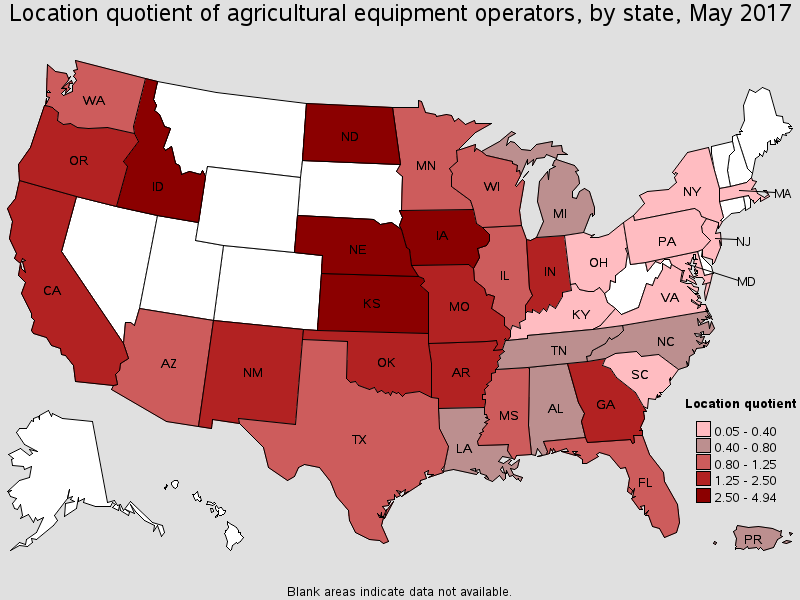
States with the highest concentration of jobs and location quotients in this occupation:
| State | Employment (1) | Employment per thousand jobs | Location quotient (9) | Hourly mean wage | Annual mean wage (2) |
|---|---|---|---|---|---|
| Iowa | 1,390 | 0.90 | 4.94 | $16.93 | $35,220 |
| Kansas | 1,040 | 0.76 | 4.16 | $17.45 | $36,300 |
| Nebraska | 730 | 0.75 | 4.11 | $18.01 | $37,450 |
| North Dakota | 290 | 0.69 | 3.80 | $18.16 | $37,770 |
| Idaho | 370 | 0.54 | 2.95 | $15.38 | $31,980 |
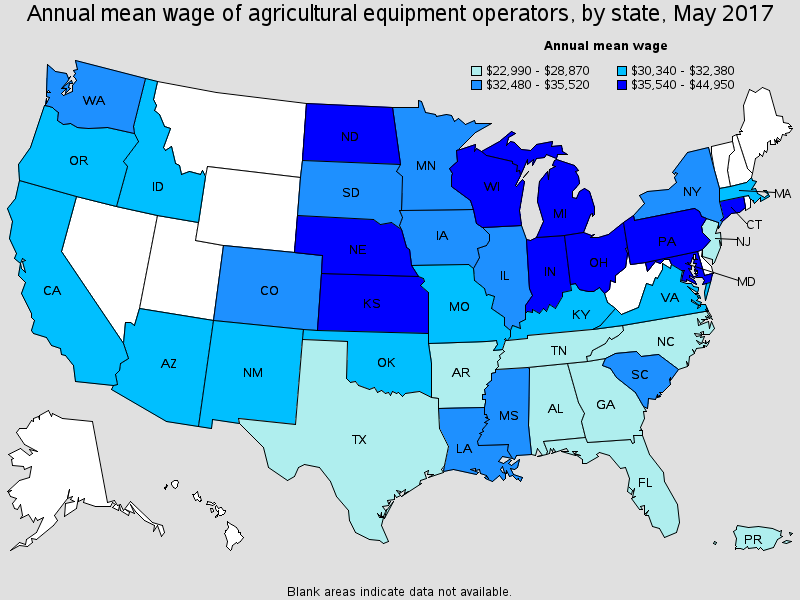
Top paying States for this occupation:
| State | Employment (1) | Employment per thousand jobs | Location quotient (9) | Hourly mean wage | Annual mean wage (2) |
|---|---|---|---|---|---|
| Connecticut | (8) | (8) | (8) | $21.61 | $44,950 |
| Maryland | 80 | 0.03 | 0.16 | $20.30 | $42,220 |
| Pennsylvania | 320 | 0.06 | 0.31 | $18.81 | $39,120 |
| North Dakota | 290 | 0.69 | 3.80 | $18.16 | $37,770 |
| Nebraska | 730 | 0.75 | 4.11 | $18.01 | $37,450 |
Metropolitan areas with the highest employment level in this occupation:
| Metropolitan area | Employment (1) | Employment per thousand jobs | Location quotient (9) | Hourly mean wage | Annual mean wage (2) |
|---|---|---|---|---|---|
| Salinas, CA | 910 | 5.32 | 29.07 | $14.01 | $29,140 |
| Bakersfield, CA | 910 | 3.00 | 16.42 | $15.31 | $31,850 |
| Fresno, CA | 510 | 1.37 | 7.51 | $13.00 | $27,040 |
| Modesto, CA | 350 | 1.91 | 10.44 | $14.31 | $29,770 |
| Visalia-Porterville, CA | 330 | 2.17 | 11.86 | $14.05 | $29,230 |
| San Luis Obispo-Paso Robles-Arroyo Grande, CA | 280 | 2.41 | 13.17 | $14.01 | $29,140 |
| Santa Rosa, CA | 270 | 1.34 | 7.34 | $15.47 | $32,180 |
| Napa, CA | 220 | 3.03 | 16.57 | $17.08 | $35,530 |
| Merced, CA | 210 | 3.10 | 16.96 | $15.71 | $32,690 |
| El Centro, CA | 210 | 3.46 | 18.94 | $12.23 | $25,450 |
Metropolitan areas with the highest concentration of jobs and location quotients in this occupation:
| Metropolitan area | Employment (1) | Employment per thousand jobs | Location quotient (9) | Hourly mean wage | Annual mean wage (2) |
|---|---|---|---|---|---|
| Salinas, CA | 910 | 5.32 | 29.07 | $14.01 | $29,140 |
| El Centro, CA | 210 | 3.46 | 18.94 | $12.23 | $25,450 |
| Merced, CA | 210 | 3.10 | 16.96 | $15.71 | $32,690 |
| Napa, CA | 220 | 3.03 | 16.57 | $17.08 | $35,530 |
| Bakersfield, CA | 910 | 3.00 | 16.42 | $15.31 | $31,850 |
| Valdosta, GA | 150 | 2.76 | 15.08 | $10.59 | $22,020 |
| Wenatchee, WA | 120 | 2.55 | 13.92 | $13.89 | $28,890 |
| San Luis Obispo-Paso Robles-Arroyo Grande, CA | 280 | 2.41 | 13.17 | $14.01 | $29,140 |
| Visalia-Porterville, CA | 330 | 2.17 | 11.86 | $14.05 | $29,230 |
| Modesto, CA | 350 | 1.91 | 10.44 | $14.31 | $29,770 |
Top paying metropolitan areas for this occupation:
| Metropolitan area | Employment (1) | Employment per thousand jobs | Location quotient (9) | Hourly mean wage | Annual mean wage (2) |
|---|---|---|---|---|---|
| Bridgeport-Stamford-Norwalk, CT | (8) | (8) | (8) | $22.07 | $45,910 |
| Montgomery County-Bucks County-Chester County, PA Metropolitan Division | (8) | (8) | (8) | $21.99 | $45,740 |
| Wichita, KS | 60 | 0.22 | 1.19 | $19.66 | $40,890 |
| Des Moines-West Des Moines, IA | 50 | 0.13 | 0.71 | $19.34 | $40,230 |
| Iowa City, IA | (8) | (8) | (8) | $18.81 | $39,130 |
| Waterloo-Cedar Falls, IA | (8) | (8) | (8) | $18.77 | $39,040 |
| Lincoln, NE | (8) | (8) | (8) | $18.59 | $38,660 |
| Peoria, IL | (8) | (8) | (8) | $18.50 | $38,470 |
| Madison, WI | 120 | 0.31 | 1.69 | $18.40 | $38,280 |
| Knoxville, TN | (8) | (8) | (8) | $18.28 | $38,030 |
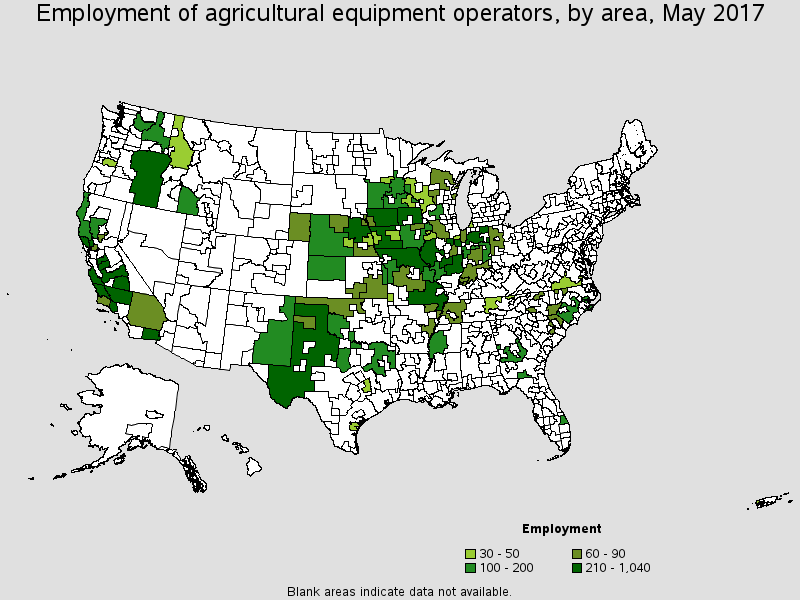
Nonmetropolitan areas with the highest employment in this occupation:
| Nonmetropolitan area | Employment (1) | Employment per thousand jobs | Location quotient (9) | Hourly mean wage | Annual mean wage (2) |
|---|---|---|---|---|---|
| West Texas Region of Texas nonmetropolitan area | 1,040 | 5.44 | 29.77 | $14.31 | $29,760 |
| Southwest Iowa nonmetropolitan area | 400 | 4.72 | 25.83 | $15.91 | $33,090 |
| Eastern Oregon nonmetropolitan area | 360 | 5.26 | 28.73 | $14.60 | $30,380 |
| West Central Illinois nonmetropolitan area | 290 | 1.68 | 9.21 | $15.79 | $32,840 |
| Southeast Missouri nonmetropolitan area | 280 | 1.73 | 9.45 | $12.80 | $26,620 |
Nonmetropolitan areas with the highest concentration of jobs and location quotients in this occupation:
| Nonmetropolitan area | Employment (1) | Employment per thousand jobs | Location quotient (9) | Hourly mean wage | Annual mean wage (2) |
|---|---|---|---|---|---|
| West Texas Region of Texas nonmetropolitan area | 1,040 | 5.44 | 29.77 | $14.31 | $29,760 |
| Eastern Oregon nonmetropolitan area | 360 | 5.26 | 28.73 | $14.60 | $30,380 |
| Southwest Iowa nonmetropolitan area | 400 | 4.72 | 25.83 | $15.91 | $33,090 |
| North Valley Region of California nonmetropolitan area | 150 | 4.62 | 25.27 | $14.57 | $30,310 |
| Southwest Oklahoma nonmetropolitan area | 200 | 3.29 | 17.97 | $13.95 | $29,010 |
Top paying nonmetropolitan areas for this occupation:
| Nonmetropolitan area | Employment (1) | Employment per thousand jobs | Location quotient (9) | Hourly mean wage | Annual mean wage (2) |
|---|---|---|---|---|---|
| Northwest Illinois nonmetropolitan area | 80 | 0.57 | 3.13 | $22.65 | $47,120 |
| Northwest Minnesota nonmetropolitan area | (8) | (8) | (8) | $22.33 | $46,440 |
| Southeast Nebraska nonmetropolitan area | 90 | 2.02 | 11.06 | $20.39 | $42,420 |
| Northwest Kansas nonmetropolitan area | 160 | 2.62 | 14.35 | $19.27 | $40,090 |
| North Northeastern Ohio non-metropolitan area (non-contiguous) | (8) | (8) | (8) | $19.14 | $39,820 |
These estimates are calculated with data collected from employers in all industry sectors, all metropolitan and nonmetropolitan areas, and all states and the District of Columbia. The top employment and wage figures are provided above. The complete list is available in the downloadable XLS files.
The percentile wage estimate is the value of a wage below which a certain percent of workers fall. The median wage is the 50th percentile wage estimate--50 percent of workers earn less than the median and 50 percent of workers earn more than the median. More about percentile wages.
(1) Estimates for detailed occupations do not sum to the totals because the totals include occupations not shown separately. Estimates do not include self-employed workers.
(2) Annual wages have been calculated by multiplying the hourly mean wage by a "year-round, full-time" hours figure of 2,080 hours; for those occupations where there is not an hourly wage published, the annual wage has been directly calculated from the reported survey data.
(3) The relative standard error (RSE) is a measure of the reliability of a survey statistic. The smaller the relative standard error, the more precise the estimate.
(7) The value is less than .005 percent of industry employment.
(8) Estimate not released.
(9) The location quotient is the ratio of the area concentration of occupational employment to the national average concentration. A location quotient greater than one indicates the occupation has a higher share of employment than average, and a location quotient less than one indicates the occupation is less prevalent in the area than average.
Other OES estimates and related information:
May 2017 National Occupational Employment and Wage Estimates
May 2017 State Occupational Employment and Wage Estimates
May 2017 Metropolitan and Nonmetropolitan Area Occupational Employment and Wage Estimates
May 2017 National Industry-Specific Occupational Employment and Wage Estimates
Last Modified Date: March 30, 2018