
An official website of the United States government
An official website of the United States government
The .gov means it's official.
Federal government websites often end in .gov or .mil. Before sharing sensitive information,
make sure you're on a federal government site.
The site is secure.
The
https:// ensures that you are connecting to the official website and that any
information you provide is encrypted and transmitted securely.
All other construction and related workers not listed separately, including segmental pavers who lay out, cut, and place segmental paving units.
Employment estimate and mean wage estimates for this occupation:
| Employment (1) | Employment RSE (3) |
Mean hourly wage |
Mean annual wage (2) |
Wage RSE (3) |
|---|---|---|---|---|
| 34,720 | 4.3 % | $20.30 | $42,220 | 1.9 % |
Percentile wage estimates for this occupation:
| Percentile | 10% | 25% | 50% (Median) |
75% | 90% |
|---|---|---|---|---|---|
| Hourly Wage | $12.24 | $14.70 | $18.29 | $23.80 | $31.03 |
| Annual Wage (2) | $25,460 | $30,570 | $38,040 | $49,510 | $64,550 |
Industries with the highest published employment and wages for this occupation are provided. For a list of all industries with employment in this occupation, see the Create Customized Tables function.
Industries with the highest levels of employment in this occupation:
| Industry | Employment (1) | Percent of industry employment | Hourly mean wage | Annual mean wage (2) |
|---|---|---|---|---|
| Local Government, excluding schools and hospitals (OES Designation) | 6,070 | 0.11 | $19.71 | $41,000 |
| Building Finishing Contractors | 5,130 | 0.65 | $19.26 | $40,070 |
| Other Specialty Trade Contractors | 4,260 | 0.65 | $18.05 | $37,550 |
| Foundation, Structure, and Building Exterior Contractors | 1,960 | 0.22 | $20.55 | $42,750 |
| Utility System Construction | 1,610 | 0.32 | $23.09 | $48,040 |
Industries with the highest concentration of employment in this occupation:
| Industry | Employment (1) | Percent of industry employment | Hourly mean wage | Annual mean wage (2) |
|---|---|---|---|---|
| Other Specialty Trade Contractors | 4,260 | 0.65 | $18.05 | $37,550 |
| Building Finishing Contractors | 5,130 | 0.65 | $19.26 | $40,070 |
| Other Textile Product Mills | 340 | 0.54 | $19.32 | $40,180 |
| Utility System Construction | 1,610 | 0.32 | $23.09 | $48,040 |
| Other Heavy and Civil Engineering Construction | 310 | 0.28 | $20.62 | $42,880 |
Top paying industries for this occupation:
| Industry | Employment (1) | Percent of industry employment | Hourly mean wage | Annual mean wage (2) |
|---|---|---|---|---|
| Natural Gas Distribution | 150 | 0.13 | $33.18 | $69,020 |
| Electric Power Generation, Transmission and Distribution | 70 | 0.02 | $32.04 | $66,640 |
| Nonresidential Building Construction | 1,270 | 0.16 | $31.86 | $66,270 |
| Telecommunications | 100 | 0.01 | $27.97 | $58,180 |
| Support Activities for Mining | (8) | (8) | $25.40 | $52,840 |
States and areas with the highest published employment, location quotients, and wages for this occupation are provided. For a list of all areas with employment in this occupation, see the Create Customized Tables function.
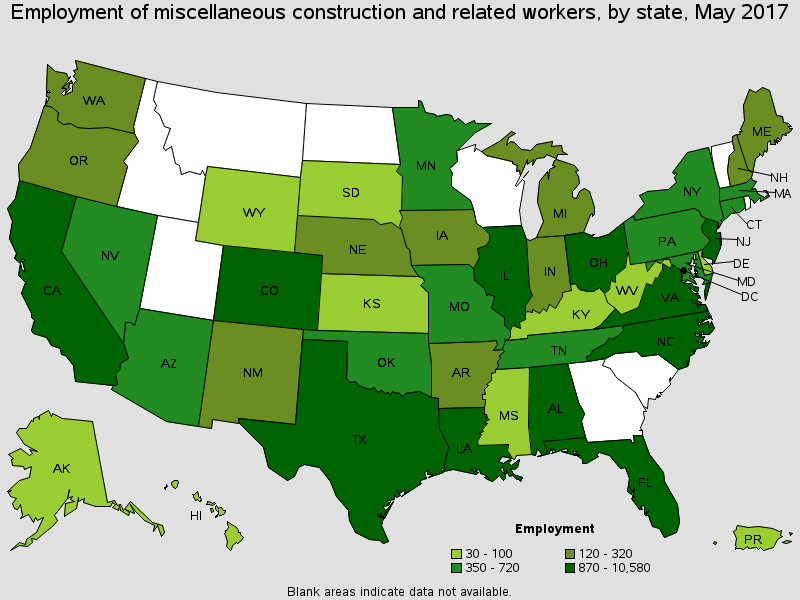
States with the highest employment level in this occupation:
| State | Employment (1) | Employment per thousand jobs | Location quotient (9) | Hourly mean wage | Annual mean wage (2) |
|---|---|---|---|---|---|
| Florida | 10,580 | 1.26 | 5.16 | $18.69 | $38,880 |
| California | 2,180 | 0.13 | 0.54 | $20.60 | $42,840 |
| Texas | 2,090 | 0.18 | 0.72 | $18.36 | $38,180 |
| North Carolina | 1,750 | 0.41 | 1.67 | $18.02 | $37,480 |
| New Jersey | 1,680 | 0.42 | 1.72 | $24.56 | $51,090 |
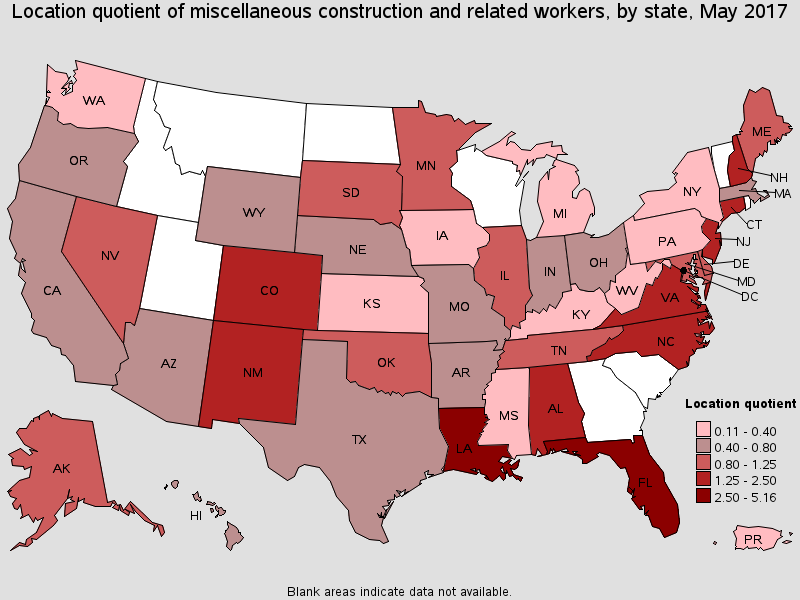
States with the highest concentration of jobs and location quotients in this occupation:
| State | Employment (1) | Employment per thousand jobs | Location quotient (9) | Hourly mean wage | Annual mean wage (2) |
|---|---|---|---|---|---|
| Florida | 10,580 | 1.26 | 5.16 | $18.69 | $38,880 |
| Louisiana | 1,610 | 0.85 | 3.48 | $20.81 | $43,280 |
| Alabama | 870 | 0.45 | 1.85 | $20.23 | $42,090 |
| New Jersey | 1,680 | 0.42 | 1.72 | $24.56 | $51,090 |
| Virginia | 1,540 | 0.41 | 1.67 | $21.59 | $44,920 |
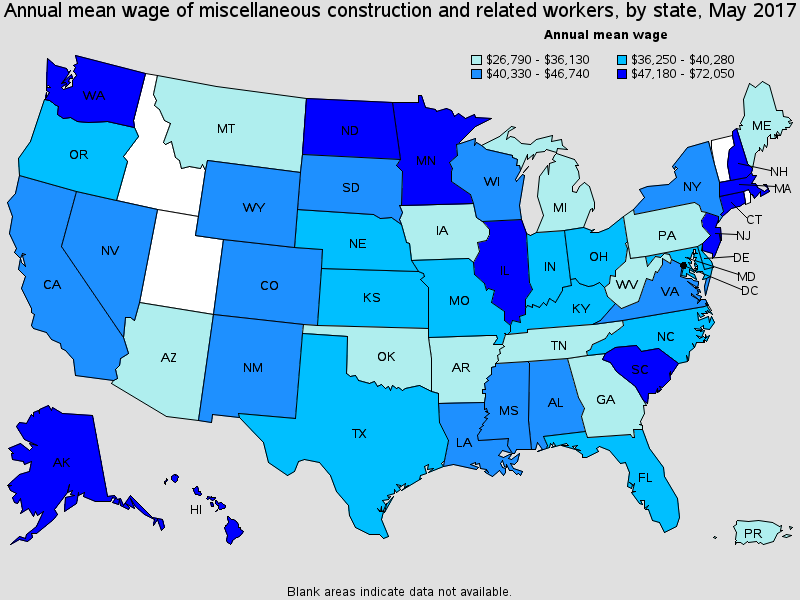
Top paying States for this occupation:
| State | Employment (1) | Employment per thousand jobs | Location quotient (9) | Hourly mean wage | Annual mean wage (2) |
|---|---|---|---|---|---|
| Illinois | 1,410 | 0.24 | 0.97 | $34.64 | $72,050 |
| Alaska | 90 | 0.29 | 1.20 | $32.13 | $66,830 |
| New Hampshire | 220 | 0.34 | 1.38 | $29.65 | $61,660 |
| Hawaii | 90 | 0.14 | 0.57 | $27.14 | $56,460 |
| District of Columbia | 60 | 0.08 | 0.33 | $27.05 | $56,260 |
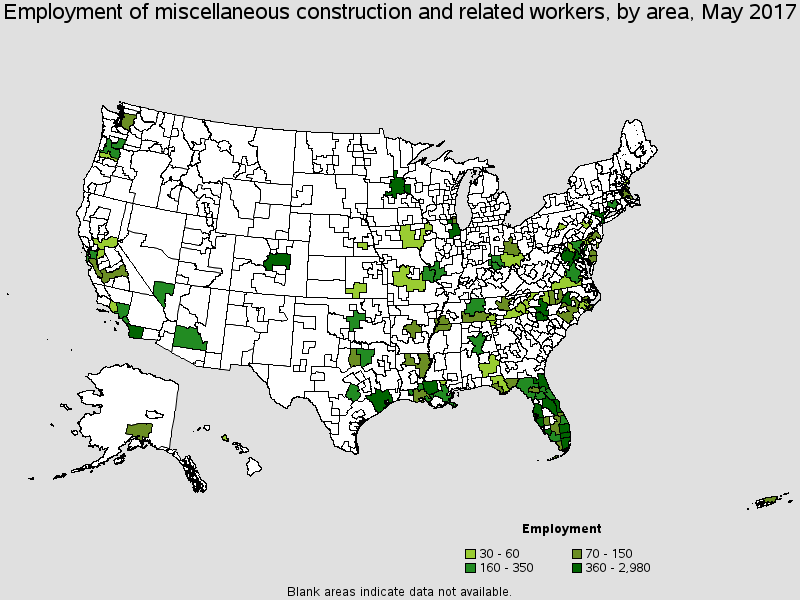
Metropolitan areas with the highest employment level in this occupation:
| Metropolitan area | Employment (1) | Employment per thousand jobs | Location quotient (9) | Hourly mean wage | Annual mean wage (2) |
|---|---|---|---|---|---|
| Orlando-Kissimmee-Sanford, FL | 1,570 | 1.30 | 5.32 | $18.24 | $37,930 |
| Miami-Miami Beach-Kendall, FL Metropolitan Division | 1,300 | 1.14 | 4.68 | $20.92 | $43,520 |
| Tampa-St. Petersburg-Clearwater, FL | 1,120 | 0.87 | 3.59 | $18.31 | $38,080 |
| Houston-The Woodlands-Sugar Land, TX | 1,030 | 0.35 | 1.44 | $19.13 | $39,800 |
| Chicago-Naperville-Arlington Heights, IL Metropolitan Division | 1,020 | 0.28 | 1.14 | $35.13 | $73,080 |
| New York-Jersey City-White Plains, NY-NJ Metropolitan Division | 970 | 0.15 | 0.60 | $30.01 | $62,430 |
| Fort Lauderdale-Pompano Beach-Deerfield Beach, FL Metropolitan Division | 950 | 1.16 | 4.78 | $18.57 | $38,620 |
| Denver-Aurora-Lakewood, CO | 770 | 0.53 | 2.19 | $19.57 | $40,710 |
| West Palm Beach-Boca Raton-Delray Beach, FL Metropolitan Division | 730 | 1.21 | 4.98 | $18.30 | $38,060 |
| Washington-Arlington-Alexandria, DC-VA-MD-WV Metropolitan Division | 560 | 0.22 | 0.91 | $22.30 | $46,390 |
Metropolitan areas with the highest concentration of jobs and location quotients in this occupation:
| Metropolitan area | Employment (1) | Employment per thousand jobs | Location quotient (9) | Hourly mean wage | Annual mean wage (2) |
|---|---|---|---|---|---|
| Ocala, FL | 240 | 2.41 | 9.91 | $15.60 | $32,460 |
| Naples-Immokalee-Marco Island, FL | 320 | 2.24 | 9.19 | $19.29 | $40,130 |
| Palm Bay-Melbourne-Titusville, FL | 430 | 2.07 | 8.51 | $20.05 | $41,690 |
| Port St. Lucie, FL | 280 | 2.00 | 8.23 | $19.29 | $40,120 |
| Cape Coral-Fort Myers, FL | 490 | 1.90 | 7.82 | $17.45 | $36,290 |
| Ocean City, NJ | 60 | 1.60 | 6.59 | $15.33 | $31,890 |
| Panama City, FL | 120 | 1.55 | 6.37 | $16.52 | $34,360 |
| Sebastian-Vero Beach, FL | 80 | 1.51 | 6.19 | $19.80 | $41,180 |
| North Port-Sarasota-Bradenton, FL | 420 | 1.47 | 6.02 | $21.63 | $44,990 |
| New Bern, NC | 60 | 1.37 | 5.63 | $16.39 | $34,100 |

Top paying metropolitan areas for this occupation:
| Metropolitan area | Employment (1) | Employment per thousand jobs | Location quotient (9) | Hourly mean wage | Annual mean wage (2) |
|---|---|---|---|---|---|
| Lake County-Kenosha County, IL-WI Metropolitan Division | 100 | 0.26 | 1.06 | $43.73 | $90,950 |
| Chicago-Naperville-Arlington Heights, IL Metropolitan Division | 1,020 | 0.28 | 1.14 | $35.13 | $73,080 |
| Anchorage, AK | 80 | 0.45 | 1.83 | $33.20 | $69,050 |
| Portsmouth, NH-ME | 50 | 0.55 | 2.24 | $31.30 | $65,100 |
| San Jose-Sunnyvale-Santa Clara, CA | 80 | 0.07 | 0.29 | $30.58 | $63,610 |
| Camden, NJ Metropolitan Division | 70 | 0.14 | 0.56 | $30.17 | $62,740 |
| New York-Jersey City-White Plains, NY-NJ Metropolitan Division | 970 | 0.15 | 0.60 | $30.01 | $62,430 |
| Minneapolis-St. Paul-Bloomington, MN-WI | 510 | 0.27 | 1.09 | $29.35 | $61,050 |
| Nashua, NH-MA NECTA Division | (8) | (8) | (8) | $26.56 | $55,250 |
| Seattle-Bellevue-Everett, WA Metropolitan Division | 80 | 0.05 | 0.21 | $26.12 | $54,330 |
Nonmetropolitan areas with the highest employment in this occupation:
| Nonmetropolitan area | Employment (1) | Employment per thousand jobs | Location quotient (9) | Hourly mean wage | Annual mean wage (2) |
|---|---|---|---|---|---|
| Southwest Louisiana nonmetropolitan area | 280 | 4.76 | 19.55 | $23.64 | $49,170 |
| Northeast Florida nonmetropolitan area | 160 | 1.85 | 7.58 | $20.70 | $43,060 |
| Southeast Coastal North Carolina nonmetropolitan area | 140 | 0.55 | 2.25 | $16.02 | $33,320 |
| South Central Tennessee nonmetropolitan area | 90 | 0.89 | 3.64 | $12.08 | $25,130 |
| South Florida nonmetropolitan area | 90 | 1.15 | 4.74 | $15.84 | $32,950 |
Nonmetropolitan areas with the highest concentration of jobs and location quotients in this occupation:
| Nonmetropolitan area | Employment (1) | Employment per thousand jobs | Location quotient (9) | Hourly mean wage | Annual mean wage (2) |
|---|---|---|---|---|---|
| Southwest Louisiana nonmetropolitan area | 280 | 4.76 | 19.55 | $23.64 | $49,170 |
| Washington Parish, Louisiana nonmetropolitan area | 40 | 3.68 | 15.13 | $14.94 | $31,080 |
| Northwest Florida nonmetropolitan area | 60 | 2.08 | 8.53 | $13.55 | $28,190 |
| Northeast Florida nonmetropolitan area | 160 | 1.85 | 7.58 | $20.70 | $43,060 |
| South Florida nonmetropolitan area | 90 | 1.15 | 4.74 | $15.84 | $32,950 |
Top paying nonmetropolitan areas for this occupation:
| Nonmetropolitan area | Employment (1) | Employment per thousand jobs | Location quotient (9) | Hourly mean wage | Annual mean wage (2) |
|---|---|---|---|---|---|
| Central New Hampshire nonmetropolitan area | (8) | (8) | (8) | $34.61 | $71,990 |
| Eastern New Mexico nonmetropolitan area | (8) | (8) | (8) | $26.33 | $54,760 |
| Southern Ohio non-metropolitan area | 30 | 0.20 | 0.83 | $25.88 | $53,830 |
| Northeast Louisiana nonmetropolitan area | 70 | 1.13 | 4.66 | $25.18 | $52,370 |
| Southwest Louisiana nonmetropolitan area | 280 | 4.76 | 19.55 | $23.64 | $49,170 |
These estimates are calculated with data collected from employers in all industry sectors, all metropolitan and nonmetropolitan areas, and all states and the District of Columbia. The top employment and wage figures are provided above. The complete list is available in the downloadable XLS files.
The percentile wage estimate is the value of a wage below which a certain percent of workers fall. The median wage is the 50th percentile wage estimate--50 percent of workers earn less than the median and 50 percent of workers earn more than the median. More about percentile wages.
(1) Estimates for detailed occupations do not sum to the totals because the totals include occupations not shown separately. Estimates do not include self-employed workers.
(2) Annual wages have been calculated by multiplying the hourly mean wage by a "year-round, full-time" hours figure of 2,080 hours; for those occupations where there is not an hourly wage published, the annual wage has been directly calculated from the reported survey data.
(3) The relative standard error (RSE) is a measure of the reliability of a survey statistic. The smaller the relative standard error, the more precise the estimate.
(8) Estimate not released.
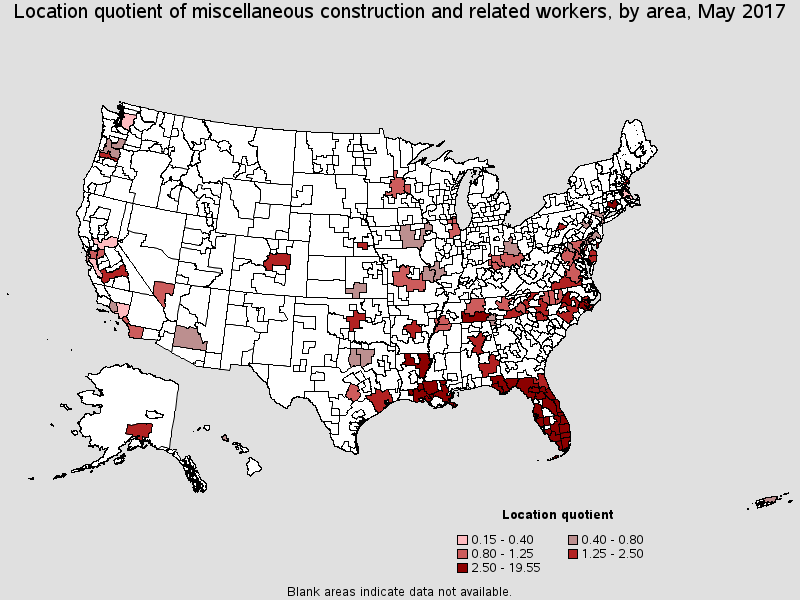
(9) The location quotient is the ratio of the area concentration of occupational employment to the national average concentration. A location quotient greater than one indicates the occupation has a higher share of employment than average, and a location quotient less than one indicates the occupation is less prevalent in the area than average.
Other OES estimates and related information:
May 2017 National Occupational Employment and Wage Estimates
May 2017 State Occupational Employment and Wage Estimates
May 2017 Metropolitan and Nonmetropolitan Area Occupational Employment and Wage Estimates
May 2017 National Industry-Specific Occupational Employment and Wage Estimates
Last Modified Date: March 30, 2018