
An official website of the United States government
An official website of the United States government
The .gov means it's official.
Federal government websites often end in .gov or .mil. Before sharing sensitive information,
make sure you're on a federal government site.
The site is secure.
The
https:// ensures that you are connecting to the official website and that any
information you provide is encrypted and transmitted securely.
Directly supervise and coordinate the activities of production and operating workers, such as inspectors, precision workers, machine setters and operators, assemblers, fabricators, and plant and system operators. Excludes team or work leaders.
Employment estimate and mean wage estimates for this occupation:
| Employment (1) | Employment RSE (3) |
Mean hourly wage |
Mean annual wage (2) |
Wage RSE (3) |
|---|---|---|---|---|
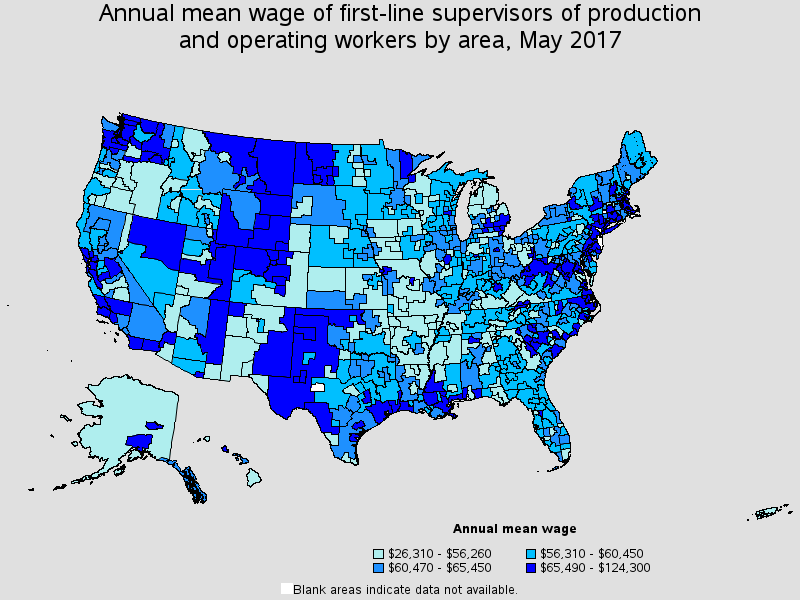
| 611,800 | 0.4 % | $30.13 | $62,660 | 0.2 % |
Percentile wage estimates for this occupation:
| Percentile | 10% | 25% | 50% (Median) |
75% | 90% |
|---|---|---|---|---|---|
| Hourly Wage | $16.84 | $21.59 | $28.31 | $36.71 | $46.82 |
| Annual Wage (2) | $35,020 | $44,910 | $58,870 | $76,370 | $97,380 |
Industries with the highest published employment and wages for this occupation are provided. For a list of all industries with employment in this occupation, see the Create Customized Tables function.
Industries with the highest levels of employment in this occupation:
| Industry | Employment (1) | Percent of industry employment | Hourly mean wage | Annual mean wage (2) |
|---|---|---|---|---|
| Plastics Product Manufacturing | 27,240 | 4.74 | $27.78 | $57,780 |
| Machinery Manufacturing (3331, 3332, 3334, and 3339 only) | 23,860 | 3.42 | $31.25 | $64,990 |
| Motor Vehicle Parts Manufacturing | 23,500 | 3.99 | $29.58 | $61,530 |
| Fabricated Metal Product Manufacturing (3323 and 3324 only) | 20,020 | 4.37 | $29.65 | $61,670 |
| Fabricated Metal Product Manufacturing (3321, 3322, 3325, 3326, and 3329 only) | 18,240 | 3.94 | $30.21 | $62,830 |
Industries with the highest concentration of employment in this occupation:
| Industry | Employment (1) | Percent of industry employment | Hourly mean wage | Annual mean wage (2) |
|---|---|---|---|---|
| Petroleum and Coal Products Manufacturing | 6,410 | 5.68 | $40.75 | $84,770 |
| Coating, Engraving, Heat Treating, and Allied Activities | 7,670 | 5.66 | $28.27 | $58,790 |
| Leather and Hide Tanning and Finishing | 210 | 5.63 | $29.20 | $60,740 |
| Textile and Fabric Finishing and Fabric Coating Mills | 1,510 | 5.12 | $26.38 | $54,860 |
| Alumina and Aluminum Production and Processing | 2,770 | 4.88 | $29.99 | $62,380 |
Top paying industries for this occupation:
| Industry | Employment (1) | Percent of industry employment | Hourly mean wage | Annual mean wage (2) |
|---|---|---|---|---|
| Natural Gas Distribution | 1,890 | 1.68 | $48.32 | $100,510 |
| Electric Power Generation, Transmission and Distribution | 8,610 | 2.21 | $44.49 | $92,530 |
| Oil and Gas Extraction | 1,300 | 0.96 | $43.89 | $91,280 |
| Other Pipeline Transportation | 270 | 3.31 | $43.02 | $89,490 |
| Pipeline Transportation of Crude Oil | 330 | 2.76 | $41.24 | $85,780 |
States and areas with the highest published employment, location quotients, and wages for this occupation are provided. For a list of all areas with employment in this occupation, see the Create Customized Tables function.
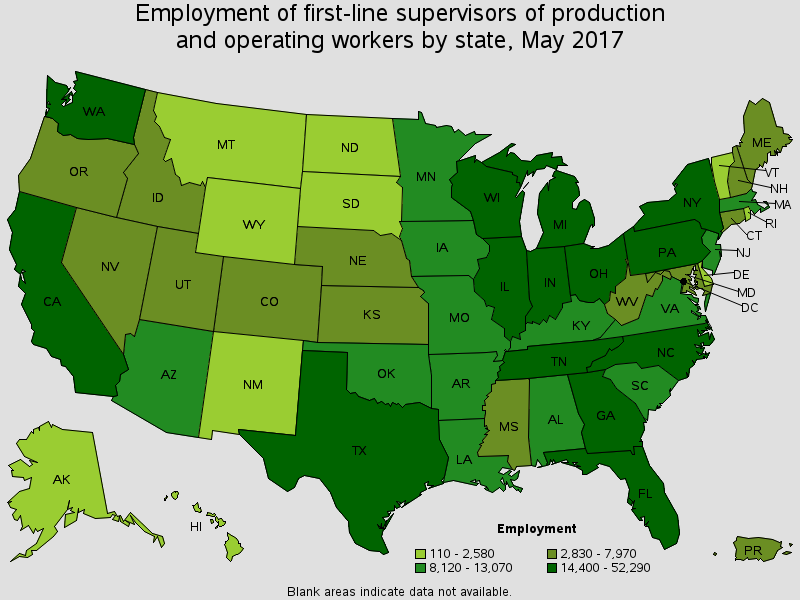
States with the highest employment level in this occupation:
| State | Employment (1) | Employment per thousand jobs | Location quotient (9) | Hourly mean wage | Annual mean wage (2) |
|---|---|---|---|---|---|
| California | 52,290 | 3.13 | 0.73 | $31.16 | $64,810 |
| Texas | 47,050 | 3.96 | 0.92 | $32.43 | $67,450 |
| Ohio | 31,050 | 5.78 | 1.35 | $29.49 | $61,330 |
| Michigan | 28,150 | 6.58 | 1.53 | $31.28 | $65,070 |
| Pennsylvania | 27,270 | 4.72 | 1.10 | $29.52 | $61,390 |
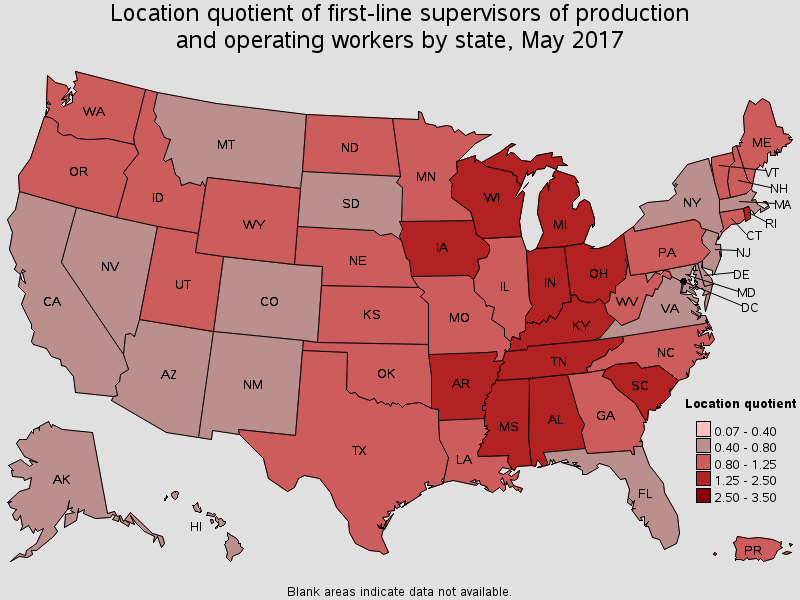
States with the highest concentration of jobs and location quotients in this occupation:
| State | Employment (1) | Employment per thousand jobs | Location quotient (9) | Hourly mean wage | Annual mean wage (2) |
|---|---|---|---|---|---|
| Wisconsin | 23,740 | 8.40 | 1.96 | $28.69 | $59,660 |
| Indiana | 25,330 | 8.39 | 1.96 | $28.09 | $58,420 |
| Arkansas | 8,320 | 6.93 | 1.61 | $25.41 | $52,840 |
| Alabama | 12,880 | 6.70 | 1.56 | $28.64 | $59,570 |
| Michigan | 28,150 | 6.58 | 1.53 | $31.28 | $65,070 |
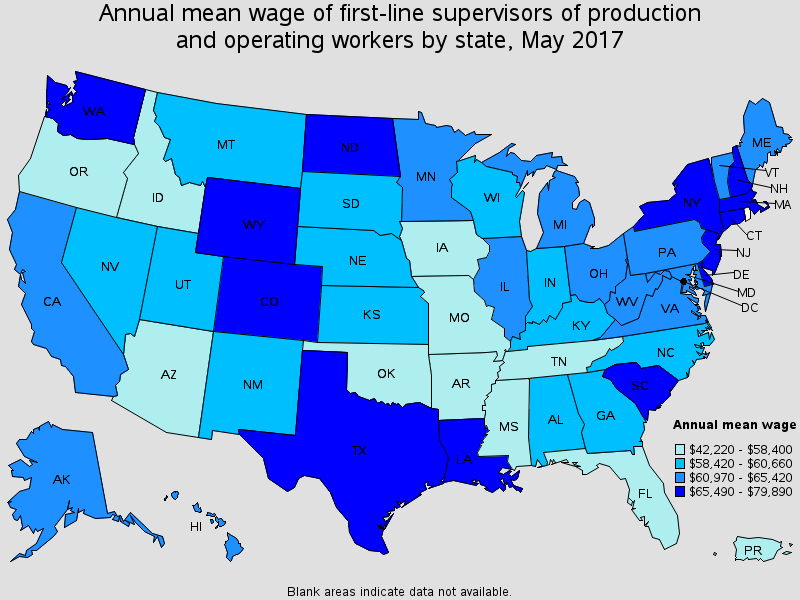
Top paying States for this occupation:
| State | Employment (1) | Employment per thousand jobs | Location quotient (9) | Hourly mean wage | Annual mean wage (2) |
|---|---|---|---|---|---|
| Wyoming | 1,170 | 4.36 | 1.02 | $38.41 | $79,890 |
| District of Columbia | 210 | 0.30 | 0.07 | $36.54 | $76,000 |
| Washington | 14,400 | 4.52 | 1.05 | $35.10 | $73,020 |
| Connecticut | 7,970 | 4.82 | 1.12 | $34.61 | $71,980 |
| Louisiana | 9,930 | 5.22 | 1.22 | $34.22 | $71,170 |
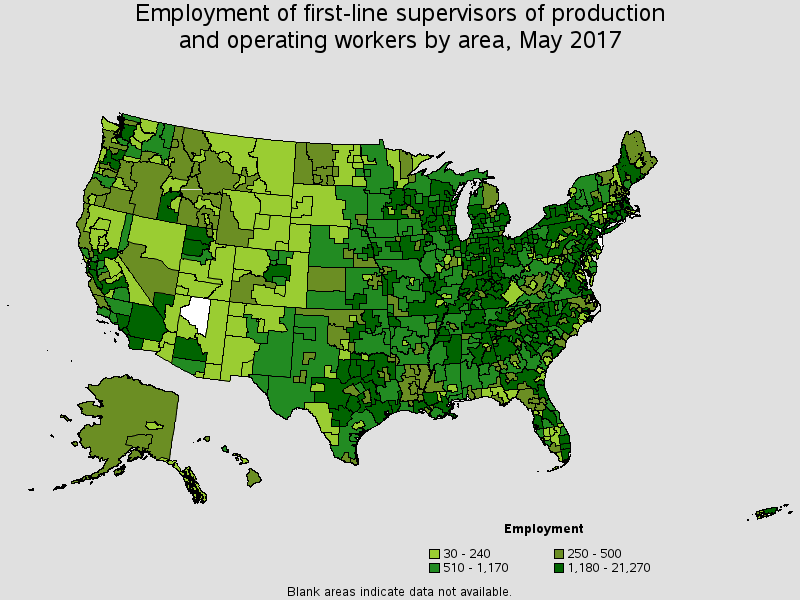
Metropolitan areas with the highest employment level in this occupation:
| Metropolitan area | Employment (1) | Employment per thousand jobs | Location quotient (9) | Hourly mean wage | Annual mean wage (2) |
|---|---|---|---|---|---|
| Los Angeles-Long Beach-Glendale, CA Metropolitan Division | 14,750 | 3.33 | 0.78 | $29.55 | $61,460 |
| Houston-The Woodlands-Sugar Land, TX | 13,100 | 4.47 | 1.04 | $35.94 | $74,760 |
| New York-Jersey City-White Plains, NY-NJ Metropolitan Division | 12,930 | 1.93 | 0.45 | $33.93 | $70,570 |
| Chicago-Naperville-Arlington Heights, IL Metropolitan Division | 12,880 | 3.52 | 0.82 | $29.40 | $61,150 |
| Atlanta-Sandy Springs-Roswell, GA | 9,740 | 3.72 | 0.87 | $28.80 | $59,900 |
| Dallas-Plano-Irving, TX Metropolitan Division | 8,600 | 3.45 | 0.80 | $30.51 | $63,450 |
| Warren-Troy-Farmington Hills, MI Metropolitan Division | 7,540 | 6.12 | 1.43 | $32.82 | $68,260 |
| Minneapolis-St. Paul-Bloomington, MN-WI | 7,450 | 3.86 | 0.90 | $31.26 | $65,030 |
| Seattle-Bellevue-Everett, WA Metropolitan Division | 6,960 | 4.23 | 0.98 | $37.62 | $78,250 |
| Phoenix-Mesa-Scottsdale, AZ | 6,870 | 3.47 | 0.81 | $27.91 | $58,050 |
Metropolitan areas with the highest concentration of jobs and location quotients in this occupation:
| Metropolitan area | Employment (1) | Employment per thousand jobs | Location quotient (9) | Hourly mean wage | Annual mean wage (2) |
|---|---|---|---|---|---|
| Elkhart-Goshen, IN | 2,400 | 18.87 | 4.40 | $29.17 | $60,670 |
| Dalton, GA | 1,180 | 17.98 | 4.19 | $27.85 | $57,930 |
| Columbus, IN | 860 | 17.49 | 4.08 | $28.51 | $59,300 |
| Racine, WI | 1,010 | 13.49 | 3.14 | $30.01 | $62,420 |
| Niles-Benton Harbor, MI | 840 | 13.31 | 3.10 | $30.82 | $64,110 |
| Oshkosh-Neenah, WI | 1,270 | 13.30 | 3.10 | $30.24 | $62,900 |
| Sheboygan, WI | 730 | 12.66 | 2.95 | $28.86 | $60,040 |
| Hickory-Lenoir-Morganton, NC | 1,930 | 12.56 | 2.93 | $26.23 | $54,560 |
| Lafayette-West Lafayette, IN | 1,090 | 11.82 | 2.75 | $28.54 | $59,360 |
| Wausau, WI | 830 | 11.81 | 2.75 | $26.51 | $55,140 |
Top paying metropolitan areas for this occupation:
| Metropolitan area | Employment (1) | Employment per thousand jobs | Location quotient (9) | Hourly mean wage | Annual mean wage (2) |
|---|---|---|---|---|---|
| Beaumont-Port Arthur, TX | 1,590 | 9.92 | 2.31 | $47.65 | $99,110 |
| Baton Rouge, LA | 2,430 | 6.20 | 1.44 | $44.74 | $93,050 |
| Norwich-New London-Westerly, CT-RI | 760 | 5.96 | 1.39 | $42.83 | $89,080 |
| San Rafael, CA Metropolitan Division | 240 | 2.05 | 0.48 | $41.29 | $85,880 |
| Midland, TX | 350 | 4.00 | 0.93 | $39.70 | $82,570 |
| Fairbanks, AK | 60 | 1.73 | 0.40 | $39.11 | $81,350 |
| Mount Vernon-Anacortes, WA | 350 | 7.56 | 1.76 | $38.66 | $80,410 |
| Bremerton-Silverdale, WA | 440 | 5.09 | 1.19 | $38.66 | $80,410 |
| Pueblo, CO | 180 | 3.02 | 0.70 | $38.60 | $80,290 |
| Corpus Christi, TX | 900 | 4.76 | 1.11 | $38.11 | $79,260 |
Nonmetropolitan areas with the highest employment in this occupation:
| Nonmetropolitan area | Employment (1) | Employment per thousand jobs | Location quotient (9) | Hourly mean wage | Annual mean wage (2) |
|---|---|---|---|---|---|
| Southern Indiana nonmetropolitan area | 3,760 | 20.06 | 4.67 | $27.08 | $56,340 |
| North Northeastern Ohio non-metropolitan area (non-contiguous) | 3,360 | 10.12 | 2.36 | $26.59 | $55,320 |
| Northern Indiana nonmetropolitan area | 3,280 | 15.20 | 3.54 | $25.77 | $53,610 |
| West Northwestern Ohio nonmetropolitan area | 3,150 | 12.45 | 2.90 | $29.36 | $61,070 |
| South Central Wisconsin nonmetropolitan area | 2,520 | 12.13 | 2.83 | $27.43 | $57,050 |
Nonmetropolitan areas with the highest concentration of jobs and location quotients in this occupation:
| Nonmetropolitan area | Employment (1) | Employment per thousand jobs | Location quotient (9) | Hourly mean wage | Annual mean wage (2) |
|---|---|---|---|---|---|
| Southern Indiana nonmetropolitan area | 3,760 | 20.06 | 4.67 | $27.08 | $56,340 |
| Northern Indiana nonmetropolitan area | 3,280 | 15.20 | 3.54 | $25.77 | $53,610 |
| East Arkansas nonmetropolitan area | 950 | 13.96 | 3.25 | $24.75 | $51,470 |
| Northeast Alabama nonmetropolitan area | 1,970 | 13.61 | 3.17 | $26.18 | $54,450 |
| West Northwestern Ohio nonmetropolitan area | 3,150 | 12.45 | 2.90 | $29.36 | $61,070 |
Top paying nonmetropolitan areas for this occupation:
| Nonmetropolitan area | Employment (1) | Employment per thousand jobs | Location quotient (9) | Hourly mean wage | Annual mean wage (2) |
|---|---|---|---|---|---|
| Los Alamos County, New Mexico nonmetropolitan area | 60 | 3.81 | 0.89 | $59.76 | $124,300 |
| Southwest Wyoming nonmetropolitan area | 370 | 6.13 | 1.43 | $44.94 | $93,480 |
| East Montana nonmetropolitan area | 120 | 3.67 | 0.86 | $43.97 | $91,470 |
| Eastern Utah nonmetropolitan area | 170 | 4.14 | 0.96 | $43.83 | $91,160 |
| Far West North Dakota nonmetropolitan area | 260 | 4.26 | 0.99 | $42.03 | $87,430 |
These estimates are calculated with data collected from employers in all industry sectors, all metropolitan and nonmetropolitan areas, and all states and the District of Columbia. The top employment and wage figures are provided above. The complete list is available in the downloadable XLS files.
The percentile wage estimate is the value of a wage below which a certain percent of workers fall. The median wage is the 50th percentile wage estimate--50 percent of workers earn less than the median and 50 percent of workers earn more than the median. More about percentile wages.
(1) Estimates for detailed occupations do not sum to the totals because the totals include occupations not shown separately. Estimates do not include self-employed workers.
(2) Annual wages have been calculated by multiplying the hourly mean wage by a "year-round, full-time" hours figure of 2,080 hours; for those occupations where there is not an hourly wage published, the annual wage has been directly calculated from the reported survey data.
(3) The relative standard error (RSE) is a measure of the reliability of a survey statistic. The smaller the relative standard error, the more precise the estimate.
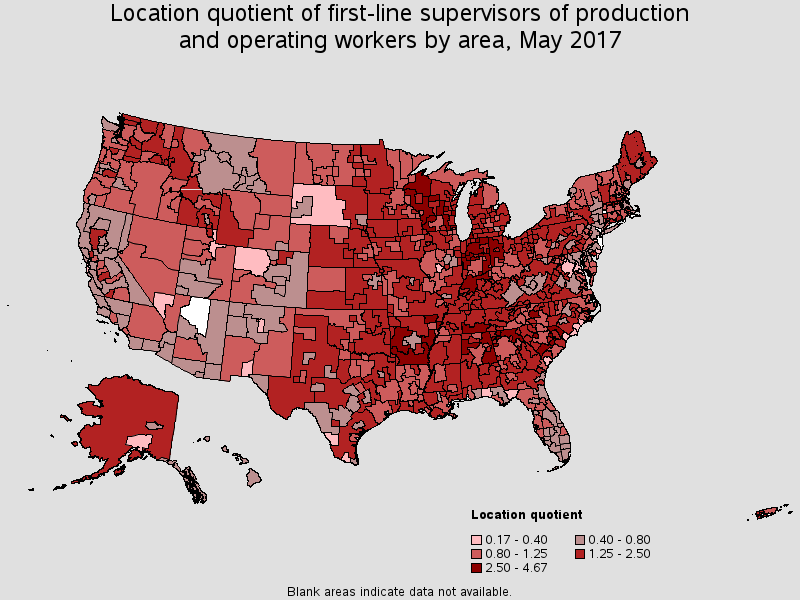
(9) The location quotient is the ratio of the area concentration of occupational employment to the national average concentration. A location quotient greater than one indicates the occupation has a higher share of employment than average, and a location quotient less than one indicates the occupation is less prevalent in the area than average.
Other OES estimates and related information:
May 2017 National Occupational Employment and Wage Estimates
May 2017 State Occupational Employment and Wage Estimates
May 2017 Metropolitan and Nonmetropolitan Area Occupational Employment and Wage Estimates
May 2017 National Industry-Specific Occupational Employment and Wage Estimates
Last Modified Date: March 30, 2018