
An official website of the United States government
An official website of the United States government
The .gov means it's official.
Federal government websites often end in .gov or .mil. Before sharing sensitive information,
make sure you're on a federal government site.
The site is secure.
The
https:// ensures that you are connecting to the official website and that any
information you provide is encrypted and transmitted securely.
Analyze and coordinate the logistical functions of a firm or organization. Responsible for the entire life cycle of a product, including acquisition, distribution, internal allocation, delivery, and final disposal of resources. Excludes "Transportation, Storage, and Distribution Managers" (11-3071).
Employment estimate and mean wage estimates for this occupation:
| Employment (1) | Employment RSE (3) |
Mean hourly wage |
Mean annual wage (2) |
Wage RSE (3) |
|---|---|---|---|---|
| 169,820 | 1.1 % | $37.85 | $78,730 | 0.4 % |
Percentile wage estimates for this occupation:
| Percentile | 10% | 25% | 50% (Median) |
75% | 90% |
|---|---|---|---|---|---|
| Hourly Wage | $21.36 | $27.62 | $35.86 | $46.15 | $57.67 |
| Annual Wage (2) | $44,440 | $57,450 | $74,600 | $95,980 | $119,950 |
Industries with the highest published employment and wages for this occupation are provided. For a list of all industries with employment in this occupation, see the Create Customized Tables function.
Industries with the highest levels of employment in this occupation:
| Industry | Employment (1) | Percent of industry employment | Hourly mean wage | Annual mean wage (2) |
|---|---|---|---|---|
| Federal Executive Branch (OES Designation) | 28,110 | 1.40 | $42.49 | $88,370 |
| Management of Companies and Enterprises | 18,160 | 0.77 | $38.03 | $79,100 |
| Management, Scientific, and Technical Consulting Services | 13,360 | 0.93 | $36.03 | $74,940 |
| Aerospace Product and Parts Manufacturing | 8,940 | 1.84 | $42.76 | $88,940 |
| Computer Systems Design and Related Services | 5,530 | 0.26 | $38.08 | $79,210 |
Industries with the highest concentration of employment in this occupation:
| Industry | Employment (1) | Percent of industry employment | Hourly mean wage | Annual mean wage (2) |
|---|---|---|---|---|
| Freight Transportation Arrangement | 4,290 | 1.93 | $32.31 | $67,210 |
| Aerospace Product and Parts Manufacturing | 8,940 | 1.84 | $42.76 | $88,940 |
| Federal Executive Branch (OES Designation) | 28,110 | 1.40 | $42.49 | $88,370 |
| Pipeline Transportation of Crude Oil | 150 | 1.38 | $47.66 | $99,140 |
| Management, Scientific, and Technical Consulting Services | 13,360 | 0.93 | $36.03 | $74,940 |
Top paying industries for this occupation:
| Industry | Employment (1) | Percent of industry employment | Hourly mean wage | Annual mean wage (2) |
|---|---|---|---|---|
| Agencies, Brokerages, and Other Insurance Related Activities | (8) | (8) | $55.15 | $114,710 |
| Food and Beverage Stores (4451 and 4452 only) | 140 | (7) | $54.17 | $112,680 |
| Securities, Commodity Contracts, and Other Financial Investments and Related Activities | 140 | 0.02 | $54.15 | $112,630 |
| Oil and Gas Extraction | 340 | 0.24 | $49.35 | $102,640 |
| Software Publishers | 580 | 0.15 | $48.69 | $101,280 |
States and areas with the highest published employment, location quotients, and wages for this occupation are provided. For a list of all areas with employment in this occupation, see the Create Customized Tables function.
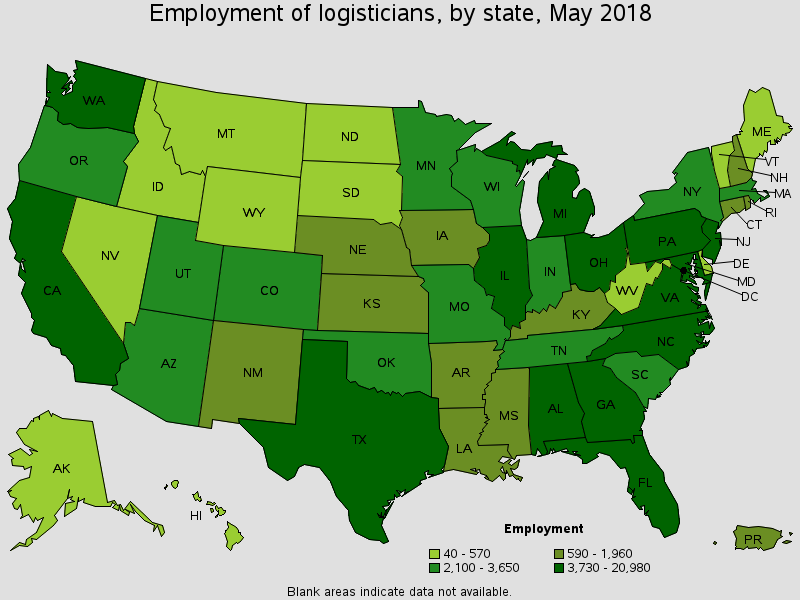
States with the highest employment level in this occupation:
| State | Employment (1) | Employment per thousand jobs | Location quotient (9) | Hourly mean wage | Annual mean wage (2) |
|---|---|---|---|---|---|
| California | 20,980 | 1.23 | 1.05 | $40.51 | $84,260 |
| Texas | 14,340 | 1.18 | 1.01 | $41.59 | $86,500 |
| Illinois | 8,170 | 1.36 | 1.16 | $32.45 | $67,490 |
| Michigan | 8,120 | 1.88 | 1.60 | $38.53 | $80,150 |
| Virginia | 7,810 | 2.04 | 1.74 | $41.45 | $86,230 |
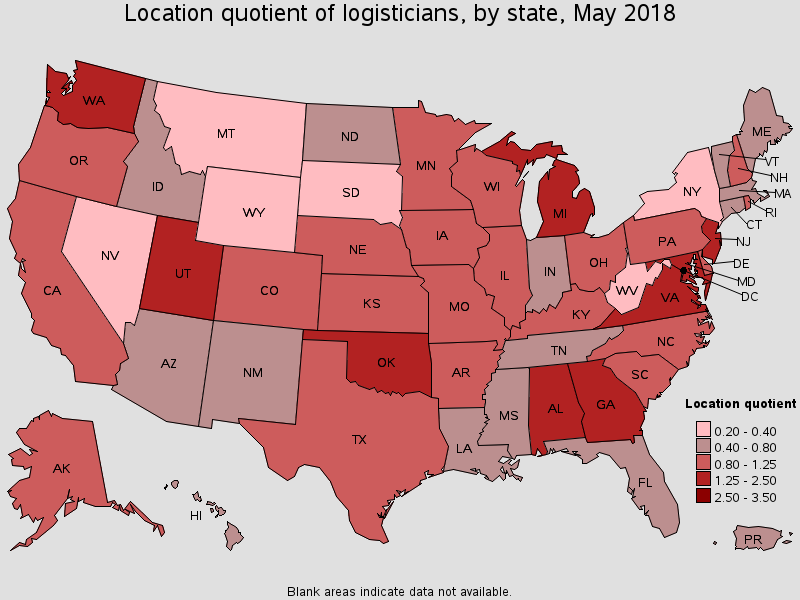
States with the highest concentration of jobs and location quotients in this occupation:
| State | Employment (1) | Employment per thousand jobs | Location quotient (9) | Hourly mean wage | Annual mean wage (2) |
|---|---|---|---|---|---|
| Virginia | 7,810 | 2.04 | 1.74 | $41.45 | $86,230 |
| Maryland | 5,440 | 2.03 | 1.73 | $44.09 | $91,710 |
| Washington | 6,270 | 1.92 | 1.64 | $43.38 | $90,240 |
| Alabama | 3,730 | 1.92 | 1.63 | $42.11 | $87,600 |
| Michigan | 8,120 | 1.88 | 1.60 | $38.53 | $80,150 |
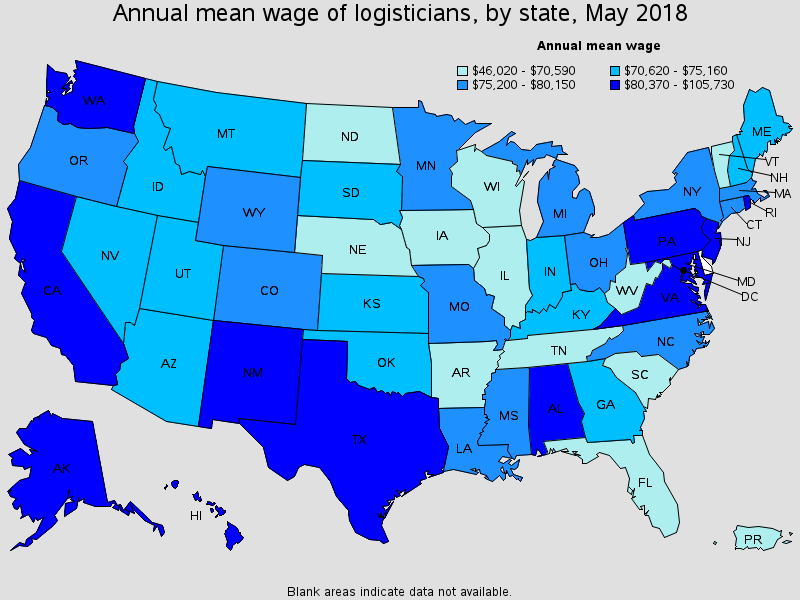
Top paying States for this occupation:
| State | Employment (1) | Employment per thousand jobs | Location quotient (9) | Hourly mean wage | Annual mean wage (2) |
|---|---|---|---|---|---|
| Rhode Island | 600 | 1.24 | 1.06 | $50.83 | $105,730 |
| District of Columbia | 1,210 | 1.69 | 1.44 | $45.67 | $95,000 |
| Maryland | 5,440 | 2.03 | 1.73 | $44.09 | $91,710 |
| Washington | 6,270 | 1.92 | 1.64 | $43.38 | $90,240 |
| Alabama | 3,730 | 1.92 | 1.63 | $42.11 | $87,600 |
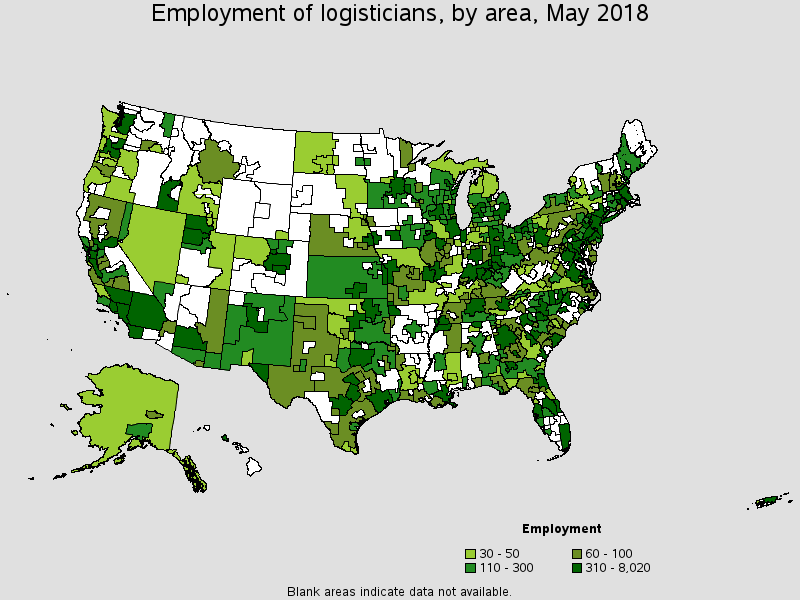
Metropolitan areas with the highest employment level in this occupation:
| Metropolitan area | Employment (1) | Employment per thousand jobs | Location quotient (9) | Hourly mean wage | Annual mean wage (2) |
|---|---|---|---|---|---|
| New York-Newark-Jersey City, NY-NJ-PA | 8,020 | 0.84 | 0.72 | $40.17 | $83,550 |
| Los Angeles-Long Beach-Anaheim, CA | 7,960 | 1.30 | 1.11 | $40.38 | $83,980 |
| Washington-Arlington-Alexandria, DC-VA-MD-WV | 6,640 | 2.12 | 1.80 | $45.13 | $93,860 |
| Chicago-Naperville-Elgin, IL-IN-WI | 6,120 | 1.32 | 1.12 | $31.15 | $64,780 |
| Seattle-Tacoma-Bellevue, WA | 5,380 | 2.71 | 2.31 | (8) | (8) |
| Detroit-Warren-Dearborn, MI | 4,740 | 2.40 | 2.05 | $42.04 | $87,440 |
| Dallas-Fort Worth-Arlington, TX | 4,670 | 1.31 | 1.11 | $39.22 | $81,580 |
| Philadelphia-Camden-Wilmington, PA-NJ-DE-MD | 4,520 | 1.59 | 1.35 | $40.03 | $83,270 |
| Houston-The Woodlands-Sugar Land, TX | 4,240 | 1.42 | 1.21 | $47.67 | $99,160 |
| Atlanta-Sandy Springs-Roswell, GA | 3,890 | 1.45 | 1.24 | $32.10 | $66,760 |
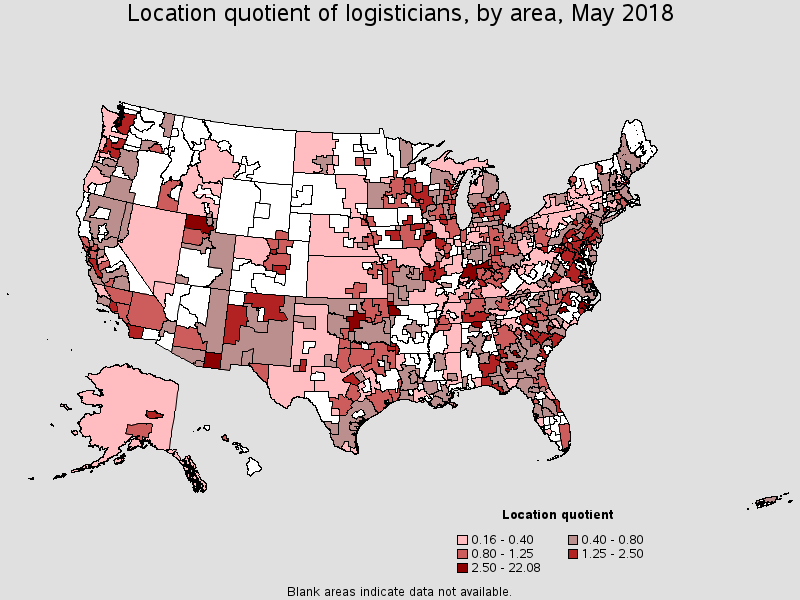
Metropolitan areas with the highest concentration of jobs and location quotients in this occupation:
| Metropolitan area | Employment (1) | Employment per thousand jobs | Location quotient (9) | Hourly mean wage | Annual mean wage (2) |
|---|---|---|---|---|---|
| California-Lexington Park, MD | 1,210 | 25.90 | 22.08 | $51.44 | $107,000 |
| Warner Robins, GA | 1,330 | 18.49 | 15.76 | $38.07 | $79,190 |
| Midland, MI | 420 | 12.03 | 10.26 | $39.87 | $82,920 |
| Huntsville, AL | 2,640 | 11.66 | 9.94 | $45.93 | $95,530 |
| New Bern, NC | 440 | 10.06 | 8.57 | $37.26 | $77,510 |
| Albany, GA | 350 | 5.78 | 4.92 | $37.30 | $77,590 |
| Ogden-Clearfield, UT | 1,390 | 5.46 | 4.66 | $36.84 | $76,630 |
| Fayetteville-Springdale-Rogers, AR-MO | 1,110 | 4.52 | 3.85 | $34.24 | $71,210 |
| Sierra Vista-Douglas, AZ | 120 | 3.73 | 3.18 | $41.60 | $86,530 |
| Bremerton-Silverdale, WA | 310 | 3.45 | 2.94 | $39.12 | $81,370 |
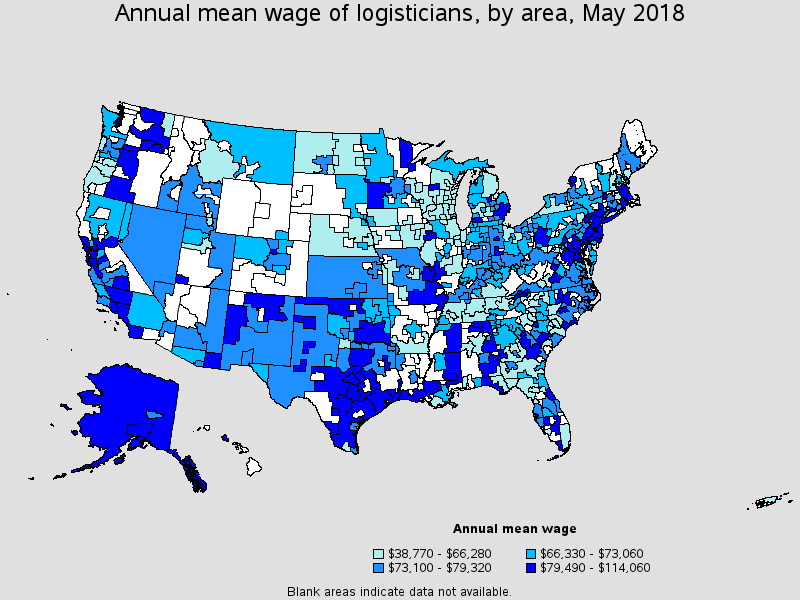
Top paying metropolitan areas for this occupation:
| Metropolitan area | Employment (1) | Employment per thousand jobs | Location quotient (9) | Hourly mean wage | Annual mean wage (2) |
|---|---|---|---|---|---|
| Lake Charles, LA | 90 | 0.74 | 0.63 | $54.84 | $114,060 |
| California-Lexington Park, MD | 1,210 | 25.90 | 22.08 | $51.44 | $107,000 |
| Providence-Warwick, RI-MA | 650 | 1.12 | 0.96 | $49.62 | $103,210 |
| Lima, OH | 70 | 1.37 | 1.16 | $48.87 | $101,640 |
| Houston-The Woodlands-Sugar Land, TX | 4,240 | 1.42 | 1.21 | $47.67 | $99,160 |
| Waco, TX | 80 | 0.68 | 0.58 | $47.30 | $98,380 |
| San Jose-Sunnyvale-Santa Clara, CA | 1,970 | 1.76 | 1.50 | $47.06 | $97,890 |
| Beaumont-Port Arthur, TX | 170 | 1.09 | 0.93 | $46.20 | $96,100 |
| Huntsville, AL | 2,640 | 11.66 | 9.94 | $45.93 | $95,530 |
| Washington-Arlington-Alexandria, DC-VA-MD-WV | 6,640 | 2.12 | 1.80 | $45.13 | $93,860 |
Nonmetropolitan areas with the highest employment in this occupation:
| Nonmetropolitan area | Employment (1) | Employment per thousand jobs | Location quotient (9) | Hourly mean wage | Annual mean wage (2) |
|---|---|---|---|---|---|
| Southern Indiana nonmetropolitan area | 580 | 3.08 | 2.63 | $32.09 | $66,750 |
| West Northwestern Ohio nonmetropolitan area | 370 | 1.44 | 1.23 | $37.36 | $77,700 |
| North Texas Region of Texas nonmetropolitan area | 290 | 1.07 | 0.91 | $37.26 | $77,490 |
| Southeast Iowa nonmetropolitan area | 250 | 1.09 | 0.93 | $31.65 | $65,820 |
| Western Wisconsin nonmetropolitan area | 250 | 1.75 | 1.49 | $30.42 | $63,280 |
Nonmetropolitan areas with the highest concentration of jobs and location quotients in this occupation:
| Nonmetropolitan area | Employment (1) | Employment per thousand jobs | Location quotient (9) | Hourly mean wage | Annual mean wage (2) |
|---|---|---|---|---|---|
| Southern Indiana nonmetropolitan area | 580 | 3.08 | 2.63 | $32.09 | $66,750 |
| Lower Savannah South Carolina nonmetropolitan area | 100 | 1.94 | 1.65 | $38.87 | $80,840 |
| Southeast Alabama nonmetropolitan area | 150 | 1.83 | 1.56 | $39.70 | $82,570 |
| Western Wisconsin nonmetropolitan area | 250 | 1.75 | 1.49 | $30.42 | $63,280 |
| Northern New Mexico nonmetropolitan area | 140 | 1.74 | 1.48 | $44.54 | $92,650 |
Top paying nonmetropolitan areas for this occupation:
| Nonmetropolitan area | Employment (1) | Employment per thousand jobs | Location quotient (9) | Hourly mean wage | Annual mean wage (2) |
|---|---|---|---|---|---|
| South Florida nonmetropolitan area | (8) | (8) | (8) | $48.68 | $101,260 |
| Northern New Mexico nonmetropolitan area | 140 | 1.74 | 1.48 | $44.54 | $92,650 |
| Alaska nonmetropolitan area | 50 | 0.46 | 0.39 | $43.19 | $89,840 |
| Southeast Oklahoma nonmetropolitan area | 110 | 0.67 | 0.57 | $42.22 | $87,810 |
| Northeast Mississippi nonmetropolitan area | 80 | 0.33 | 0.28 | $42.01 | $87,380 |
These estimates are calculated with data collected from employers in all industry sectors, all metropolitan and nonmetropolitan areas, and all states and the District of Columbia. The top employment and wage figures are provided above. The complete list is available in the downloadable XLS files.
The percentile wage estimate is the value of a wage below which a certain percent of workers fall. The median wage is the 50th percentile wage estimate--50 percent of workers earn less than the median and 50 percent of workers earn more than the median. More about percentile wages.
(1) Estimates for detailed occupations do not sum to the totals because the totals include occupations not shown separately. Estimates do not include self-employed workers.
(2) Annual wages have been calculated by multiplying the hourly mean wage by a "year-round, full-time" hours figure of 2,080 hours; for those occupations where there is not an hourly wage published, the annual wage has been directly calculated from the reported survey data.
(3) The relative standard error (RSE) is a measure of the reliability of a survey statistic. The smaller the relative standard error, the more precise the estimate.
(7) The value is less than .005 percent of industry employment.
(8) Estimate not released.
(9) The location quotient is the ratio of the area concentration of occupational employment to the national average concentration. A location quotient greater than one indicates the occupation has a higher share of employment than average, and a location quotient less than one indicates the occupation is less prevalent in the area than average.
Other OES estimates and related information:
May 2018 National Occupational Employment and Wage Estimates
May 2018 State Occupational Employment and Wage Estimates
May 2018 Metropolitan and Nonmetropolitan Area Occupational Employment and Wage Estimates
May 2018 National Industry-Specific Occupational Employment and Wage Estimates
Last Modified Date: March 29, 2019