
An official website of the United States government
An official website of the United States government
The .gov means it's official.
Federal government websites often end in .gov or .mil. Before sharing sensitive information,
make sure you're on a federal government site.
The site is secure.
The
https:// ensures that you are connecting to the official website and that any
information you provide is encrypted and transmitted securely.
Teach or instruct vocational or occupational subjects at the postsecondary level (but at less than the baccalaureate) to students who have graduated or left high school. Includes correspondence school instructors; industrial, commercial, and government training instructors; and adult education teachers and instructors who prepare persons to operate industrial machinery and equipment and transportation and communications equipment. Teaching may take place in public or private schools whose primary business is education or in a school associated with an organization whose primary business is other than education.
Employment estimate and mean wage estimates for this occupation:
| Employment (1) | Employment RSE (3) |
Mean hourly wage |
Mean annual wage (2) |
Wage RSE (3) |
|---|---|---|---|---|
| 110,400 | 1.7 % | $28.14 | $58,520 | 0.7 % |
Percentile wage estimates for this occupation:
| Percentile | 10% | 25% | 50% (Median) |
75% | 90% |
|---|---|---|---|---|---|
| Hourly Wage | $15.64 | $19.66 | $25.54 | $33.82 | $45.24 |
| Annual Wage (2) | $32,520 | $40,880 | $53,120 | $70,340 | $94,100 |
Industries with the highest published employment and wages for this occupation are provided. For a list of all industries with employment in this occupation, see the Create Customized Tables function.
Industries with the highest levels of employment in this occupation:
| Industry | Employment (1) | Percent of industry employment | Hourly mean wage | Annual mean wage (2) |
|---|---|---|---|---|
| Technical and Trade Schools | 43,250 | 32.10 | $26.78 | $55,710 |
| Junior Colleges | 42,390 | 5.88 | $29.54 | $61,450 |
| Colleges, Universities, and Professional Schools | 8,760 | 0.29 | $29.80 | $61,980 |
| State Government, excluding schools and hospitals (OES Designation) | 4,100 | 0.19 | $26.13 | $54,360 |
| Business Schools and Computer and Management Training | 3,540 | 5.03 | $27.89 | $58,020 |
Industries with the highest concentration of employment in this occupation:
| Industry | Employment (1) | Percent of industry employment | Hourly mean wage | Annual mean wage (2) |
|---|---|---|---|---|
| Technical and Trade Schools | 43,250 | 32.10 | $26.78 | $55,710 |
| Junior Colleges | 42,390 | 5.88 | $29.54 | $61,450 |
| Business Schools and Computer and Management Training | 3,540 | 5.03 | $27.89 | $58,020 |
| Educational Support Services | 1,570 | 0.85 | $27.28 | $56,750 |
| Other Schools and Instruction | 2,170 | 0.48 | $26.16 | $54,420 |
Top paying industries for this occupation:
| Industry | Employment (1) | Percent of industry employment | Hourly mean wage | Annual mean wage (2) |
|---|---|---|---|---|
| Business, Professional, Labor, Political, and Similar Organizations | 490 | 0.11 | $46.65 | $97,040 |
| Architectural, Engineering, and Related Services | 80 | 0.01 | $36.41 | $75,730 |
| Management of Companies and Enterprises | 50 | (7) | $32.36 | $67,300 |
| Grantmaking and Giving Services | 50 | 0.03 | $30.35 | $63,120 |
| Management, Scientific, and Technical Consulting Services | (8) | (8) | $30.02 | $62,430 |
States and areas with the highest published employment, location quotients, and wages for this occupation are provided. For a list of all areas with employment in this occupation, see the Create Customized Tables function.
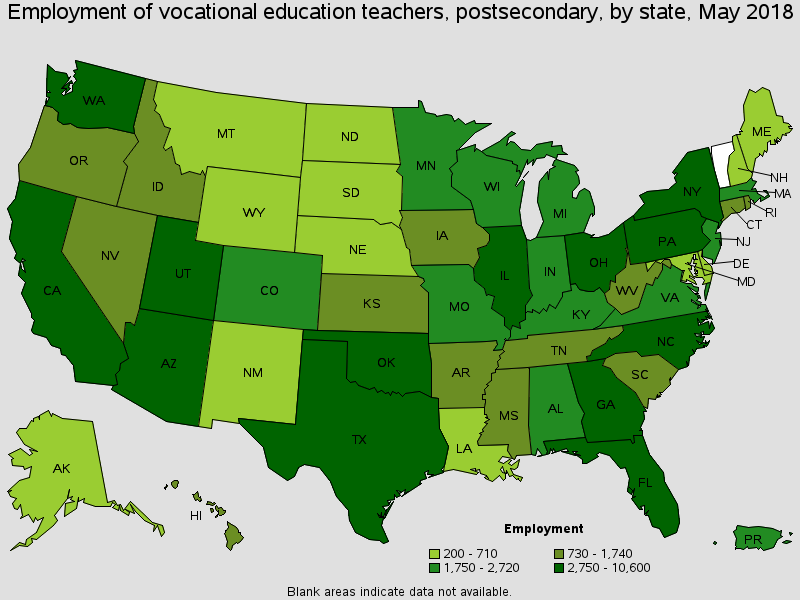
States with the highest employment level in this occupation:
| State | Employment (1) | Employment per thousand jobs | Location quotient (9) | Hourly mean wage | Annual mean wage (2) |
|---|---|---|---|---|---|
| Texas | 10,600 | 0.88 | 1.15 | $27.58 | $57,360 |
| California | 9,420 | 0.55 | 0.73 | $34.27 | $71,280 |
| North Carolina | 7,380 | 1.68 | 2.21 | $25.96 | $54,000 |
| Florida | 6,040 | 0.70 | 0.92 | $27.76 | $57,730 |
| Pennsylvania | 4,950 | 0.85 | 1.11 | $27.62 | $57,460 |
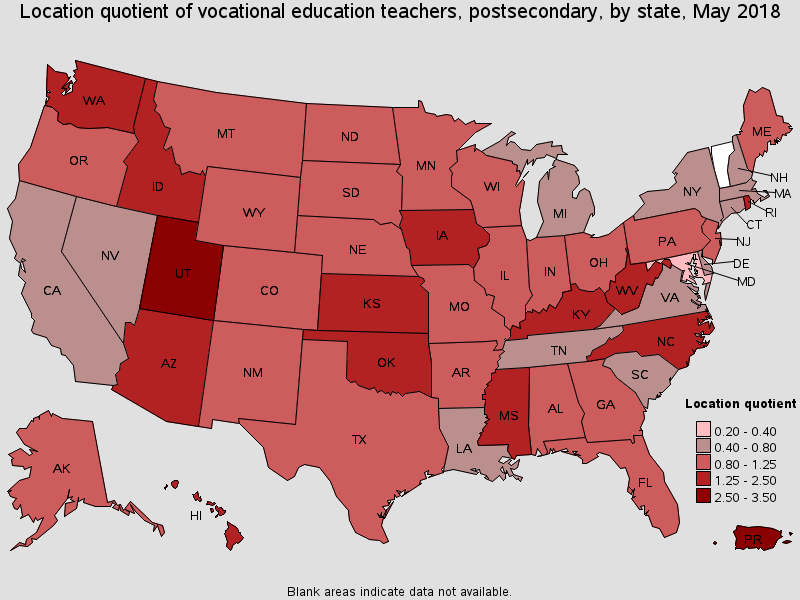
States with the highest concentration of jobs and location quotients in this occupation:
| State | Employment (1) | Employment per thousand jobs | Location quotient (9) | Hourly mean wage | Annual mean wage (2) |
|---|---|---|---|---|---|
| Utah | 2,870 | 1.97 | 2.58 | $25.26 | $52,530 |
| Oklahoma | 2,750 | 1.72 | 2.26 | $26.35 | $54,810 |
| North Carolina | 7,380 | 1.68 | 2.21 | $25.96 | $54,000 |
| Rhode Island | 730 | 1.52 | 1.99 | $24.12 | $50,160 |
| Washington | 4,450 | 1.37 | 1.79 | $30.81 | $64,090 |
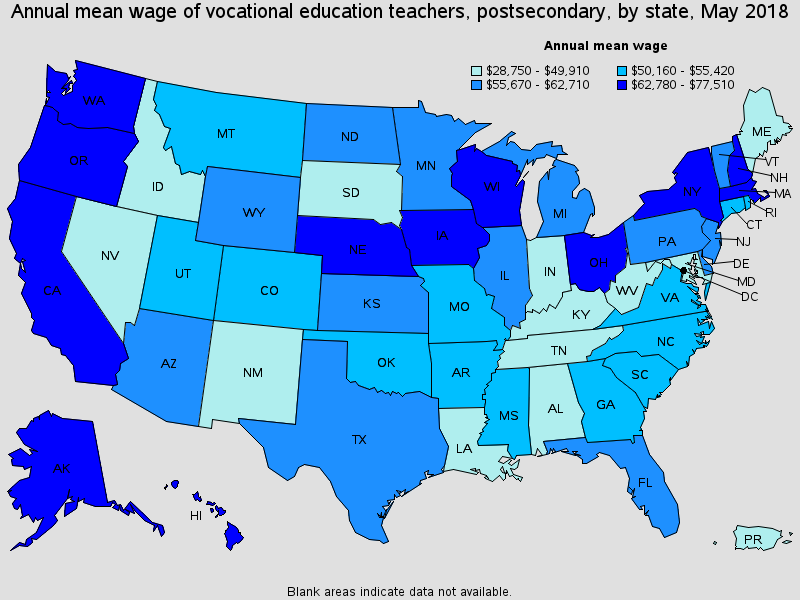
Top paying States for this occupation:
| State | Employment (1) | Employment per thousand jobs | Location quotient (9) | Hourly mean wage | Annual mean wage (2) |
|---|---|---|---|---|---|
| Wisconsin | 1,780 | 0.62 | 0.82 | $37.27 | $77,510 |
| Alaska | 250 | 0.80 | 1.06 | $36.45 | $75,810 |
| California | 9,420 | 0.55 | 0.73 | $34.27 | $71,280 |
| Iowa | 1,510 | 0.98 | 1.28 | $33.22 | $69,100 |
| District of Columbia | (8) | (8) | (8) | $33.12 | $68,900 |
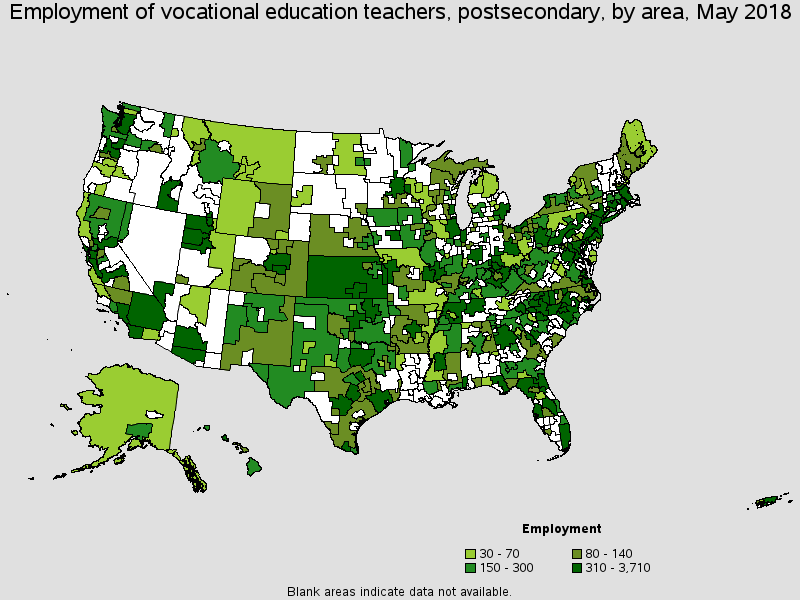
Metropolitan areas with the highest employment level in this occupation:
| Metropolitan area | Employment (1) | Employment per thousand jobs | Location quotient (9) | Hourly mean wage | Annual mean wage (2) |
|---|---|---|---|---|---|
| New York-Newark-Jersey City, NY-NJ-PA | 3,710 | 0.39 | 0.51 | $32.12 | $66,800 |
| Chicago-Naperville-Elgin, IL-IN-WI | 3,650 | 0.79 | 1.03 | $27.17 | $56,520 |
| Dallas-Fort Worth-Arlington, TX | 3,380 | 0.95 | 1.24 | $27.69 | $57,580 |
| Los Angeles-Long Beach-Anaheim, CA | 3,170 | 0.52 | 0.68 | $35.14 | $73,090 |
| Seattle-Tacoma-Bellevue, WA | 2,570 | 1.30 | 1.70 | $32.34 | $67,270 |
| Phoenix-Mesa-Scottsdale, AZ | 2,260 | 1.10 | 1.44 | $26.91 | $55,970 |
| Philadelphia-Camden-Wilmington, PA-NJ-DE-MD | 2,070 | 0.73 | 0.95 | $27.52 | $57,240 |
| Houston-The Woodlands-Sugar Land, TX | 2,000 | 0.67 | 0.88 | $32.40 | $67,390 |
| Miami-Fort Lauderdale-West Palm Beach, FL | 1,850 | 0.72 | 0.94 | $31.20 | $64,900 |
| Atlanta-Sandy Springs-Roswell, GA | 1,770 | 0.66 | 0.86 | $26.64 | $55,410 |
Metropolitan areas with the highest concentration of jobs and location quotients in this occupation:
| Metropolitan area | Employment (1) | Employment per thousand jobs | Location quotient (9) | Hourly mean wage | Annual mean wage (2) |
|---|---|---|---|---|---|
| Logan, UT-ID | 470 | 8.26 | 10.83 | $25.15 | $52,300 |
| Carbondale-Marion, IL | 220 | 4.21 | 5.52 | (8) | (8) |
| Williamsport, PA | 220 | 4.19 | 5.49 | $41.36 | $86,030 |
| Walla Walla, WA | 100 | 3.93 | 5.15 | (8) | (8) |
| Waco, TX | 390 | 3.38 | 4.43 | $26.97 | $56,100 |
| Lawton, OK | 150 | 3.37 | 4.41 | $27.57 | $57,340 |
| Albany, GA | 200 | 3.35 | 4.39 | $26.56 | $55,250 |
| Johnstown, PA | 170 | 3.31 | 4.34 | $23.46 | $48,800 |
| Fayetteville, NC | 420 | 3.23 | 4.24 | $25.03 | $52,060 |
| Ogden-Clearfield, UT | 790 | 3.10 | 4.06 | $24.64 | $51,250 |
Top paying metropolitan areas for this occupation:
| Metropolitan area | Employment (1) | Employment per thousand jobs | Location quotient (9) | Hourly mean wage | Annual mean wage (2) |
|---|---|---|---|---|---|
| Dayton, OH | 560 | 1.48 | 1.94 | $55.36 | $115,140 |
| Des Moines-West Des Moines, IA | 440 | 1.18 | 1.55 | $42.17 | $87,720 |
| Albany, OR | 50 | 0.99 | 1.29 | $41.94 | $87,240 |
| Williamsport, PA | 220 | 4.19 | 5.49 | $41.36 | $86,030 |
| Oxnard-Thousand Oaks-Ventura, CA | 210 | 0.66 | 0.86 | $39.38 | $81,920 |
| Eau Claire, WI | 60 | 0.76 | 1.00 | $38.96 | $81,040 |
| Milwaukee-Waukesha-West Allis, WI | 600 | 0.71 | 0.93 | $38.87 | $80,840 |
| College Station-Bryan, TX | 100 | 0.90 | 1.17 | $37.69 | $78,390 |
| San Francisco-Oakland-Hayward, CA | 1,530 | 0.63 | 0.83 | $37.63 | $78,280 |
| Mount Vernon-Anacortes, WA | 60 | 1.28 | 1.68 | $37.53 | $78,070 |
Nonmetropolitan areas with the highest employment in this occupation:
| Nonmetropolitan area | Employment (1) | Employment per thousand jobs | Location quotient (9) | Hourly mean wage | Annual mean wage (2) |
|---|---|---|---|---|---|
| Piedmont North Carolina nonmetropolitan area | 1,180 | 4.57 | 5.99 | $24.68 | $51,330 |
| Southeast Coastal North Carolina nonmetropolitan area | 530 | 2.11 | 2.76 | $24.60 | $51,160 |
| Central Kentucky nonmetropolitan area | 500 | 2.82 | 3.70 | $27.06 | $56,280 |
| Kansas nonmetropolitan area | 450 | 1.15 | 1.51 | $26.16 | $54,410 |
| Southern Pennsylvania nonmetropolitan area | 400 | 2.11 | 2.77 | $28.10 | $58,440 |
Nonmetropolitan areas with the highest concentration of jobs and location quotients in this occupation:
| Nonmetropolitan area | Employment (1) | Employment per thousand jobs | Location quotient (9) | Hourly mean wage | Annual mean wage (2) |
|---|---|---|---|---|---|
| Piedmont North Carolina nonmetropolitan area | 1,180 | 4.57 | 5.99 | $24.68 | $51,330 |
| North Florida nonmetropolitan area | 380 | 3.24 | 4.24 | $13.87 | $28,850 |
| Central Kentucky nonmetropolitan area | 500 | 2.82 | 3.70 | $27.06 | $56,280 |
| East Kentucky nonmetropolitan area | 270 | 2.74 | 3.59 | $25.68 | $53,410 |
| West Tennessee nonmetropolitan area | 330 | 2.55 | 3.34 | $22.04 | $45,840 |
Top paying nonmetropolitan areas for this occupation:
| Nonmetropolitan area | Employment (1) | Employment per thousand jobs | Location quotient (9) | Hourly mean wage | Annual mean wage (2) |
|---|---|---|---|---|---|
| North Valley-Northern Mountains Region of California nonmetropolitan area | 150 | 1.53 | 2.01 | $40.73 | $84,710 |
| Alaska nonmetropolitan area | 70 | 0.63 | 0.83 | $34.72 | $72,210 |
| Northeast Lower Peninsula of Michigan nonmetropolitan area | 50 | 0.70 | 0.92 | $34.52 | $71,810 |
| North Coast Region of California nonmetropolitan area | 50 | 0.50 | 0.65 | $32.99 | $68,620 |
| Balance of Lower Peninsula of Michigan nonmetropolitan area | (8) | (8) | (8) | $32.61 | $67,820 |
These estimates are calculated with data collected from employers in all industry sectors, all metropolitan and nonmetropolitan areas, and all states and the District of Columbia. The top employment and wage figures are provided above. The complete list is available in the downloadable XLS files.
The percentile wage estimate is the value of a wage below which a certain percent of workers fall. The median wage is the 50th percentile wage estimate--50 percent of workers earn less than the median and 50 percent of workers earn more than the median. More about percentile wages.
(1) Estimates for detailed occupations do not sum to the totals because the totals include occupations not shown separately. Estimates do not include self-employed workers.
(2) Annual wages have been calculated by multiplying the hourly mean wage by a "year-round, full-time" hours figure of 2,080 hours; for those occupations where there is not an hourly wage published, the annual wage has been directly calculated from the reported survey data.
(3) The relative standard error (RSE) is a measure of the reliability of a survey statistic. The smaller the relative standard error, the more precise the estimate.
(7) The value is less than .005 percent of industry employment.
(8) Estimate not released.
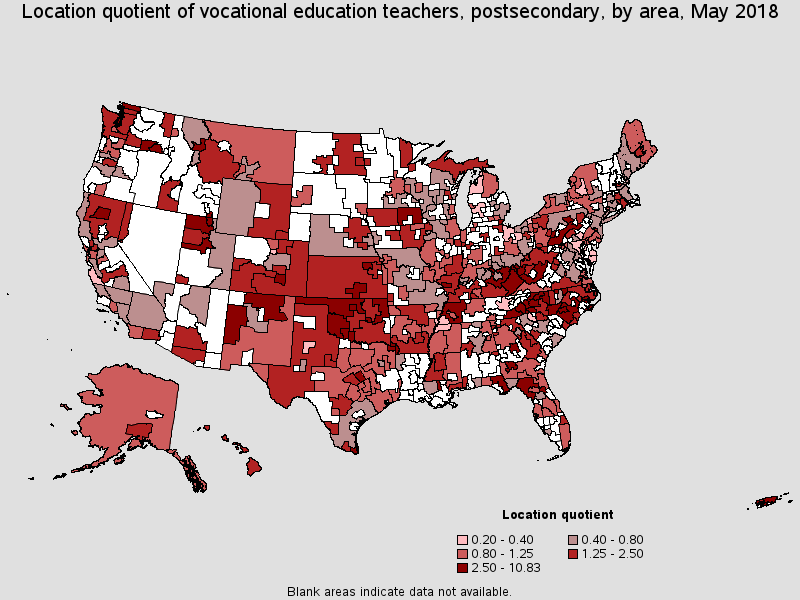
(9) The location quotient is the ratio of the area concentration of occupational employment to the national average concentration. A location quotient greater than one indicates the occupation has a higher share of employment than average, and a location quotient less than one indicates the occupation is less prevalent in the area than average.
Other OES estimates and related information:
May 2018 National Occupational Employment and Wage Estimates
May 2018 State Occupational Employment and Wage Estimates
May 2018 Metropolitan and Nonmetropolitan Area Occupational Employment and Wage Estimates
May 2018 National Industry-Specific Occupational Employment and Wage Estimates
Last Modified Date: March 29, 2019