
An official website of the United States government
An official website of the United States government
The .gov means it's official.
Federal government websites often end in .gov or .mil. Before sharing sensitive information,
make sure you're on a federal government site.
The site is secure.
The
https:// ensures that you are connecting to the official website and that any
information you provide is encrypted and transmitted securely.
Design, cut, and arrange live, dried, or artificial flowers and foliage.
Employment estimate and mean wage estimates for this occupation:
| Employment (1) | Employment RSE (3) |
Mean hourly wage |
Mean annual wage (2) |
Wage RSE (3) |
|---|---|---|---|---|
| 43,360 | 2.3 % | $13.90 | $28,900 | 0.7 % |
Percentile wage estimates for this occupation:
| Percentile | 10% | 25% | 50% (Median) |
75% | 90% |
|---|---|---|---|---|---|
| Hourly Wage | $9.30 | $10.85 | $13.08 | $16.23 | $19.30 |
| Annual Wage (2) | $19,350 | $22,560 | $27,200 | $33,760 | $40,140 |
Industries with the highest published employment and wages for this occupation are provided. For a list of all industries with employment in this occupation, see the Create Customized Tables function.
Industries with the highest levels of employment in this occupation:
| Industry | Employment (1) | Percent of industry employment | Hourly mean wage | Annual mean wage (2) |
|---|---|---|---|---|
| Florists | 28,410 | 45.37 | $13.74 | $28,570 |
| Food and Beverage Stores (4451 and 4452 only) | 6,280 | 0.21 | $14.24 | $29,610 |
| Merchant Wholesalers, Nondurable Goods (4241, 4247, and 4249 only) | 2,370 | 0.42 | $13.19 | $27,430 |
| Sporting Goods, Hobby, and Musical Instrument Stores | 950 | 0.18 | $12.70 | $26,420 |
| General Merchandise Stores | 950 | 0.03 | $13.54 | $28,160 |
Industries with the highest concentration of employment in this occupation:
| Industry | Employment (1) | Percent of industry employment | Hourly mean wage | Annual mean wage (2) |
|---|---|---|---|---|
| Florists | 28,410 | 45.37 | $13.74 | $28,570 |
| Lawn and Garden Equipment and Supplies Stores | 860 | 0.53 | $15.50 | $32,250 |
| Merchant Wholesalers, Nondurable Goods (4241, 4247, and 4249 only) | 2,370 | 0.42 | $13.19 | $27,430 |
| Death Care Services | 290 | 0.21 | $13.68 | $28,460 |
| Food and Beverage Stores (4451 and 4452 only) | 6,280 | 0.21 | $14.24 | $29,610 |
Top paying industries for this occupation:
| Industry | Employment (1) | Percent of industry employment | Hourly mean wage | Annual mean wage (2) |
|---|---|---|---|---|
| Promoters of Performing Arts, Sports, and Similar Events | (8) | (8) | $25.53 | $53,100 |
| Merchant Wholesalers, Nondurable Goods (4244 and 4248 only) | (8) | (8) | $19.50 | $40,560 |
| Other Personal Services | 330 | 0.10 | $18.20 | $37,860 |
| Traveler Accommodation | 190 | 0.01 | $17.39 | $36,180 |
| Special Food Services | 70 | 0.01 | $17.05 | $35,460 |
States and areas with the highest published employment, location quotients, and wages for this occupation are provided. For a list of all areas with employment in this occupation, see the Create Customized Tables function.
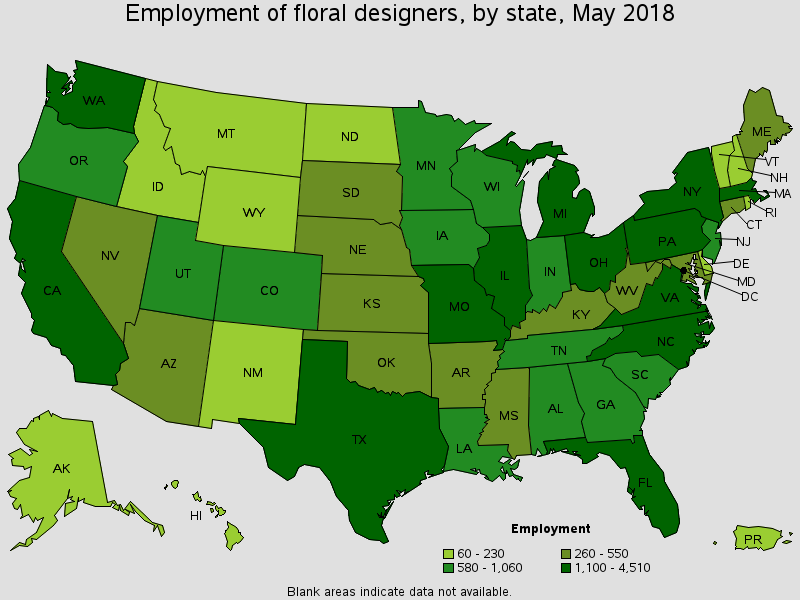
States with the highest employment level in this occupation:
| State | Employment (1) | Employment per thousand jobs | Location quotient (9) | Hourly mean wage | Annual mean wage (2) |
|---|---|---|---|---|---|
| California | 4,510 | 0.26 | 0.88 | $16.36 | $34,020 |
| Texas | 3,050 | 0.25 | 0.84 | $12.24 | $25,460 |
| Florida | 2,850 | 0.33 | 1.10 | $13.79 | $28,680 |
| Missouri | 2,250 | 0.80 | 2.68 | $12.81 | $26,650 |
| New York | 2,020 | 0.22 | 0.72 | $16.12 | $33,520 |

States with the highest concentration of jobs and location quotients in this occupation:
| State | Employment (1) | Employment per thousand jobs | Location quotient (9) | Hourly mean wage | Annual mean wage (2) |
|---|---|---|---|---|---|
| Missouri | 2,250 | 0.80 | 2.68 | $12.81 | $26,650 |
| South Dakota | 260 | 0.62 | 2.07 | $13.50 | $28,080 |
| Wyoming | 140 | 0.51 | 1.71 | $12.48 | $25,950 |
| Oregon | 940 | 0.50 | 1.67 | $12.97 | $26,980 |
| Maine | 280 | 0.46 | 1.55 | $13.02 | $27,080 |
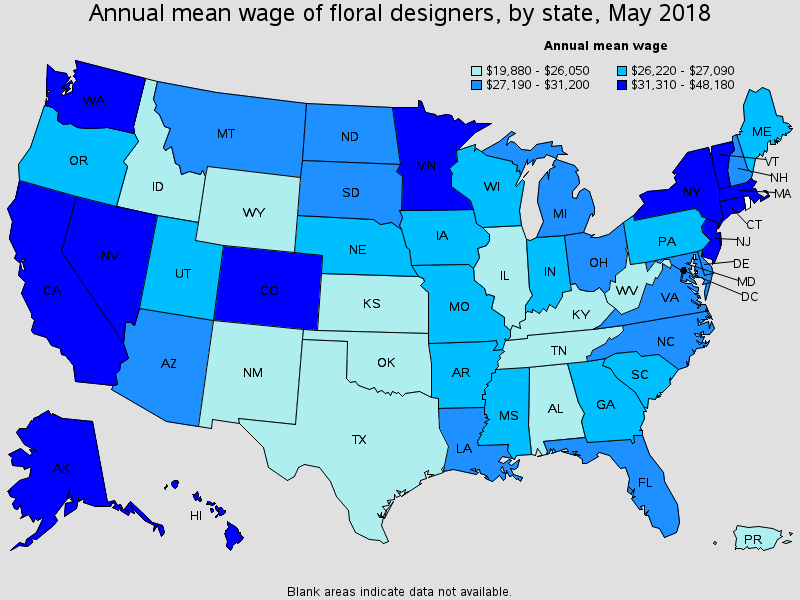
Top paying States for this occupation:
| State | Employment (1) | Employment per thousand jobs | Location quotient (9) | Hourly mean wage | Annual mean wage (2) |
|---|---|---|---|---|---|
| District of Columbia | 90 | 0.12 | 0.40 | $23.16 | $48,180 |
| Connecticut | 550 | 0.33 | 1.10 | $17.56 | $36,530 |
| Nevada | 360 | 0.27 | 0.89 | $16.64 | $34,610 |
| Hawaii | 130 | 0.20 | 0.68 | $16.49 | $34,290 |
| California | 4,510 | 0.26 | 0.88 | $16.36 | $34,020 |
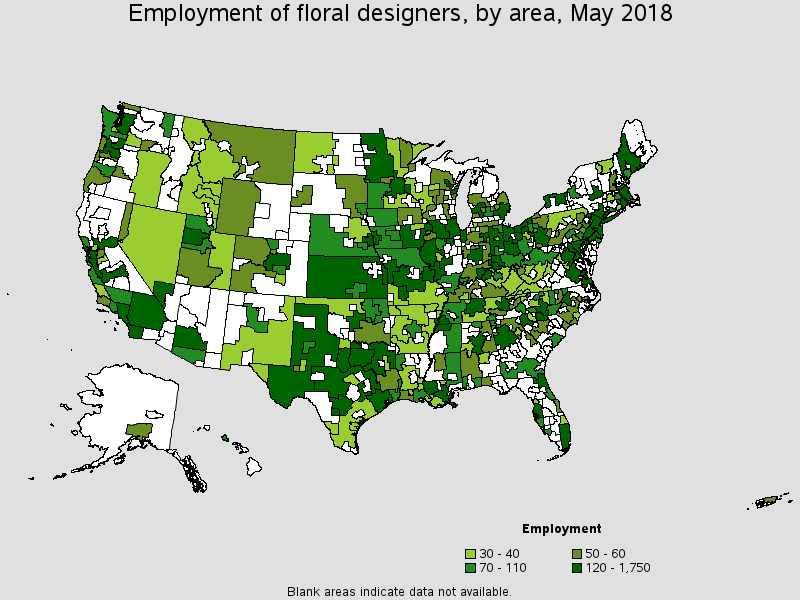
Metropolitan areas with the highest employment level in this occupation:
| Metropolitan area | Employment (1) | Employment per thousand jobs | Location quotient (9) | Hourly mean wage | Annual mean wage (2) |
|---|---|---|---|---|---|
| New York-Newark-Jersey City, NY-NJ-PA | 1,750 | 0.18 | 0.62 | $17.16 | $35,690 |
| Los Angeles-Long Beach-Anaheim, CA | 1,300 | 0.21 | 0.71 | $16.22 | $33,730 |
| Chicago-Naperville-Elgin, IL-IN-WI | 1,190 | 0.26 | 0.86 | $13.33 | $27,730 |
| St. Louis, MO-IL | 1,150 | 0.84 | 2.81 | $12.87 | $26,760 |
| Boston-Cambridge-Nashua, MA-NH | 950 | 0.35 | 1.15 | $16.33 | $33,960 |
| Dallas-Fort Worth-Arlington, TX | 920 | 0.26 | 0.86 | $12.80 | $26,620 |
| Philadelphia-Camden-Wilmington, PA-NJ-DE-MD | 880 | 0.31 | 1.03 | $14.58 | $30,330 |
| San Francisco-Oakland-Hayward, CA | 880 | 0.36 | 1.21 | $18.58 | $38,650 |
| Miami-Fort Lauderdale-West Palm Beach, FL | 790 | 0.30 | 1.02 | $14.09 | $29,300 |
| Portland-Vancouver-Hillsboro, OR-WA | 650 | 0.55 | 1.84 | $12.95 | $26,940 |
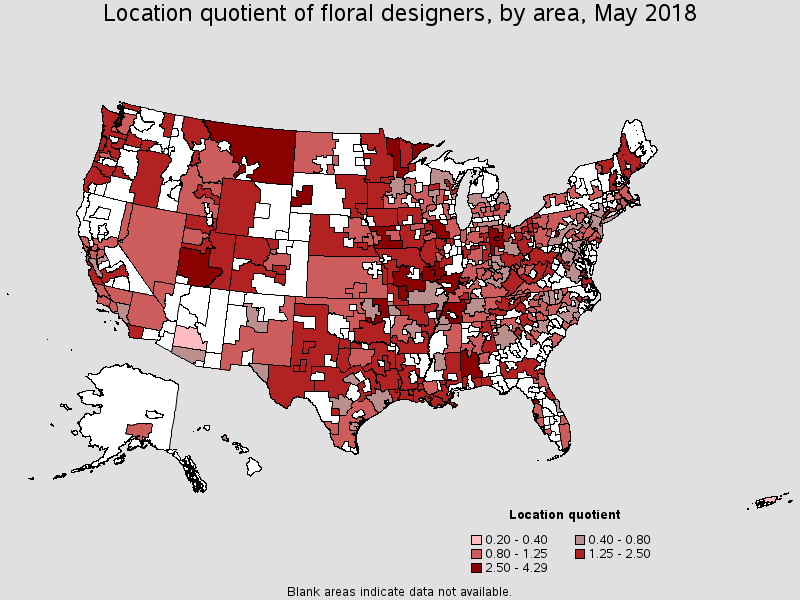
Metropolitan areas with the highest concentration of jobs and location quotients in this occupation:
| Metropolitan area | Employment (1) | Employment per thousand jobs | Location quotient (9) | Hourly mean wage | Annual mean wage (2) |
|---|---|---|---|---|---|
| Homosassa Springs, FL | 30 | 1.02 | 3.39 | $12.08 | $25,130 |
| Springfield, MO | 180 | 0.88 | 2.94 | $12.87 | $26,770 |
| Lima, OH | 40 | 0.87 | 2.90 | $12.62 | $26,240 |
| Altoona, PA | 50 | 0.87 | 2.92 | $10.87 | $22,600 |
| Rapid City, SD | 60 | 0.85 | 2.83 | $11.37 | $23,650 |
| St. Louis, MO-IL | 1,150 | 0.84 | 2.81 | $12.87 | $26,760 |
| Atlantic City-Hammonton, NJ | 90 | 0.74 | 2.47 | $14.18 | $29,490 |
| Odessa, TX | 60 | 0.72 | 2.40 | $13.71 | $28,510 |
| Green Bay, WI | 120 | 0.71 | 2.38 | $11.05 | $22,980 |
| Sioux Falls, SD | 110 | 0.70 | 2.33 | $14.17 | $29,470 |
Top paying metropolitan areas for this occupation:
| Metropolitan area | Employment (1) | Employment per thousand jobs | Location quotient (9) | Hourly mean wage | Annual mean wage (2) |
|---|---|---|---|---|---|
| Santa Maria-Santa Barbara, CA | 50 | 0.26 | 0.87 | $21.70 | $45,140 |
| Santa Rosa, CA | 70 | 0.33 | 1.11 | $19.41 | $40,370 |
| San Francisco-Oakland-Hayward, CA | 880 | 0.36 | 1.21 | $18.58 | $38,650 |
| Hartford-West Hartford-East Hartford, CT | (8) | (8) | (8) | $18.45 | $38,370 |
| Bridgeport-Stamford-Norwalk, CT | 210 | 0.50 | 1.68 | $18.00 | $37,440 |
| New Haven, CT | 100 | 0.34 | 1.13 | $17.96 | $37,360 |
| Minneapolis-St. Paul-Bloomington, MN-WI | 400 | 0.20 | 0.68 | $17.75 | $36,920 |
| Burlington-South Burlington, VT | 40 | 0.35 | 1.17 | $17.41 | $36,210 |
| Las Vegas-Henderson-Paradise, NV | 250 | 0.25 | 0.85 | $17.24 | $35,860 |
| New York-Newark-Jersey City, NY-NJ-PA | 1,750 | 0.18 | 0.62 | $17.16 | $35,690 |
Nonmetropolitan areas with the highest employment in this occupation:
| Nonmetropolitan area | Employment (1) | Employment per thousand jobs | Location quotient (9) | Hourly mean wage | Annual mean wage (2) |
|---|---|---|---|---|---|
| West Northwestern Ohio nonmetropolitan area | 220 | 0.86 | 2.86 | $14.87 | $30,940 |
| Central Missouri nonmetropolitan area | 200 | 1.29 | 4.29 | $12.27 | $25,530 |
| North Texas Region of Texas nonmetropolitan area | 170 | 0.64 | 2.14 | $10.67 | $22,180 |
| Northwest Illinois nonmetropolitan area | 150 | 1.13 | 3.78 | $12.36 | $25,700 |
| Southeast Iowa nonmetropolitan area | 150 | 0.67 | 2.24 | $12.05 | $25,060 |
Nonmetropolitan areas with the highest concentration of jobs and location quotients in this occupation:
| Nonmetropolitan area | Employment (1) | Employment per thousand jobs | Location quotient (9) | Hourly mean wage | Annual mean wage (2) |
|---|---|---|---|---|---|
| Central Missouri nonmetropolitan area | 200 | 1.29 | 4.29 | $12.27 | $25,530 |
| Central Utah nonmetropolitan area | 50 | 1.15 | 3.85 | $11.96 | $24,870 |
| Northwest Illinois nonmetropolitan area | 150 | 1.13 | 3.78 | $12.36 | $25,700 |
| Southwest Iowa nonmetropolitan area | 90 | 1.03 | 3.45 | $11.73 | $24,400 |
| Southwest Alabama nonmetropolitan area | 60 | 0.91 | 3.03 | $12.11 | $25,190 |
Top paying nonmetropolitan areas for this occupation:
| Nonmetropolitan area | Employment (1) | Employment per thousand jobs | Location quotient (9) | Hourly mean wage | Annual mean wage (2) |
|---|---|---|---|---|---|
| Northwest Colorado nonmetropolitan area | 60 | 0.46 | 1.54 | $19.77 | $41,130 |
| Western Washington nonmetropolitan area | 70 | 0.58 | 1.95 | $15.95 | $33,180 |
| Central East New York nonmetropolitan area | (8) | (8) | (8) | $15.48 | $32,200 |
| Nevada nonmetropolitan area | 30 | 0.35 | 1.17 | $14.97 | $31,130 |
| North Arkansas nonmetropolitan area | 40 | 0.38 | 1.26 | $14.92 | $31,020 |
These estimates are calculated with data collected from employers in all industry sectors, all metropolitan and nonmetropolitan areas, and all states and the District of Columbia. The top employment and wage figures are provided above. The complete list is available in the downloadable XLS files.
The percentile wage estimate is the value of a wage below which a certain percent of workers fall. The median wage is the 50th percentile wage estimate--50 percent of workers earn less than the median and 50 percent of workers earn more than the median. More about percentile wages.
(1) Estimates for detailed occupations do not sum to the totals because the totals include occupations not shown separately. Estimates do not include self-employed workers.
(2) Annual wages have been calculated by multiplying the hourly mean wage by a "year-round, full-time" hours figure of 2,080 hours; for those occupations where there is not an hourly wage published, the annual wage has been directly calculated from the reported survey data.
(3) The relative standard error (RSE) is a measure of the reliability of a survey statistic. The smaller the relative standard error, the more precise the estimate.
(8) Estimate not released.
(9) The location quotient is the ratio of the area concentration of occupational employment to the national average concentration. A location quotient greater than one indicates the occupation has a higher share of employment than average, and a location quotient less than one indicates the occupation is less prevalent in the area than average.
Other OES estimates and related information:
May 2018 National Occupational Employment and Wage Estimates
May 2018 State Occupational Employment and Wage Estimates
May 2018 Metropolitan and Nonmetropolitan Area Occupational Employment and Wage Estimates
May 2018 National Industry-Specific Occupational Employment and Wage Estimates
Last Modified Date: March 29, 2019