
An official website of the United States government
An official website of the United States government
The .gov means it's official.
Federal government websites often end in .gov or .mil. Before sharing sensitive information,
make sure you're on a federal government site.
The site is secure.
The
https:// ensures that you are connecting to the official website and that any
information you provide is encrypted and transmitted securely.
Directly supervise and coordinate activities of workers engaged in landscaping or groundskeeping activities. Work may involve reviewing contracts to ascertain service, machine, and workforce requirements; answering inquiries from potential customers regarding methods, material, and price ranges; and preparing estimates according to labor, material, and machine costs.
Employment estimate and mean wage estimates for this occupation:
| Employment (1) | Employment RSE (3) |
Mean hourly wage |
Mean annual wage (2) |
Wage RSE (3) |
|---|---|---|---|---|
| 101,390 | 1.5 % | $24.66 | $51,280 | 0.5 % |
Percentile wage estimates for this occupation:
| Percentile | 10% | 25% | 50% (Median) |
75% | 90% |
|---|---|---|---|---|---|
| Hourly Wage | $14.98 | $18.12 | $23.18 | $29.69 | $37.26 |
| Annual Wage (2) | $31,150 | $37,690 | $48,220 | $61,750 | $77,500 |
Industries with the highest published employment and wages for this occupation are provided. For a list of all industries with employment in this occupation, see the Create Customized Tables function.
Industries with the highest levels of employment in this occupation:
| Industry | Employment (1) | Percent of industry employment | Hourly mean wage | Annual mean wage (2) |
|---|---|---|---|---|
| Services to Buildings and Dwellings | 64,940 | 3.02 | $23.85 | $49,610 |
| Other Amusement and Recreation Industries | 9,570 | 0.73 | $26.51 | $55,140 |
| Local Government, excluding schools and hospitals (OES Designation) | 9,010 | 0.16 | $28.48 | $59,240 |
| Traveler Accommodation | 2,030 | 0.10 | $24.35 | $50,640 |
| Colleges, Universities, and Professional Schools | 1,810 | 0.06 | $24.87 | $51,720 |
Industries with the highest concentration of employment in this occupation:
| Industry | Employment (1) | Percent of industry employment | Hourly mean wage | Annual mean wage (2) |
|---|---|---|---|---|
| Services to Buildings and Dwellings | 64,940 | 3.02 | $23.85 | $49,610 |
| Death Care Services | 1,430 | 1.05 | $24.14 | $50,210 |
| Other Amusement and Recreation Industries | 9,570 | 0.73 | $26.51 | $55,140 |
| Land Subdivision | 170 | 0.45 | $26.19 | $54,470 |
| Lawn and Garden Equipment and Supplies Stores | 720 | 0.44 | $21.82 | $45,390 |
Top paying industries for this occupation:
| Industry | Employment (1) | Percent of industry employment | Hourly mean wage | Annual mean wage (2) |
|---|---|---|---|---|
| Federal Executive Branch (OES Designation) | 140 | 0.01 | $33.71 | $70,110 |
| Farm Product Raw Material Merchant Wholesalers | 30 | 0.04 | $32.75 | $68,120 |
| Other Heavy and Civil Engineering Construction | 70 | 0.06 | $31.98 | $66,530 |
| Residential Building Construction | 200 | 0.03 | $31.65 | $65,840 |
| Electric Power Generation, Transmission and Distribution | 120 | 0.03 | $31.49 | $65,490 |
States and areas with the highest published employment, location quotients, and wages for this occupation are provided. For a list of all areas with employment in this occupation, see the Create Customized Tables function.
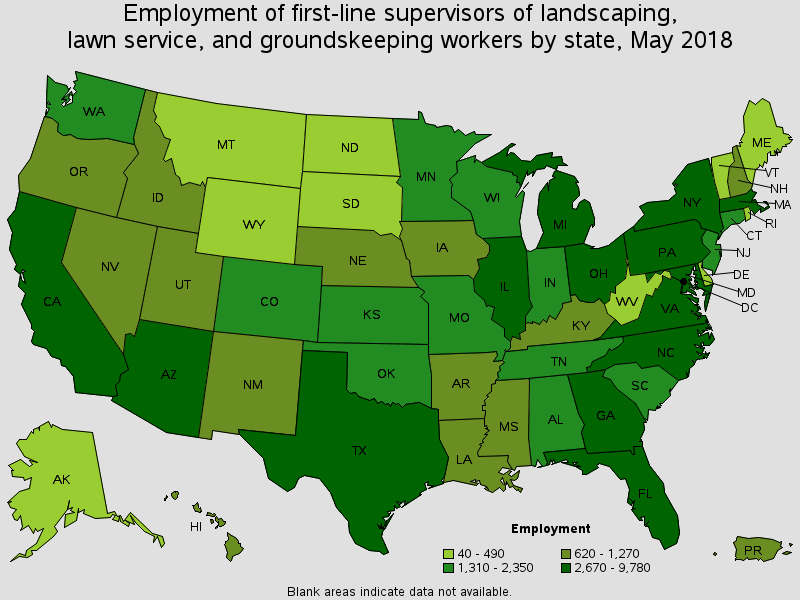
States with the highest employment level in this occupation:
| State | Employment (1) | Employment per thousand jobs | Location quotient (9) | Hourly mean wage | Annual mean wage (2) |
|---|---|---|---|---|---|
| California | 9,780 | 0.57 | 0.82 | $28.68 | $59,640 |
| Florida | 8,870 | 1.03 | 1.47 | $23.08 | $48,010 |
| Texas | 6,120 | 0.51 | 0.72 | $23.03 | $47,900 |
| New York | 5,400 | 0.58 | 0.82 | $28.59 | $59,460 |
| Michigan | 3,770 | 0.87 | 1.25 | $23.02 | $47,880 |
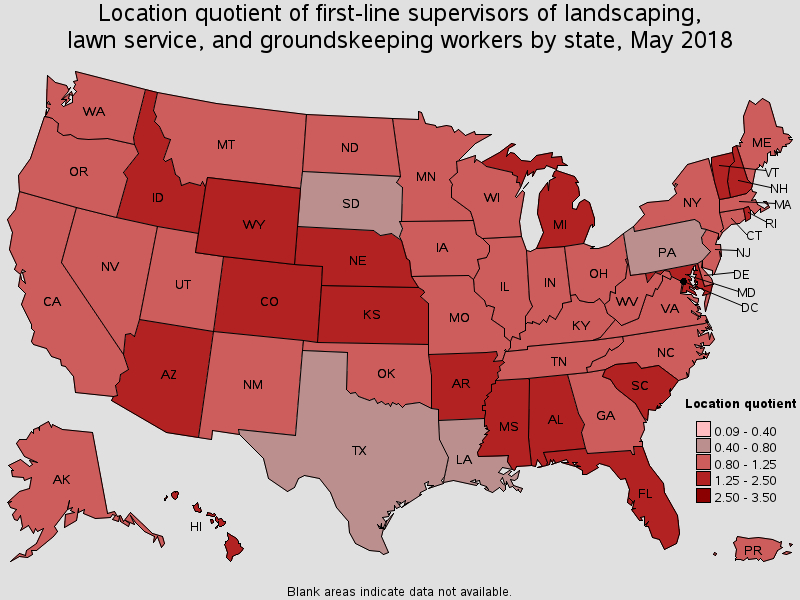
States with the highest concentration of jobs and location quotients in this occupation:
| State | Employment (1) | Employment per thousand jobs | Location quotient (9) | Hourly mean wage | Annual mean wage (2) |
|---|---|---|---|---|---|
| New Hampshire | 800 | 1.23 | 1.76 | $26.93 | $56,020 |
| Maryland | 3,070 | 1.14 | 1.63 | $24.05 | $50,030 |
| Arkansas | 1,270 | 1.05 | 1.50 | $20.68 | $43,010 |
| Arizona | 2,920 | 1.05 | 1.49 | $20.53 | $42,710 |
| Florida | 8,870 | 1.03 | 1.47 | $23.08 | $48,010 |
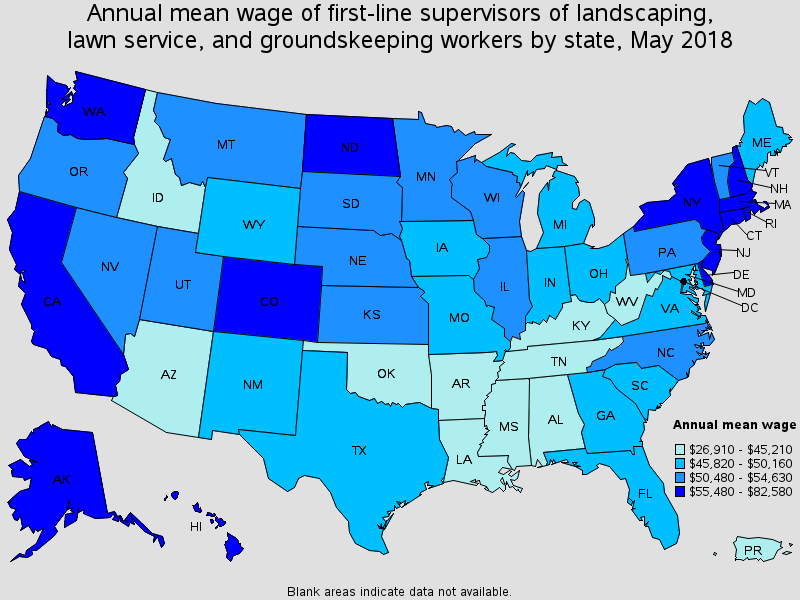
Top paying States for this occupation:
| State | Employment (1) | Employment per thousand jobs | Location quotient (9) | Hourly mean wage | Annual mean wage (2) |
|---|---|---|---|---|---|
| Alaska | 190 | 0.59 | 0.84 | $39.70 | $82,580 |
| North Dakota | 280 | 0.68 | 0.97 | $31.22 | $64,940 |
| Rhode Island | 480 | 0.99 | 1.41 | $30.01 | $62,420 |
| Connecticut | 1,310 | 0.79 | 1.13 | $28.97 | $60,270 |
| California | 9,780 | 0.57 | 0.82 | $28.68 | $59,640 |
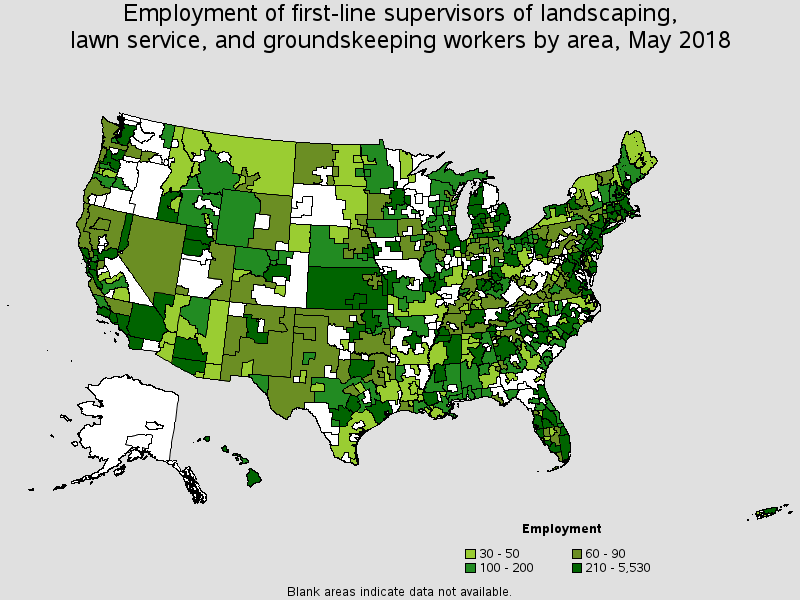
Metropolitan areas with the highest employment level in this occupation:
| Metropolitan area | Employment (1) | Employment per thousand jobs | Location quotient (9) | Hourly mean wage | Annual mean wage (2) |
|---|---|---|---|---|---|
| New York-Newark-Jersey City, NY-NJ-PA | 5,530 | 0.58 | 0.83 | $29.11 | $60,550 |
| Los Angeles-Long Beach-Anaheim, CA | 3,200 | 0.52 | 0.75 | $29.65 | $61,680 |
| Chicago-Naperville-Elgin, IL-IN-WI | 2,970 | 0.64 | 0.91 | $26.55 | $55,230 |
| Washington-Arlington-Alexandria, DC-VA-MD-WV | 2,570 | 0.82 | 1.17 | $25.92 | $53,900 |
| Phoenix-Mesa-Scottsdale, AZ | 2,390 | 1.16 | 1.66 | $20.65 | $42,950 |
| Atlanta-Sandy Springs-Roswell, GA | 2,210 | 0.82 | 1.18 | $23.41 | $48,690 |
| Miami-Fort Lauderdale-West Palm Beach, FL | 2,190 | 0.85 | 1.21 | $24.48 | $50,920 |
| Boston-Cambridge-Nashua, MA-NH | 2,080 | 0.75 | 1.08 | $28.06 | $58,370 |
| Dallas-Fort Worth-Arlington, TX | 1,820 | 0.51 | 0.73 | $24.15 | $50,230 |
| Detroit-Warren-Dearborn, MI | 1,620 | 0.82 | 1.17 | $24.05 | $50,020 |
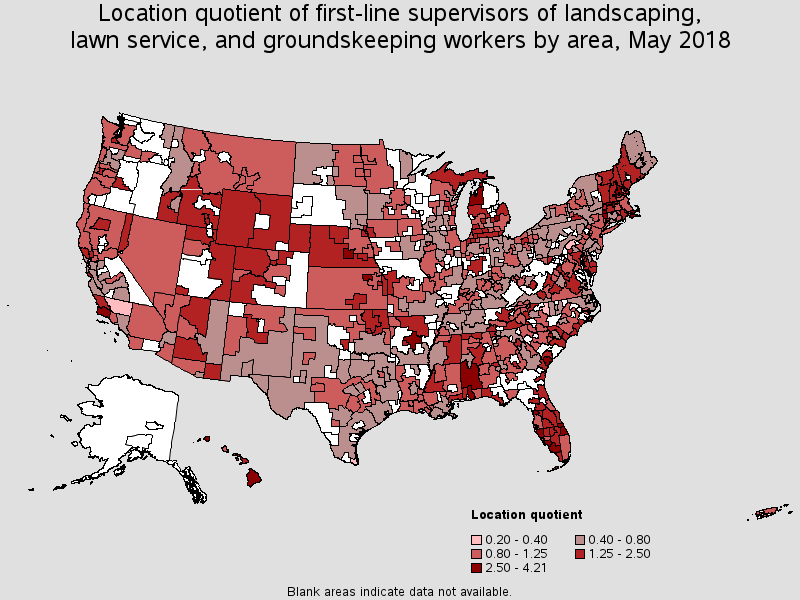
Metropolitan areas with the highest concentration of jobs and location quotients in this occupation:
| Metropolitan area | Employment (1) | Employment per thousand jobs | Location quotient (9) | Hourly mean wage | Annual mean wage (2) |
|---|---|---|---|---|---|
| Sebastian-Vero Beach, FL | 140 | 2.79 | 3.98 | $27.28 | $56,750 |
| Hilton Head Island-Bluffton-Beaufort, SC | 200 | 2.70 | 3.86 | $30.25 | $62,920 |
| Naples-Immokalee-Marco Island, FL | 390 | 2.69 | 3.84 | $27.34 | $56,860 |
| Homosassa Springs, FL | 80 | 2.40 | 3.42 | $20.71 | $43,080 |
| Barnstable Town, MA | 240 | 2.36 | 3.36 | $28.13 | $58,500 |
| Santa Maria-Santa Barbara, CA | 410 | 2.17 | 3.09 | $24.66 | $51,280 |
| North Port-Sarasota-Bradenton, FL | 620 | 2.11 | 3.01 | $19.94 | $41,460 |
| Port St. Lucie, FL | 290 | 2.01 | 2.86 | $30.99 | $64,470 |
| Manhattan, KS | 80 | 1.99 | 2.85 | $22.12 | $46,010 |
| Daphne-Fairhope-Foley, AL | 140 | 1.98 | 2.82 | $23.33 | $48,530 |
Top paying metropolitan areas for this occupation:
| Metropolitan area | Employment (1) | Employment per thousand jobs | Location quotient (9) | Hourly mean wage | Annual mean wage (2) |
|---|---|---|---|---|---|
| Anchorage, AK | (8) | (8) | (8) | $41.36 | $86,020 |
| Visalia-Porterville, CA | 50 | 0.35 | 0.50 | $34.32 | $71,380 |
| Bremerton-Silverdale, WA | (8) | (8) | (8) | $34.06 | $70,850 |
| Fargo, ND-MN | 100 | 0.75 | 1.07 | $33.86 | $70,420 |
| Spokane-Spokane Valley, WA | 110 | 0.45 | 0.64 | $32.62 | $67,850 |
| Bismarck, ND | (8) | (8) | (8) | $32.43 | $67,460 |
| Trenton, NJ | 80 | 0.35 | 0.50 | $32.26 | $67,110 |
| Norwich-New London-Westerly, CT-RI | 90 | 0.78 | 1.11 | $31.52 | $65,570 |
| San Jose-Sunnyvale-Santa Clara, CA | 460 | 0.41 | 0.58 | $31.33 | $65,160 |
| Port St. Lucie, FL | 290 | 2.01 | 2.86 | $30.99 | $64,470 |
Nonmetropolitan areas with the highest employment in this occupation:
| Nonmetropolitan area | Employment (1) | Employment per thousand jobs | Location quotient (9) | Hourly mean wage | Annual mean wage (2) |
|---|---|---|---|---|---|
| Balance of Lower Peninsula of Michigan nonmetropolitan area | 310 | 1.14 | 1.62 | $21.19 | $44,060 |
| Kansas nonmetropolitan area | 230 | 0.59 | 0.85 | $23.82 | $49,540 |
| Northeast Mississippi nonmetropolitan area | 230 | 0.97 | 1.38 | $17.53 | $36,460 |
| Central New Hampshire nonmetropolitan area | 230 | 2.33 | 3.33 | $22.69 | $47,190 |
| Northwest Lower Peninsula of Michigan nonmetropolitan area | 220 | 1.76 | 2.51 | $22.40 | $46,590 |
Nonmetropolitan areas with the highest concentration of jobs and location quotients in this occupation:
| Nonmetropolitan area | Employment (1) | Employment per thousand jobs | Location quotient (9) | Hourly mean wage | Annual mean wage (2) |
|---|---|---|---|---|---|
| Massachusetts nonmetropolitan area | 180 | 2.95 | 4.21 | $30.48 | $63,390 |
| Central New Hampshire nonmetropolitan area | 230 | 2.33 | 3.33 | $22.69 | $47,190 |
| Hawaii / Kauai nonmetropolitan area | 210 | 2.08 | 2.97 | $28.14 | $58,530 |
| Connecticut nonmetropolitan area | 70 | 1.99 | 2.84 | $28.49 | $59,250 |
| Northwest Lower Peninsula of Michigan nonmetropolitan area | 220 | 1.76 | 2.51 | $22.40 | $46,590 |
Top paying nonmetropolitan areas for this occupation:
| Nonmetropolitan area | Employment (1) | Employment per thousand jobs | Location quotient (9) | Hourly mean wage | Annual mean wage (2) |
|---|---|---|---|---|---|
| Western Washington nonmetropolitan area | 80 | 0.63 | 0.90 | $34.76 | $72,300 |
| Massachusetts nonmetropolitan area | 180 | 2.95 | 4.21 | $30.48 | $63,390 |
| Northern New Hampshire nonmetropolitan area | 30 | 0.93 | 1.33 | $30.15 | $62,720 |
| Hill Country Region of Texas nonmetropolitan area | 130 | 0.66 | 0.95 | $30.09 | $62,580 |
| West North Dakota nonmetropolitan area | 60 | 0.46 | 0.66 | $29.63 | $61,620 |
These estimates are calculated with data collected from employers in all industry sectors, all metropolitan and nonmetropolitan areas, and all states and the District of Columbia. The top employment and wage figures are provided above. The complete list is available in the downloadable XLS files.
The percentile wage estimate is the value of a wage below which a certain percent of workers fall. The median wage is the 50th percentile wage estimate--50 percent of workers earn less than the median and 50 percent of workers earn more than the median. More about percentile wages.
(1) Estimates for detailed occupations do not sum to the totals because the totals include occupations not shown separately. Estimates do not include self-employed workers.
(2) Annual wages have been calculated by multiplying the hourly mean wage by a "year-round, full-time" hours figure of 2,080 hours; for those occupations where there is not an hourly wage published, the annual wage has been directly calculated from the reported survey data.
(3) The relative standard error (RSE) is a measure of the reliability of a survey statistic. The smaller the relative standard error, the more precise the estimate.
(8) Estimate not released.
(9) The location quotient is the ratio of the area concentration of occupational employment to the national average concentration. A location quotient greater than one indicates the occupation has a higher share of employment than average, and a location quotient less than one indicates the occupation is less prevalent in the area than average.
Other OES estimates and related information:
May 2018 National Occupational Employment and Wage Estimates
May 2018 State Occupational Employment and Wage Estimates
May 2018 Metropolitan and Nonmetropolitan Area Occupational Employment and Wage Estimates
May 2018 National Industry-Specific Occupational Employment and Wage Estimates
Last Modified Date: March 29, 2019