
An official website of the United States government
An official website of the United States government
The .gov means it's official.
Federal government websites often end in .gov or .mil. Before sharing sensitive information,
make sure you're on a federal government site.
The site is secure.
The
https:// ensures that you are connecting to the official website and that any
information you provide is encrypted and transmitted securely.
All sales and related workers not listed separately.
Employment estimate and mean wage estimates for this occupation:
| Employment (1) | Employment RSE (3) |
Mean hourly wage |
Mean annual wage (2) |
Wage RSE (3) |
|---|---|---|---|---|
| 95,690 | 1.7 % | $19.46 | $40,480 | 0.7 % |
Percentile wage estimates for this occupation:
| Percentile | 10% | 25% | 50% (Median) |
75% | 90% |
|---|---|---|---|---|---|
| Hourly Wage | $10.29 | $11.76 | $15.97 | $23.46 | $33.02 |
| Annual Wage (2) | $21,410 | $24,460 | $33,220 | $48,800 | $68,670 |
Industries with the highest published employment and wages for this occupation are provided. For a list of all industries with employment in this occupation, see the Create Customized Tables function.
Industries with the highest levels of employment in this occupation:
| Industry | Employment (1) | Percent of industry employment | Hourly mean wage | Annual mean wage (2) |
|---|---|---|---|---|
| Nondepository Credit Intermediation | 4,290 | 0.70 | $14.85 | $30,880 |
| Food and Beverage Stores (4451 and 4452 only) | 4,170 | 0.14 | $15.61 | $32,470 |
| Miscellaneous Store Retailers (4532 and 4533 only) | 4,160 | 0.97 | $13.03 | $27,100 |
| Electronic Shopping and Mail-Order Houses | 3,830 | 0.96 | $24.83 | $51,650 |
| Automobile Dealers | 3,270 | 0.25 | $21.60 | $44,930 |
Industries with the highest concentration of employment in this occupation:
| Industry | Employment (1) | Percent of industry employment | Hourly mean wage | Annual mean wage (2) |
|---|---|---|---|---|
| Miscellaneous Store Retailers (4532 and 4533 only) | 4,160 | 0.97 | $13.03 | $27,100 |
| Electronic Shopping and Mail-Order Houses | 3,830 | 0.96 | $24.83 | $51,650 |
| Vending Machine Operators | 360 | 0.94 | (8) | (8) |
| Farm Product Raw Material Merchant Wholesalers | 640 | 0.87 | $20.25 | $42,120 |
| Nondepository Credit Intermediation | 4,290 | 0.70 | $14.85 | $30,880 |
Top paying industries for this occupation:
| Industry | Employment (1) | Percent of industry employment | Hourly mean wage | Annual mean wage (2) |
|---|---|---|---|---|
| Electric Power Generation, Transmission and Distribution | 40 | 0.01 | $34.25 | $71,240 |
| Business Schools and Computer and Management Training | 50 | 0.08 | $34.18 | $71,100 |
| Medical and Diagnostic Laboratories | 70 | 0.03 | $33.33 | $69,320 |
| Scientific Research and Development Services | 110 | 0.02 | $32.82 | $68,260 |
| Postal Service (federal government) | 190 | 0.03 | $32.63 | $67,880 |
States and areas with the highest published employment, location quotients, and wages for this occupation are provided. For a list of all areas with employment in this occupation, see the Create Customized Tables function.
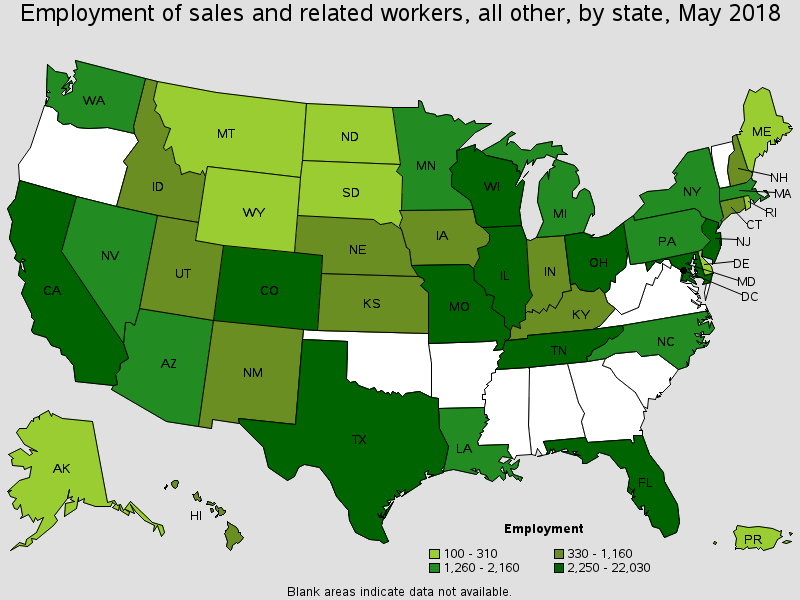
States with the highest employment level in this occupation:
| State | Employment (1) | Employment per thousand jobs | Location quotient (9) | Hourly mean wage | Annual mean wage (2) |
|---|---|---|---|---|---|
| California | 22,030 | 1.30 | 1.96 | $23.99 | $49,900 |
| Texas | 8,400 | 0.69 | 1.05 | $16.05 | $33,390 |
| Florida | 6,350 | 0.74 | 1.12 | $17.52 | $36,440 |
| New Jersey | 6,020 | 1.49 | 2.25 | $26.50 | $55,120 |
| Colorado | 4,150 | 1.58 | 2.39 | $20.29 | $42,210 |
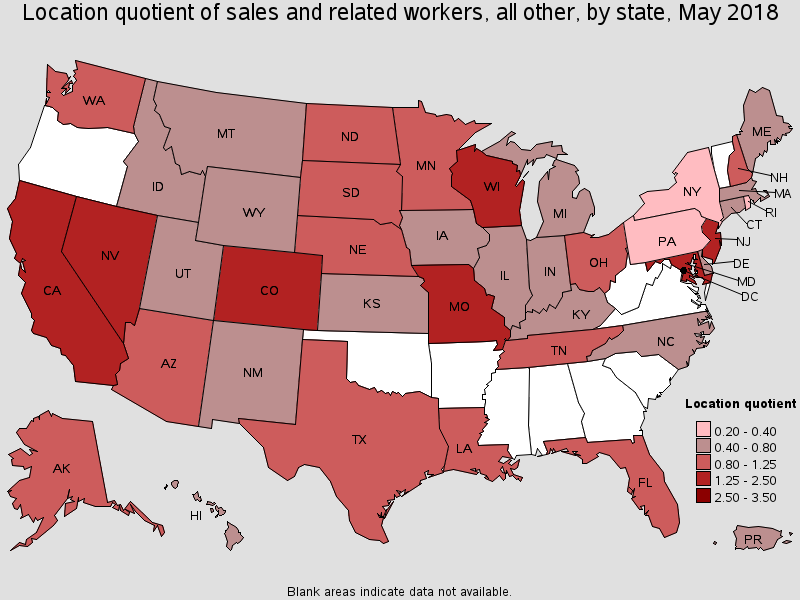
States with the highest concentration of jobs and location quotients in this occupation:
| State | Employment (1) | Employment per thousand jobs | Location quotient (9) | Hourly mean wage | Annual mean wage (2) |
|---|---|---|---|---|---|
| Colorado | 4,150 | 1.58 | 2.39 | $20.29 | $42,210 |
| New Jersey | 6,020 | 1.49 | 2.25 | $26.50 | $55,120 |
| California | 22,030 | 1.30 | 1.96 | $23.99 | $49,900 |
| Nevada | 1,420 | 1.05 | 1.59 | $16.47 | $34,260 |
| Maryland | 2,710 | 1.01 | 1.53 | $17.55 | $36,500 |
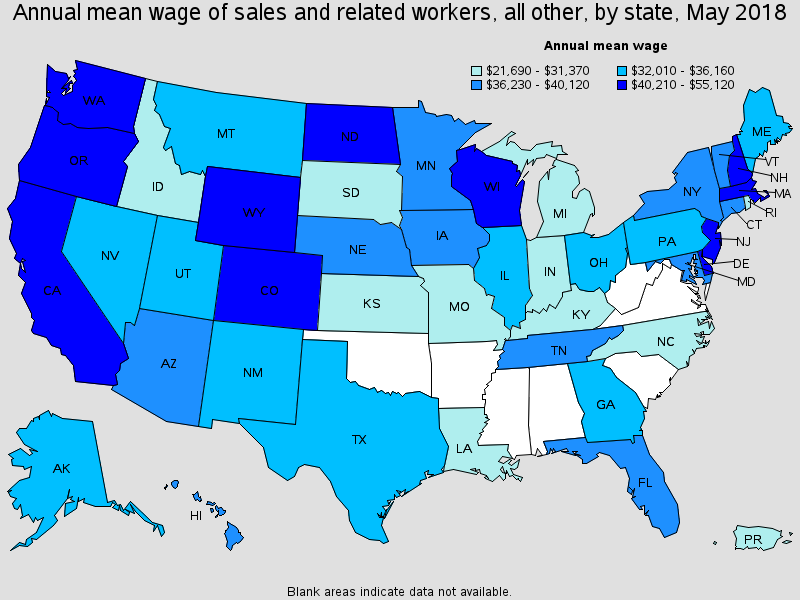
Top paying States for this occupation:
| State | Employment (1) | Employment per thousand jobs | Location quotient (9) | Hourly mean wage | Annual mean wage (2) |
|---|---|---|---|---|---|
| New Jersey | 6,020 | 1.49 | 2.25 | $26.50 | $55,120 |
| Massachusetts | 1,260 | 0.35 | 0.54 | $24.62 | $51,210 |
| Delaware | 180 | 0.40 | 0.61 | $24.33 | $50,610 |
| California | 22,030 | 1.30 | 1.96 | $23.99 | $49,900 |
| Washington | 1,760 | 0.54 | 0.81 | $21.96 | $45,680 |
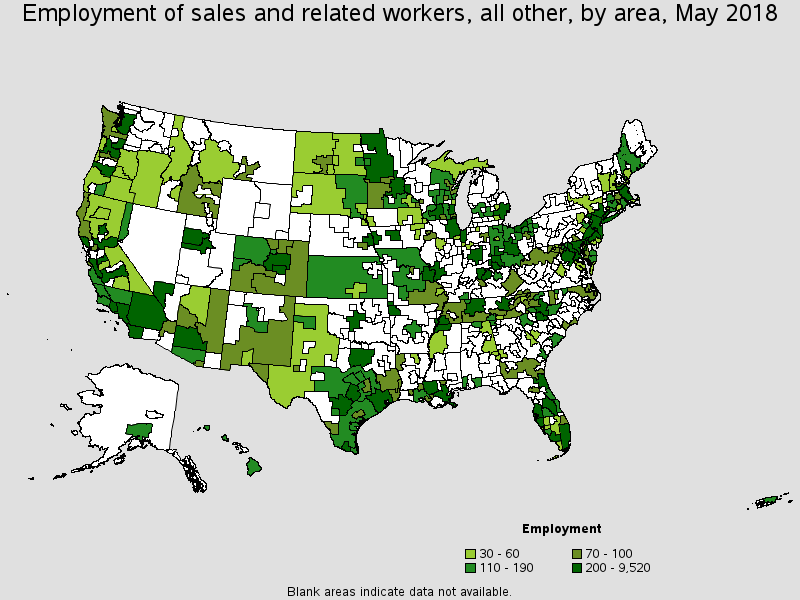
Metropolitan areas with the highest employment level in this occupation:
| Metropolitan area | Employment (1) | Employment per thousand jobs | Location quotient (9) | Hourly mean wage | Annual mean wage (2) |
|---|---|---|---|---|---|
| Los Angeles-Long Beach-Anaheim, CA | 9,520 | 1.56 | 2.35 | $23.38 | $48,640 |
| New York-Newark-Jersey City, NY-NJ-PA | 6,180 | 0.65 | 0.98 | $24.54 | $51,050 |
| Denver-Aurora-Lakewood, CO | 2,770 | 1.87 | 2.83 | $21.81 | $45,370 |
| Houston-The Woodlands-Sugar Land, TX | 2,170 | 0.73 | 1.10 | $15.66 | $32,570 |
| Dallas-Fort Worth-Arlington, TX | 1,860 | 0.52 | 0.79 | $16.66 | $34,660 |
| Miami-Fort Lauderdale-West Palm Beach, FL | 1,730 | 0.67 | 1.01 | $18.53 | $38,540 |
| San Diego-Carlsbad, CA | 1,720 | 1.18 | 1.78 | $24.51 | $50,980 |
| Portland-Vancouver-Hillsboro, OR-WA | 1,720 | 1.44 | 2.18 | $21.21 | $44,120 |
| San Jose-Sunnyvale-Santa Clara, CA | 1,630 | 1.46 | 2.21 | $27.40 | $56,990 |
| Riverside-San Bernardino-Ontario, CA | 1,620 | 1.08 | 1.64 | $19.57 | $40,700 |
Metropolitan areas with the highest concentration of jobs and location quotients in this occupation:
| Metropolitan area | Employment (1) | Employment per thousand jobs | Location quotient (9) | Hourly mean wage | Annual mean wage (2) |
|---|---|---|---|---|---|
| Chico, CA | 210 | 2.55 | 3.85 | $17.67 | $36,750 |
| Grand Junction, CO | 120 | 1.95 | 2.95 | $14.50 | $30,160 |
| Denver-Aurora-Lakewood, CO | 2,770 | 1.87 | 2.83 | $21.81 | $45,370 |
| Oxnard-Thousand Oaks-Ventura, CA | 580 | 1.84 | 2.78 | $23.14 | $48,130 |
| Victoria, TX | 70 | 1.78 | 2.69 | $14.83 | $30,850 |
| Eugene, OR | 260 | 1.66 | 2.51 | $17.76 | $36,950 |
| Naples-Immokalee-Marco Island, FL | 230 | 1.59 | 2.41 | $15.74 | $32,750 |
| Los Angeles-Long Beach-Anaheim, CA | 9,520 | 1.56 | 2.35 | $23.38 | $48,640 |
| San Jose-Sunnyvale-Santa Clara, CA | 1,630 | 1.46 | 2.21 | $27.40 | $56,990 |
| Medford, OR | 130 | 1.46 | 2.21 | $19.39 | $40,330 |
Top paying metropolitan areas for this occupation:
| Metropolitan area | Employment (1) | Employment per thousand jobs | Location quotient (9) | Hourly mean wage | Annual mean wage (2) |
|---|---|---|---|---|---|
| San Francisco-Oakland-Hayward, CA | (8) | (8) | (8) | $28.74 | $59,790 |
| El Centro, CA | (8) | (8) | (8) | $28.66 | $59,620 |
| San Jose-Sunnyvale-Santa Clara, CA | 1,630 | 1.46 | 2.21 | $27.40 | $56,990 |
| Fresno, CA | 250 | 0.65 | 0.99 | $26.73 | $55,600 |
| Boston-Cambridge-Nashua, MA-NH | 1,030 | 0.37 | 0.57 | $26.61 | $55,340 |
| Bismarck, ND | 80 | 1.21 | 1.83 | $26.10 | $54,290 |
| Nashville-Davidson--Murfreesboro--Franklin, TN | 860 | 0.89 | 1.34 | $25.96 | $53,990 |
| Green Bay, WI | 100 | 0.56 | 0.85 | $25.73 | $53,520 |
| Salinas, CA | 170 | 0.92 | 1.40 | $25.27 | $52,560 |
| Johnson City, TN | 50 | 0.63 | 0.95 | $25.13 | $52,270 |
Nonmetropolitan areas with the highest employment in this occupation:
| Nonmetropolitan area | Employment (1) | Employment per thousand jobs | Location quotient (9) | Hourly mean wage | Annual mean wage (2) |
|---|---|---|---|---|---|
| Northwest Minnesota nonmetropolitan area | 260 | 1.33 | 2.02 | $17.48 | $36,360 |
| Kansas nonmetropolitan area | 190 | 0.50 | 0.75 | $14.43 | $30,020 |
| North Northeastern Ohio non-metropolitan area (non-contiguous) | 190 | 0.56 | 0.84 | $14.51 | $30,170 |
| South Central Wisconsin nonmetropolitan area | 190 | 0.89 | 1.35 | $18.50 | $38,490 |
| Northeastern Wisconsin nonmetropolitan area | 170 | 0.85 | 1.28 | $15.19 | $31,590 |
Nonmetropolitan areas with the highest concentration of jobs and location quotients in this occupation:
| Nonmetropolitan area | Employment (1) | Employment per thousand jobs | Location quotient (9) | Hourly mean wage | Annual mean wage (2) |
|---|---|---|---|---|---|
| Maryland nonmetropolitan area | 100 | 1.73 | 2.61 | $13.19 | $27,440 |
| Eastern and Southern Colorado nonmetropolitan area | 100 | 1.50 | 2.27 | $13.93 | $28,980 |
| Northwest Minnesota nonmetropolitan area | 260 | 1.33 | 2.02 | $17.48 | $36,360 |
| North Missouri nonmetropolitan area | 140 | 1.25 | 1.89 | $13.74 | $28,580 |
| Northwest Colorado nonmetropolitan area | 140 | 1.16 | 1.76 | $17.19 | $35,760 |
Top paying nonmetropolitan areas for this occupation:
| Nonmetropolitan area | Employment (1) | Employment per thousand jobs | Location quotient (9) | Hourly mean wage | Annual mean wage (2) |
|---|---|---|---|---|---|
| Northeast Coastal North Carolina nonmetropolitan area | 80 | 0.81 | 1.22 | $27.32 | $56,820 |
| Northeast Iowa nonmetropolitan area | 40 | 0.38 | 0.58 | $23.36 | $48,590 |
| Arizona nonmetropolitan area | 100 | 1.09 | 1.64 | $23.01 | $47,870 |
| Western Washington nonmetropolitan area | 70 | 0.55 | 0.83 | $22.63 | $47,080 |
| East North Dakota nonmetropolitan area | 30 | 0.52 | 0.79 | $20.86 | $43,390 |
These estimates are calculated with data collected from employers in all industry sectors, all metropolitan and nonmetropolitan areas, and all states and the District of Columbia. The top employment and wage figures are provided above. The complete list is available in the downloadable XLS files.
The percentile wage estimate is the value of a wage below which a certain percent of workers fall. The median wage is the 50th percentile wage estimate--50 percent of workers earn less than the median and 50 percent of workers earn more than the median. More about percentile wages.
(1) Estimates for detailed occupations do not sum to the totals because the totals include occupations not shown separately. Estimates do not include self-employed workers.
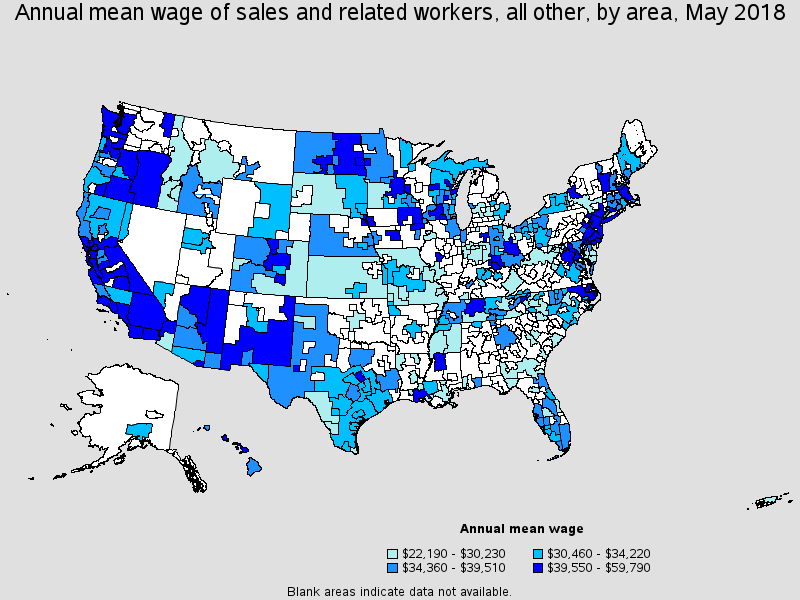
(2) Annual wages have been calculated by multiplying the hourly mean wage by a "year-round, full-time" hours figure of 2,080 hours; for those occupations where there is not an hourly wage published, the annual wage has been directly calculated from the reported survey data.
(3) The relative standard error (RSE) is a measure of the reliability of a survey statistic. The smaller the relative standard error, the more precise the estimate.
(8) Estimate not released.
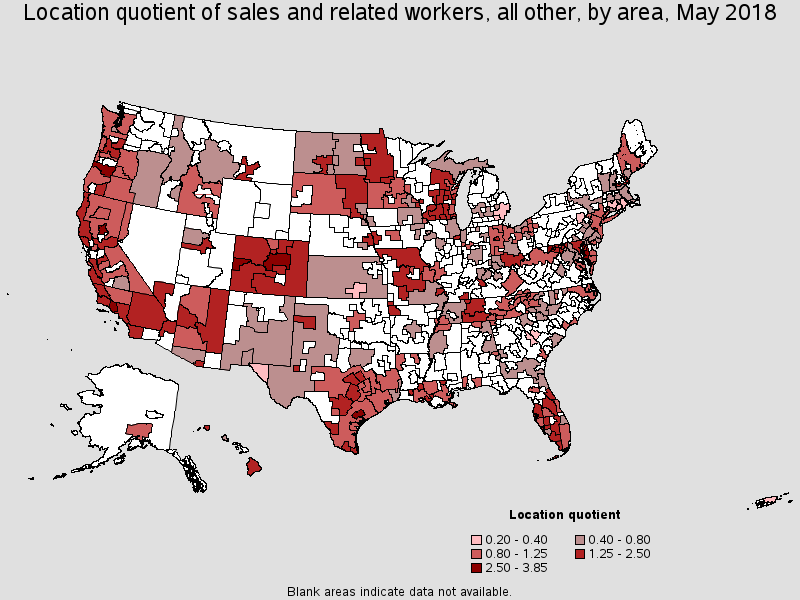
(9) The location quotient is the ratio of the area concentration of occupational employment to the national average concentration. A location quotient greater than one indicates the occupation has a higher share of employment than average, and a location quotient less than one indicates the occupation is less prevalent in the area than average.
Other OES estimates and related information:
May 2018 National Occupational Employment and Wage Estimates
May 2018 State Occupational Employment and Wage Estimates
May 2018 Metropolitan and Nonmetropolitan Area Occupational Employment and Wage Estimates
May 2018 National Industry-Specific Occupational Employment and Wage Estimates
Last Modified Date: March 29, 2019